
Comparison of Air Trac Management
related operational and economic
performance
U.S. - Europe
January 2024
This report is a joint publication of the Air Traffic Organization of the FAA (FAA-ATO System
Operations Services) and of the EUROCONTROL Aviation Intelligence Unit (AIU) on behalf of the
European Commission in the interest of the exchange of information.
It is prepared in application of Appendix 2 to Annex 1 of the Memorandum of Cooperation NAT-I-
9406A signed between the United States of America and the European Union on 13 December 2017
and managed by a joint European Commission-FAA Performance Analysis Review Committee
(PARC).
The objective is to make a factual high-level comparison of Air Traffic Management (ATM)
performance between the U.S. and Europe based on a set of comparable performance indicators,
developed jointly, and reviewed over time.
Rolf Tuchhardt
PARC Co-Chair, European Commission
Kevin Hanson
PARC Co-Chair, U.S., FAA
COPYRIGHT NOTICE AND DISCLAIMER
Every possible effort was made to ensure that the information and analysis contained in this document
are as accurate and complete as possible. Should you find any errors or inconsistencies we would be
grateful if you could bring them to our attention.
The document may be copied in whole or in part, provided that the copyright notice and disclaimer
are included and it is not used for commercial purposes (i.e. for financial gain). The information
contained in this document may not be modified without prior written permission from the Air Traffic
Organization System Operations Services or the European Commission.
The views expressed herein do not necessarily reflect the official views or policy of the FAA, the
European Commission or EUROCONTROL, which make no warranty, either implied or express, for the
information contained in this document, neither do they assume any legal liability or responsibility for
the accuracy, completeness or usefulness of this information.
© Air Traffic Organization System Operations Services (FAA-ATO)
© European Commission (EC)
© European Organisation for the Safety of Air Navigation (EUROCONTROL)

i EXECUTIVE SUMMARY
U.S. – Europe Comparison of ANS performance (Edition 2023)
EXECUTIVE SUMMARY
KEY MESSAGES
INTRODUCTION
• This report is the eighth in a series of
comparisons between the U.S. and Europe.
• The objective of the work conducted by the
U.S. Air Traffic Organization (FAA-ATO)
Office of Performance Analysis and the
EUROCONTROL Aviation Intelligence Unit
(AIU) is to compare, understand, and further
improve air traffic management (ATM)
performance in both systems.
• The report looks at the operational and
economic ATM performance in both systems
since the outbreak of the pandemic in 2020.
Where appropriate, it also follows up on
longer term trends and differences in ATM
performance between the U.S. and Europe,
identified in previous reports.
• Russia’s invasion of Ukraine in February 2022
and the unfolding effects of the war also
influenced the analyses in this report. While
most European traffic is not directly affected
by the resulting airspace closures, there are
substantial direct operational and economic
impacts on several States in the region.
• To ensure comparability based on a common
set of data sources with a sufficient level of
detail and coverage, the operational
comparison of Air Navigation Service (ANS)
performance was limited to flights to or from
the main 34 airports for IFR traffic in the U.S.
and in Europe which account for
approximately 68% and 65% of the controlled
flights in Europe and the U.S., respectively.
ORGANISATION OF ATM
• For the interpretation of the results, it is
useful to start with a summary of the
organization of ATM in the U.S. and in
Europe.
• While both systems are operated with similar
technology and operational concepts, a
significant distinguishing factor is that the
U.S. airspace is handled by a single air
navigation service provider (ANSP) while
Europe is managed by close to 40 different
service providers.
• In 2022, the U.S. controlled notably more
flights operating under instrumental flight
rules (IFR) with less controllers and less en-
route control centres.
• Despite the efforts of the Single European
Sky Initiative to reduce fragmentation and to
better organise European airspace according
to traffic flows rather than national
boundaries, many issues in Europe revolve
around the level of fragmentation and its
impact on ATM performance in terms of
operations and costs.
FLOW MANAGEMENT TECHNIQUES
• To minimize the effects of ATM-related
constraints, the U.S. and Europe use
comparable methodologies to balance
demand and capacity but both systems differ
notably in the timing (when) and the phase of
flight (where) air traffic flow management
(ATFM) measures are applied.
• In Europe, a lot of emphasis is put on strategic
planning and a large part of the demand/
capacity management measures are applied
months in advance. Unlike in the U.S. where
only 3 airports have schedule limitations,
traffic at major European airports is usually

ii EXECUTIVE SUMMARY
U.S. – Europe Comparison of ANS performance (Edition 2023)
already regulated (in terms of volume and
concentration) in the strategic phase through
an airport scheduling process.
• With no or very limited en-route spacing or
metering in Europe, the focus in Europe is on
anticipating demand/ capacity imbalances in
en-route centres or at airports and, if
necessary, to solve them by delaying aircraft
at the origin airports on the ground
(allocation of ATFM take-off slots).
• In the U.S., the emphasis is more on the
tactical traffic management in the gate-to-
gate phase to maximize system and airport
throughput under prevailing conditions on
the day of operations. The approach
is supported by the en-route function and less
en-route capacity constraints than in Europe.
This enables delay to be absorbed through
path stretching in the en-route airspace
and to achieve the metering required by
TMAs and airports.
• Hence, many issues in the U.S. appear to be
attributable to the effects of capacity
variation between most favourable and least
favourable conditions at airports, with
demand levels near visual airport capacity
and self-controlled by airlines.
• The way imbalances between capacity and
demand are managed along the trajectory of
a flight has an impact on airspace users
(predictability, fuel burn), the utilisation of
capacity (en-route, airport), and the
environment (additional CO2 emissions).
• Both systems try to optimize the use of
available capacity in a safe and efficient
manner.
• The comparison of performance based on a
set of harmonised indicators provides
insights for a more holistic assessment of
ATM in both regions, including the
identification of future research areas.
TRAFFIC
• In terms of controlled traffic, there was a
notable decoupling between the U.S. and
Europe as of 2003.
• While traffic continued to increase in Europe,
the U.S. experienced a decline until 2016,
after which traffic began to rise again until the
onset of the pandemic in March 2020.
• Between 2003 and 2019, traffic in Europe
grew by +31% (+2.5 million flights) while
flights in the U.S. CONUS area decreased
by -7% (-1.2 million flights) during the same
period.
• In 2003, the U.S. managed more than twice
the traffic of Europe. However, by 2019, this
margin had diminished to approximately 50%
more flights in the U.S.
• Following the outbreak of the COVID-19
pandemic in the first quarter of 2020, traffic
on both sides of the Atlantic dropped
dramatically. Compared to 2019, traffic in the
U.S. decreased in 2020 by -33% with Europe
showing an even higher drop of -56% vs 2019.
• After passing the low point in April 2020,
traffic in the U.S. increased continuously
whereas in Europe traffic remained at a low
level until summer 2021 when it began to
recover again. In 2022, traffic in the U.S. was
still -6.7% below 2019 levels while in Europe
traffic remained -16.9% below 2019 levels.
• The notable difference in the initial traffic
reduction and in the recovery paths can be
attributed primarily to the predominantly
domestic traffic in the U.S. (80% of flights),
which rebounded more quickly than the
largely intra-European traffic which was
subject to a multitude of national travel
restrictions.
Average daily IFR flights (2022)
Avg. per day change vs 2019
40,514
23,758
US (CONUS)
Europe
-6.7%
-16.9%

iii EXECUTIVE SUMMARY
U.S. – Europe Comparison of ANS performance (Edition 2023)
PUNCTUALITY
• “Punctuality” is a widely used industry
standard to measure the service quality of air
transport. It is expressed as the percentage of
flights arriving (or departing) within 15
minutes of their published schedule time.
• In 2019, 80.1% of flights in the U.S. arrived
within 15 minutes of their scheduled time,
compared to 76.5% in Europe.
• As the pandemic began in early 2020, both
systems experienced an uptick in punctuality
due to the decrease in traffic. In 2020, nearly
90% of flights at U.S. airports arrived at their
destinations within 15 minutes of their
scheduled time, compared to 87% in Europe.
• As traffic began to rebound, punctuality
levels began to deteriorate again on both
sides of the Atlantic. In the U.S., arrival
punctuality consistently worsened from 2020
through mid-2023, falling below the levels
observed in 2019. Meanwhile, in Europe,
arrival punctuality initially experienced a
moderate decline in 2021 but then reached its
all-time lowest point in the summer of 2022.
• Despite European traffic levels remaining
notably below those of 2019, it became
evident that several service providers were ill-
prepared to scale up their operations to meet
the rapidly increasing demand. The subpar
performance in Europe did not stem from a
single area (such as airports, airlines, or air
traffic control) but rather resulted from
deficiencies across multiple actors, primarily
associated with staff shortages.
• While punctuality provides valuable first
insights, the involvement of many different
stakeholders and the inclusion of time buffers
in airline schedules limit the analysis from an
air traffic management point of view.
OPERATIONAL ANS PERFORMANCE
• The analysis of ATM-related operational
performance aims to better understand and
quantify constraints imposed on airspace
users through the application of air traffic
flow measures and therefore focuses more
on the efficiency of operations by phase of
flight, compared to an (unconstrained)
theoretical optimum.
• It is worth noting that a certain level of flight
inefficiency is necessary or even desirable
for a system to be run efficiently without
underutilization of available resources
(capacity efficiency).
• Hence, the theoretical optimum cannot be
achieved at system level when operational
trade-offs, environmental or political
restrictions, or other performance affecting
factors such as weather conditions are
considered.
• The goal should be to minimize overall
direct (fuel, etc.) and strategic (schedule
buffer, etc.) costs and the impact on
environment whilst maximizing the
utilization of available capacity.
ANS-RELATED DEPARTURE RESTRICTIONS
(ATFM/EDCT DELAYS)
• Both the U.S. and Europe report ATM-
related delay imposed on departing flights
at the gate (ATFM/EDCT delays).
• In 2022 both regions show an improvement
compared to 2019. However, the
ATFM/EDCT delay per flight in Europe was
more than twice as high as in the U.S., with
fundamental differences in underlying
drivers and the constraining locations.
• It is worth pointing out that 2018 and 2019
were particularly bad years with
Arrival punctuality - flights to/from main 34 airports (2022)
% of arrivals delayed by less than 15 minutes
Arrival punctuality (%) change vs 2019
(percentage points)
78.5%
70.9%
US
(CONUS)
Europe
-1.6%
-5.6%
ATFM/EDCT delay per flight (2022)
flights to/from main 34 airports within region
Only delays >= 15 mins are included
Avg. min per flight change vs 2019
1.0
2.2
US (CONUS)
Europe
-1.0
-0.2

iv EXECUTIVE SUMMARY
U.S. – Europe Comparison of ANS performance (Edition 2023)
exceptionally high ATFM delays in Europe
after a continuous degradation of
performance since 2013, mainly because of
growing en-route capacity constraints.
• In the U.S. most ATFM/EDCT delays in 2022
were due to airports (66%) while in Europe
most delays (75%) were attributed to en-
route facilities.
• By far the main reason for delays in the U.S.
in 2022 was adverse weather (76%) with a
high share originating from airports.
• In Europe, the main causes in 2022 were
ATC capacity/staffing related constraints
(44%), followed by adverse weather (29%)
and “Other” reasons (mainly due to ATC
system upgrades and the war in Ukraine).
TAXI-OUT EFFICIENCY
• Following the COVID-19 related traffic
reduction, additional taxi-out time in the
U.S. initially showed a substantial reduction
but increased again in line with the traffic
recovery and ultimately reached a level
comparable to the pre-pandemic period.
• In Europe, a similar trend was observed.
However, in line with the slower traffic
recovery, average additional taxi out time
remained low until 2022 when it started to
increase again to almost reach pre-
pandemic levels.
• In 2022, taxi-out efficiency was still better
than in 2019 on both sides of the Atlantic.
• Nonetheless, average additional taxi-out
time in the U.S. is roughly twice the
additional taxi-out time in Europe. This
disparity primarily arises from differences in
flow control policies, with the U.S. adopting
a more tactical approach, and the absence
of scheduling caps at most U.S. airports.
HORIZONTAL EN-ROUTE FLIGHT EFFICIENCY
• Overall, the level of horizontal en-route
flight inefficiency in both regions was at
similar levels in 2022 with a slightly better
performance in the U.S.
• The significant decrease in traffic following
the COVID-19 outbreak briefly led to a
temporary improvement of horizontal en-
route flight efficiency in both Europe and
the U.S. Nevertheless, as traffic began to
recover, flight efficiency deteriorated again,
returning to pre-pandemic levels on both
sides of the Atlantic.
• Between 2019 and 2022, horizontal en-
route flight inefficiency in the U.S. slightly
reduced, while it increased in Europe during
the same period, partly because of the
impact of the war in Ukraine.
FLIGHT EFFICIENCY WITHIN THE LAST 100NM
• Prior to the pandemic, Europe had a
significantly higher average additional time
within the last 100 nautical miles, which was
notably influenced by London Heathrow as
a distinct outlier.
• With traffic levels in Europe still notably
lower in 2022, the level of inefficiency due to
airborne holding and metering was similar in
both regions.
• Compared to 2019, both the U.S. and
Europe show an improved performance in
2022, albeit at lower traffic levels at most
airports.
Additional taxi out time (2022)
departures from the main 34 airports
Avg. min per departure change vs 2019
6.3
2.9
US (CONUS)
Europe
-0.8
-0.8
Horizontal en-route flight inefficiency (2022)
flights to and from the main 34 airports
route extension (%) change vs 2019
(percentage points)
3.0%
3.3%
US (CONUS)
Europe
-0.11%
0.15%
Additional time within the last 100 NM (2022)
arrivals at the main 34 airports
Avg. min per arrival change vs 2019
2.22
2.35
US (CONUS)
Europe
-0.3
-0.8

v EXECUTIVE SUMMARY
U.S. – Europe Comparison of ANS performance (Edition 2023)
ANS-RELATED PERFORMANCE – Overview
• As there are many trade-offs between flight
phases, the aggregation of the results
enables a high-level comparison of the
theoretical maximum “benefit pool”
actionable by ATM in both systems.
• It is important to emphasize that the
"benefit pool" is based on a theoretical
optimum which, due to inherent necessary
(safety) or desired (capacity) limitations, is
not achievable at system level.
• Overall, the relative distribution of the ATM-
related inefficiencies associated with the
different phases of flight is consistent with
the differences in flow management
strategies described throughout the report.
• In Europe ATM-related departure delays
(ATFM/EDCT) at the gate are much more
frequently used than in the U.S., which leads
to a higher average delay and a higher share
of traffic affected. Consequently, flights in
Europe are 5 times more likely to be held at
the gate than in the U.S. because of en-
route capacity constraints.
• In the U.S. the additional taxi-out time is
twice as high as in Europe, mainly because
of the more tactical focus to maximise
throughput under prevailing conditions on
the day of operations.
• Overall, the total benefit pool in 2022 was
higher in the U.S. than in Europe, but with
traffic levels in the U.S. notably closer to
pre-pandemic levels.
• To get a more complete picture of ANS
performance in each region, there is a need
to also consider capacity utilization
together with the observed “benefit pool”.
ANS COST-EFFICIENCY
• Between 2011 and 2019 traffic grew
considerably in both the SES States
(+19.3%) and in the U.S. (+8.7%); even so,
the U.S. still controlled 84% more flight-
hours than SES States in 2019. In the
meantime, the ATM/CNS provision costs for
the ANSPs in the SES States increased
slightly (+2.1%), while the U.S. FAA-ATO
reduced its cost-base by -11.2% primarily
reflecting a decrease in total support costs,
partly due to a change in accounting
methodology. Consequently, the ATM/CNS
provision costs per flight-hour reduced
considerably for both the SES States
(-14.4%) and the U.S. (-18.4%) over this
period.
• Cost-efficiency metrics in both the SES
States and the U.S. were significantly
impacted by the sharp decline in flight hours
controlled brought about by the
implementation of stringent travel
restrictions aimed at mitigating the spread
of COVID-19.
• The influence of the COVID-19 pandemic on
the total number of IFR flight-hours logged
in 2021 had a notably more pronounced
effect on the SES States, where there was a
decrease of -44.6% compared to 2019, as
opposed to the U.S., which saw a decrease
of -19.9% compared to 2019.
• Both the SES States and the U.S.
implemented cost-containment measures
reducing the ATM/CNS provision costs
between 2019 and 2021 by -7.0% and -1.8%
respectively.
• The total ATM/CNS provision costs per
flight-hour experienced a significant rise on
both sides of the Atlantic after the onset of
the COVID-19 pandemic in 2020. However,
in the U.S., the increase was notably less
pronounced than in the SES States, with a
difference of +22.6% compared to +67.9%,
respectively. This contrast can be mainly
Theoretical maximum benefit pool actionable by ATM (2022)
Avg. min change vs 2019 Avg. min change vs 2019
1.0
6.3
2.3
2.2
11.8
ATFM/EDCT delay
per flight
Add. taxi out time
per departure
Horizonal en-route
flight inefficiency
Terminal area
inefficiency
Benefit pool
-1.0
-0.8
-0.1
-0.3
-2.2
2.2
2.9
2.5
2.4
10.0
-0.2
-0.8
0.1
-0.8
-1.6
U.S. (CONUS)
Europe

vi EXECUTIVE SUMMARY
U.S. – Europe Comparison of ANS performance (Edition 2023)
attributed to the considerably smaller
reduction in traffic in the U.S.
• In 2021, the total ATM/CNS provision costs
in the U.S. were 47% higher than those in
the SES States, but it's important to note
that the U.S. also managed more than
double the number of IFR flight-hours
compared to the SES States. This was
achieved with approximately 10.2% fewer
ATCOs in OPS (FTE) than in the SES States,
who worked, on average, longer than their
European counterparts.
• As a result, the average U.S. ATCO was
some 1.5 times more productive (in terms of
IFR flight-hours controlled per ATCO-hour
on duty) than the controllers in the SES
States.
EMERGING THEMES
• The findings in this report continue to
demonstrate that it is practical to examine
two different aviation systems and develop
key performance indicators using
harmonized procedures.
• This common approach allows both groups
to examine the essential questions on the
extent performance differences are driven
by policy, ATM operating strategies, or
prevailing organisational, meteorological
and/or economic conditions.
• Given the key elements affecting
performance in the two systems, further
work in the following areas could provide
useful insights for performance
improvement in both systems.
ANS OPERATIONAL PERFORMANCE
• Magnitude and Effect of Traffic Flow
Initiatives: More work is needed to
determine how to minimize the impact of
flow measures on airspace users and the
environment in each flight phase while
maximizing the use of scarce airport and en-
route capacity.
• Quantify capacity utilization: A better
understanding of tactical capacities at
airports but also in en-route centres would
strengthen the comparison and enable a
more complete assessment of flow
management together with capacity
utilization.
• Factors affecting en-route flight efficiency:
Future reports could provide some initial
evaluations of those factors impacting en-
route flight efficiency in each region (trade-
offs, special use airspace, TMA entry points,
weather impact, etc.).
• Vertical flight efficiency: More work is
required to improve the assessment of
vertical flight efficiency that can be
attributed to ATM in the comparison report,
and to develop commonly agreed indicators
for the measurement of those inefficiencies.
ANS COST-EFFICIENCY
• Improve staffing comparisons: Get a deeper
understanding of the role of the FAA
“developmental” and Certified Professional
Controllers In-Training (CPC-ITs) vs. a
European equivalent may be necessary to
advance other measures, such as cost based
or productivity measures. Furthermore, a
better understanding of working
arrangements in each region (rostering
practices, contractual working hours,
overtime, leave, training) would be
beneficial in future comparison reports.
• Support cost analysis: In view of the large
share in the total ATM/CNS costs (70%+), it
would be useful to better understand the
main support cost drivers in the U.S. and in
Europe, including a better understanding of
the treatment of facilities and equipment as
part of the total operating costs in each
region to ensure an accurate comparison in
this cost category.

U.S. – Europe Comparison of ANS performance (Edition 2023)
CONTENTS
Executive Summary
1 Introduction & Context .............................................................................................. 1
1.1 Report scope....................................................................................................... 2
1.2 Organisation of ATM in the U.S. and in Europe ............................................... 3
2 Traffic characteristics in the U.S. and in Europe ...................................................... 8
2.1 Air traffic evolution in the U.S. and in Europe ................................................. 8
2.2 Air traffic density .............................................................................................. 10
2.3 Seasonal variability .......................................................................................... 11
2.4 Aircraft mix ....................................................................................................... 12
2.5 Operations at the main 34 airports ................................................................ 13
3 Comparison of operational ANS performance ....................................................... 14
3.1 Introduction and background.......................................................................... 14
3.2 Approach........................................................................................................... 14
3.3 On-time performance (OTP) ............................................................................ 15
3.4 ANS- related operational performance .......................................................... 17
3.5 Conclusions - operational ANS performance ................................................. 28
4 Comparison of ANS cost-efficiency trends (2011-21)............................................ 31
4.1 Introduction and background.......................................................................... 31
4.2 Scope, methodology and influencing factors ................................................. 32
4.3 Long-term overview ......................................................................................... 36
4.4 Comparison of ANS cost-efficiency & Productivity ........................................ 38
4.5 Conclusions - ANS cost-efficiency comparison .............................................. 45
5 Emerging themes for future research .................................................................... 49
6 References ................................................................................................................ 51
ANNEX 1 – Operational data sources .............................................................................. 53
ANNEX 2 – Operations at the main 34 airports .............................................................. 55
Operations at the main 34 airports in the U.S. .......................................................... 55
Operations at the main 34 airports in Europe............................................................ 56
ANNEX 3 – European ANSPs included in the comparison .............................................. 57
ANNEX 4 – Methodology - economic comparison ......................................................... 58
6.1 Definitions of key data ..................................................................................... 58
6.2 Inflation, exchange rates and ppp data .......................................................... 58
ANNEX 5 – Summary of key cost-efficiency data............................................................ 59

1 INTRODUCTION & CONTEXT
U.S. – Europe Comparison of ANS performance (Edition 2023)
1 Introduction & Context
This report is the eighth in a series of joint comparisons between the U.S. and Europe [1] [2]. It
represents the fifth edition under the Memorandum of Cooperation (NAT-I-9406A) between the
United States and the European Union (EU). The work is managed by the joint Performance Analysis
Review Committee (PARC) under the Memorandum.
Building on commonly agreed metrics from the previous operational [1] and cost-efficiency [2]
comparison reports, the objective of the joint work conducted by the U.S. Air Traffic Organization
(FAA-ATO)
1
and EUROCONTROL on behalf of the PARC is to compare, understand, and further
improve air traffic management (ATM) performance in both systems.
The outbreak of the COVID-19 pandemic in early 2020 resulted in an unprecedented reduction of air
traffic around the globe - with significant effects on the entire aviation industry. Air Navigation
Services (ANS) had to adjust operationally and economically as quickly as possible to the reduced
demand, whilst ensuring a safe and reliable service to those flights still operating. A first evaluation of
the economic and operational impact of the COVID-19 outbreak on the two ATM systems in the U.S.
and in Europe was provided in a special report in December 2021 [3].
As shown in this special report in 2021, the impact of the pandemic on air traffic was notably different
in the U.S. and in Europe due to differences in market composition. The analysis showed that
international traffic was much more affected because of the various measures implemented by
governments to fight the pandemic. Hence, the impact on air traffic in the U.S. was notably lower
because of the large domestic market share (80%) in comparison to Europe (30%).
The recovery phase also showed different patterns. While in the U.S. traffic recovered continuously
after the outbreak of the pandemic in March 2020, in Europe recovery was generally slower but with
notably high growth rates in summer.
This report looks at the operational and economic ATM performance in both systems since the
outbreak of the pandemic in 2020. Where appropriate, it also follows up on longer term trends and
differences in ATM performance between the U.S. and Europe identified in previous reports.
Russia’s invasion of Ukraine in February 2022 and the unfolding effects of the war also influenced the
analyses in this report.
The closure of Ukraine’s airspace to commercial traffic was amplified by reciprocal airspace bans for
Russian and many Western operators. This resulted in a cut of many important east-west airways
between Europe and Asia for many Western carriers.
While most of the European traffic is not directly affected
by the airspace closures, flights originating in Europe or
Eastern Asia that previously travelled through Russian
airspace need to divert, which adds travel time and fuel
burn and in turn lowers flight efficiency. Additionally,
there is a direct operational and economic impact on the
adjacent Air Navigation Service Providers (ANSPs).
To allow for consistency in time series analyses, Ukraine
was removed from the scope of the analyses in this report.
1
The U.S. Air Traffic Organization (ATO) is the operational arm of the FAA, which applies business-like practices to
the delivery of air traffic services.
Figure 1-1: Impact of Ukraine war on air traffic

INTRODUCTION & CONTEXT 2
U.S. – Europe Comparison of ANS performance (Edition 2023)
1.1 REPORT SCOPE
To ensure the comparability of ATM performance, the analysis scope in this report was influenced by
the need to identify a common set of data sources with a sufficient level of detail and coverage (see
Annex I for more information on data sources).
GEOGRAPHICAL SCOPE
Unless otherwise indicated, “U.S.” refers to ANS provided by the United States of America in the 48
contiguous States located on the North American continent south of the border with Canada plus the
District of Columbia, but excluding Alaska, Hawaii and Oceanic areas (U.S. CONUS).
Unless stated otherwise, for the purpose of this report, “Europe” is defined as the geographical area
where ANS are provided by the EU Member States plus those States outside the EU that are members
of EUROCONTROL, excluding Oceanic areas, Georgia, the Canary Islands and Ukraine
2
.
The overview of the traffic characteristics in the U.S. and in Europe in Chapter 2 includes all airports
and all IFR traffic. The more detailed operational analyses of ATM-related operational performance
by phase of flight in Chapter 3 are limited to flights to or from the main 34 airports for IFR traffic in
both the U.S. and in Europe
3
. A list of the airports included in this report can be found in Annex II.
Figure 1-2: Geographical scope of the comparison in the report (2023)
In the economic comparison in Chapter 4, “Europe” corresponds to the 36 ANSPs
4
included in the ATM
cost-effectiveness (ACE) benchmarking exercise (see Annex III for the full list of ANSPs).
The “U.S.” refers to the 48 contiguous States located on the North American continent south of the
border with Canada (U.S. CONUS) plus activity for Alaska, Hawaii, Puerto Rico, and Guam.
TEMPORAL SCOPE
The analyses in this report focus mainly on the period between 2018-2022 to contrast the
performance of 2022 versus the performance before the pandemic and during the recovery phase.
Where useful, comparisons over longer time periods are provided to track trends over time already
highlighted in previous reports.
2
Different from previous years, Ukraine was excluded from this report following Russia’s invasion in February 2022
and the subsequent closure of airspace to commercial traffic.
3
Although they are within the main 34 airports in terms of traffic in Europe, Istanbul (SAW), Antalya (AYT) and
Manchester (MAN) airports were not included in the analysis due to data availability issues.
4
While the latest ACE Benchmarking report [9] includes 38 ANSPs, Sakaeronavigacija, the Georgian ANSP, and
BHANSA, the ANSP of Bosnia and Herzegovina, only started to provide data for the years 2015 and 2019
respectively and are therefore excluded from the analysis presented in this report.
20 U.S. CONUS Air Route Traffic Control Centers (ARTCCs)
vs. 58 European Area Control Centres (ACCs)
34 Airports tracked
for each region

3 INTRODUCTION & CONTEXT
U.S. – Europe Comparison of ANS performance (Edition 2023)
1.2 ORGANISATION OF ATM IN THE U.S. AND IN EUROPE
For the interpretation of the results in this report, it is useful to start with a high-level summary of the
organisation of ATM in the U.S. and in Europe.
The key difference between both regions is that the European ATM system is composed of many
individual Air Navigation Service Providers (ANSP) with different working arrangements and cost
structures whereas the U.S. system is operated by a single ANSP using the same tools and equipment,
communication processes and a common set of rules and procedures.
Both the U.S. and Europe have established system-wide, centralized traffic management facilities
(the ATCSCC
5
and the NM
6
respectively) to manage the ATFM processes at strategic, pre-tactical and
tactical level and to ensure that traffic flows do not exceed what can be safely handled by Air Traffic
Control (ATC) units while trying to optimize the use of available capacity. The delivery of ATC capacity
and the fine-tuning of traffic flows is the responsibility of en-route, terminal and airport ATC facilities.
As far as traffic management issues are concerned, there is a clear hierarchy in the U.S. Terminal
Radar Approach Control (TRACON) units’ work through the overlying ARTCC which coordinate
directly with the ATCSCC in Virginia. The ATCSCC has final approval authority for all national Traffic
Management Initiatives (TMIs) in the U.S. and is also responsible for resolving inter-facility issues.
This puts the ATCSCC in a much stronger position with more active involvement of tactically
managing traffic on the day of operations than is the case in Europe.
In Europe, although Air Traffic Flow Management (ATFM) and Airspace Management (ASM) are
coordinated centrally by the NM, at the ATC level the European system is more fragmented, and the
provision of ANS is still largely organized by State boundaries.
The NM monitors the traffic situation and proposes flow measures which are coordinated through a
Collaborative Decision Making (CDM) process with the local authority. Usually the local Flow
Management Positions (FMP), embedded in Area Control Centers (ACCs) to coordinate the air traffic
flow management, requests the NM to implement flow measures.
The Single European Sky (SES) initiative of the European Union (EU) aims at reducing the effects of
fragmentation. It provides the framework for the creation of additional capacity and for improved
efficiency and interoperability of the ATM system in Europe. The second legislative package, adopted
in 2009, foresees, inter alia, for the European NM a more proactive role in ATFM, ATC capacity
enhancement, airspace structure development and the support to the deployment of technological
improvements across the ATM network. Additionally, it made legal provision for an EU wide
performance scheme for ANS starting in 2012. The European Commission subsequently made a new
reform proposal SES2+ to further improve and advance the Single European Sky. This legislative
proposal is currently negotiated between the co-legislators (European parliament and council).
The SES performance scheme places focus on planning and accountability for performance, binding
target setting (Safety, Cost-Efficiency, Capacity and Environment), monitoring, incentives and
corrective actions at both European and national levels. It is coupled with a charging regime replacing
“full cost recovery” by a system of “determined costs” and risk sharing set at the same time as
performance targets [4].
Part of the SES initiative also includes the modernisation of the European system as part of the SESAR
programme. This comprises research and development of novel operational concepts and technical
enablers. The programme received funding from the European Union and is implemented through
Common Projects.
5
Air Traffic Control System Command Center (ATCSCC) in Warrenton, Virginia.
6
Network Manager (NM) in Brussels, Belgium.

INTRODUCTION & CONTEXT 4
U.S. – Europe Comparison of ANS performance (Edition 2023)
Table 1-1 provides a high-level overview of ATM key system figures in the U.S. and in Europe. While
the total surface of airspace analyzed in this report is similar for Europe and the U.S., the number of
physical ATC facilities differs notably in both ANS systems.
The U.S. has one ANSP and the U.S. CONUS is served by 20 Air Route Traffic Control Centers (ARTCC)
supplemented by 26 stand-alone TRACONs providing services to multiple airports (total: 46 facilities).
In addition, the U.S. has 134 Approach Control Facilities combined with Tower services.
The ATM system in Europe is more fragmented and operates with more physical facilities than the
U.S. The European region comprises 36 ANSPs (and a similar number of different regulators), 58 Area
Control Centers (ACC)
7
and 19 stand-alone Approach Control (APP) units (total: 77 facilities).
However, the U.S. controls notably more flights operating under Instrument Flight Rules (IFR) with
fewer Air Traffic Controllers (ATCOs) and fewer en-route and terminal facilities (total: 46 facilities).
Year 2021/22
U.S.
8
Europe
9
U.S. vs. Europe
Geographic Area (million km
2
)
10.4
10.6
Controlled flights 2022 (IFR) (million)
14.8
8.7
≈ +70%
Share of General Aviation (IFR flights)
19%
4.4%
Nr. of civil en-route Air Navigation Service Providers
1
36
Number of en-route facilities
20
10
58
Number of stand-alone APP/TRACON units
26
11
19
Number of APP units collocated with en-route or TWR fac.
134
250
Number of airports with ATC services
517
12
374
Of which are slot controlled
3
13
> 100
14
Number of Air Traffic Controllers (ATCOs in OPS), in FTEs (2021)
11 784
15
16 552
≈ -29%
Number of OJT/developmental ATCOs, in FTEs (2021)
2 260
1 079
Total ATCOs in OPS plus OJT/developmental, in FTEs (2021)
14 430
17 631
≈ -18%
Total staff, in FTEs (2021)
31 681
50 945
≈ -38%
Table 1-1: U.S. –Europe ATM key system figures at a glance (2021/22)
Using the definition employed by the ACE and CANSO benchmarking reports which excludes those
designated as “on-the-job training” in Europe or as a “developmental” at the FAA, the U.S. operated
with some 29% less full-time ATCOs than Europe in 2021. However, the gap narrows notably when
developmental and Certified Professional Controllers in Training (CPC-ITs) on the U.S. side and On-
the-Job trainees in Europe are also considered.
A further difference between the U.S. and Europe is the share of general aviation traffic which
accounts for 19% and 4.4% of total traffic respectively.
7
For Europe, a 59
th
en-route centre is located in the Canaries, outside of the geographical scope of the study. In the
U.S., 3 additional en-route centres are operated by the FAA, outside of the U.S. CONUS.
8
Area refers to CONUS only. Centre count and staff numbers refer to the NAS excluding Oceanic.
9
Area, staff and facility numbers refer to EUROCONTROL States, excluding Georgia, Ukraine, Canary Islands and
Oceanic areas. European staff and facility numbers refer to 2021 which is the latest year available.
10
20 en-route centers (ARTCCs) are in the U.S. CONUS, 3 are outside.
11
26 stand-alone TRACONs are in the U.S. CONUS, 1 is outside (Alaska).
12
Total of 514 facilities of which 264 are FAA staffed and 250 federal contract towers. European airports as included
in the ACE benchmarking report.
13
IATA Level 3: JFK. In addition, restrictions exist at DCA and LGA based on Federal and local rules. IATA Level 2:
ORD, LAX, EWR, SFO. IATA Level 2 for international terminals only: MCO, SEA
14
IATA Level 2: ±70. IATA Level 3: ±100.
15
This value reflects the CANSO reporting definition of a fully trained ATCO in OPS and includes supervisors. It is
different than the total controller count from the FAA Controller Workforce Plan which does not include
supervisors. The number of ATCOs in OPS does not include 1 400 controllers reported for contract towers. The
number of ATCOs in OPS including Oceanic is 11 958.

5 INTRODUCTION & CONTEXT
U.S. – Europe Comparison of ANS performance (Edition 2023)
To improve comparability, the analysis of operational ANS performance in Chapter 3 is limited to IFR
flights either originating from or arriving to the main 34 airports in each region. Notwithstanding the
large number of airports in each region, only a relatively small number of airports account for the main
share of traffic. The main 34 airports account for approximately 68% and 65% of the controlled flights
in Europe and the U.S., respectively. The traffic mix of this sample is more comparable as this removes
a large share of the smaller piston and turboprop aircraft (see also analysis in Figure 2-6 on page 12).
A further significant difference worth pointing out is the low number of airports with schedule or slot
limitations in the U.S. compared to Europe, where most of the airports are slot-coordinated.
1.2.1 FLOW MANAGEMENT TECHNIQUES
To minimize the effects of ATM-related constraints, the U.S. and Europe use a comparable
methodology to balance demand and capacity
16
. This is accomplished through the application of an
“ATFM planning and management” process, which is a collaborative, interactive capacity and airspace
planning process, where airport operators, ANSPs, Airspace Users (AUs), military authorities, and
other stakeholders work together to improve the performance of the ATM system.
This CDM process allows AUs to optimize their participation in the ATM system while mitigating the
impact of constraints on airspace and airport capacity. It also allows for the full realization of the
benefits of improved integration of airspace design, airspace management and air traffic flow
management (ATFM). The process contains several equally important phases: ATM planning, ATFM
execution (strategic, pre-tactical, tactical) including the fine tuning of traffic flows by ATC through
Traffic Management Initiatives (TMIs).
Figure 1-3 provides an overview of the key players involved and the most common ATFM techniques.
The two ATFM systems differ notably in the timing (when) and the phase of flight (where) ATFM
measures are applied.
In Europe, a lot of emphasis is put on strategic planning and a large part of the demand/capacity
management measures are applied months in advance. Traffic at major airports is usually regulated
(in terms of volume and concentration) in the strategic phase through the airport capacity declaration
16
In line with the guidance in ICAO Doc 9971 (Manual on Collaborative Air Traffic Flow Management).
Figure 1-3: Organization of ATFM (Overview)
Tactical
DEP. RESTRICTIONS
(GROUND HOLDING)
ROUTING,
SEQUENCING, SPEED
CONTROL, HOLDING
AIRBORNE HOLDING
(CIRCULAR, LINEAR),
VECTORING
EN ROUTE
ORIGIN
AIRPORT
DESTINATION
AIRPORT
AIRPORT SCHEDULING
(DEPARTURE SLOT)
STRATEGIC
AIRPORT SCHEDULING
(ARRIVAL SLOT)
STRATEGIC
TAKE-OFF
APPROACH
Tower
control
En route
Area control
Terminal
control
LOCAL ATC
UNITS
LANDING
TAXI-IN
TAXI-OUT
Ground
control
ATFM
MEASURES
FLIGHT
PHASE
Tower
Ground
US (CONUS)
EUROPE
Air Route Traffic
Control Center
(ARTCC):
20
Area Control
Centre
(ACC):
58
Terminal Radar
Approach Control
(TRACONs):
Stand-alone: 26
Collocated: 134
Approach Control
units
(APPs):
Stand-alone: 16
Collocated: 263
Airports with
ATC services
NETWORK (ATFM)
US
EUROPE
Air traffic
Control
System
Command
Center
(ATCSCC)
located in
Warrenton,
Virginia.
Eurocontrol
Network
Operations
Centre
(NMOC),
located in
Brussels,
Belgium
(formerly -
CFMU).

INTRODUCTION & CONTEXT 6
U.S. – Europe Comparison of ANS performance (Edition 2023)
process, and the subsequent allocation of airport landing and departure slots to aircraft operators
months before the actual day of operation. Airports are usually designated as ‘coordinated’ when the
airport capacity is insufficient to fulfil airlines’ demand during peak hours. The subsequent airport
scheduling process aims at matching airline demand with airport capacity several months before the
actual day of operations to avoid frequent and significant excess of demand on the day of operations.
The declared airport capacity takes account of airport infrastructure limitations and environmental
constraints and is decided by the coordination committee and/or by the respective States themselves.
It represents an agreed compromise between the maximization of airport infrastructure utilization
and the quality of service considered as locally acceptable.
In addition, demand in Europe is managed in pre-tactical phases (allocation of ATFM take-off slots).
The European system operates airport streaming on a local and distributed basis with the NM mainly
protecting the en-route segments from overload.
In the U.S., the emphasis is on the tactical traffic management in the gate-to-gate phase to maximize
system and airport throughput under prevailing conditions on the day of operations. Very few airports
in the U.S. have schedule limitations. The operations are based on real time capacity forecasts
provided by local ATC. Demand levels are self‐controlled by airlines and adapted depending on the
expected cost of delays and the expected value of operating additional flights. The few schedule
constrained airports in the U.S. are typically served by a wide range of (international) carriers and are
in high density areas at the U.S. East and West coast.
With more emphasis on the tactical phase, the U.S. system appears to be more geared towards
maximizing airport throughput according to the available capacity on the day of operations. The
approach is supported by the en-route function and less en-route capacity constraints than in Europe.
This enables to absorb path stretching in the en-route airspace and to achieve the metering required
by TMAs and airports.
The comparison of operational performance has the potential to provide interesting insights from a
fuel efficiency point of view as Europe applies more delay at the gate. However, as both systems try
to optimize the use of available capacity, this needs to be put in context for a more complete picture.
Departure restrictions (ground holdings): In the U.S., Ground Delay Programs (GDP) or Airspace Flow
Programs (AFP) are mostly used in case of severe capacity restrictions at airports or en-route when
less constraining measures, such as Time-Based Metering or Miles in Trail (MIT) are not sufficient. The
Air Traffic Command Center (ATCSCC) applies Estimated Departure Clearance Times (EDCT) to delay
flights prior to departure. Aircraft must depart within +/‐ 5 minutes of their EDCT to be in compliance
with the GDP. Most of these delays are taken at the gate. A ground stop (GS) is an extreme measure
in air traffic management where arrivals to a specific airport are temporarily postponed. The number
of departure airports included in the scope of the ground stop can vary based on the severity of the
event and international flights are excluded from these programs.
In Europe when traffic demand is anticipated to exceed the available capacity in en-route ACCs or at
airports, ATC units may call for “ATFM regulations”. Aircraft subject to ATFM regulations are held at
the departure airport according to “ATFM slots” allocated by the European Network Manager. The
ATFM delay of a given flight is attributed to the most constraining ATC unit, either en-route (en-route
ATFM delay) or airport (airport ATFM delay). The NM was initially created in the 1990s to manage the
lack of en-route capacity of a fragmented ATC system. Different from the U.S., the departure window
is wider in Europe and ATFM regulated aircraft must depart within ‐5/+10 minutes of their assigned
ATFM slot to be in compliance.

7 INTRODUCTION & CONTEXT
U.S. – Europe Comparison of ANS performance (Edition 2023)
En-route flow management (airborne): In the U.S. sequencing programs are used to achieve specified
spacing between aircraft using distance (miles) or time (minutes). The most known is called miles in
trail (MIT). It describes the number of miles required between aircraft departing from or arriving to an
airport, over a fix, navaid, at an altitude, through a sector, or on a specific air route. MIT is used to
apportion traffic into a manageable flow, as well as to provide space for additional traffic (merging or
departing) to enter the flow. En-route caused restrictions are small compared to airport driven flow
restrictions in the U.S.
MIT restrictions are commonly employed in the U.S., where the responsibility for maintaining a traffic
flow at or below the restricted level can be transmitted upstream, sometimes resulting in restrictions
even at the departure airport. Consequently, MIT restrictions can ultimately impact aircraft on the
ground. When an aircraft is preparing for take-off from an airport to join a traffic flow under an active
MIT restriction, it requires specific clearance for take-off. ATC releases the aircraft only when it can
seamlessly integrate into the sequenced flow. These delays, managed by the Traffic Management
System (TMS), primarily occur during the taxi-out phase, with limited impact at the gate.
The measures have a considerable effect on the workload of ATCOs by optimizing the use of the
available spacing in terms of MIT and, where necessary, modify up‐stream constraints thus
contributing significantly to reduce the complexity of the traffic sequences. The U.S. is more and more
transitioning to Time-Based Metering (TBM) due to gained spacing efficiencies. TBM allows individual
flights to be spaced as needed as compared to spacing all flights with standard distance-based miles
in trail.
There is currently no or very limited en-route spacing or metering in Europe. When sequencing tools
and procedures are developed locally, their application generally stops at the State boundary.
Speed control can also be used to adjust transit times. Aircraft are slowed down or sped up to adjust
the time at which the aircraft arrive in a specific airspace or at an airport.
Arrival flow management (airborne): In both the U.S. and the European system, the terminal area
around a congested airport is used to absorb delay and to keep pressure on the runways to ensure the
maximum use of available capacity. Traffic management Initiatives (TMIs) generally recognize
maximizing the airport throughput as paramount.
With Time Based Metering (TBM) systems in U.S. control facilities, delay absorption in the terminal
area is focused on keeping pressure on the runways without overloading the terminal area. Combined
with MIT initiatives, delays can be propagated further upstream at more fuel-efficient altitudes, if
necessary. However, holding is more manageable at lower altitudes where aircraft can hold with a
smaller radius to their holding pattern. Altitude has different effects on the fuel burn, depending on
the airframe/engine combination. Generally speaking, the higher the hold altitude the lower the fuel
flow.

TRAFFIC CHARACTERISTICS IN THE U.S. AND IN EUROPE 8
U.S. – Europe Comparison of ANS performance (Edition 2023)
2 Traffic characteristics in the U.S. and in Europe
This section provides some key air traffic characteristics of the ATM system in the U.S. and in Europe
to provide some background information and to ensure comparability of traffic samples.
2.1 AIR TRAFFIC EVOLUTION IN THE U.S. AND IN EUROPE
Figure 2-1 shows the evolution of IFR traffic in the U.S. and in Europe between 2003 and 2022. The
U.S. CONUS airspace is slightly smaller than the European airspace, but the U.S. controlled in 2022
notably more IFR flights with considerably less en-route facilities.
Historic trend (pre-COVID-19):
In 2003, the number of IFR flights in the U.S. CONUS area was more than twice the traffic in Europe.
As of 2004, a notable decoupling in terms of traffic evolution is visible with traffic in Europe continuing
to grow while U.S. traffic started to decline to reach its lowest level in 2016, before increasing again
until the start of the COVID-19 pandemic in early 2020. The effect of the economic crisis starting in
2008 is clearly visible on both sides of the Atlantic. Overall, traffic in Europe grew by +30.9% (+2.5
million flights) between 2003 and 2019 while flights in the U.S. CONUS area declined by -7.1% (-1.2
million flights) during the same period.
Figure 2-1: Evolution of IFR traffic in the U.S. CONUS area and in Europe (yearly)
COVID-19 pandemic:
Shortly after the World Health Organization (WHO) declared COVID-19 a pandemic in mid-March
2020, air traffic dropped dramatically on both sides of the Atlantic because of the travel restrictions
imposed by many countries to fight the pandemic. Consequently, in 2020, there was a -33% reduction
in U.S. traffic compared to 2019, equivalent to some 5.3 million less flights. Meanwhile, European air
traffic experienced an even more substantial decline, with a -56% reduction in 2020 compared to
2019, resulting in 5.9 million fewer flights.
-
4
8
12
16
20
2003
2004
2005
2006
2007
2008
2009
2010
2011
2012
2013
2014
2015
2016
2017
2018
2019
2020
2021
2022
Millions
Evolution of IFR flights in the U.S. CONUS area and in Europe
US (CONUS) Europe
-7.5%
-6.6%
COVID-19
-33.3%
-56.2%
114%
higher
64%
higher
52%
higher
71%
higher
Global
financial
crisis
40
60
80
100
120
140
Index (2003)
3.2%
11.9%
2019 vs. 2011 (%)
-7.1%
30.9%
US (CONUS)
Europe
2019 vs. 2003 (%)
-6.7%
-16.9%
2022 vs. 2019 (%)

9 TRAFFIC CHARACTERISTICS IN THE U.S. AND IN EUROPE
U.S. – Europe Comparison of ANS performance (Edition 2023)
The annual figures hide to some extent the full dynamics of the COVID-19 crisis. The analysis in Figure
2-2 shows the evolution of the 7-day moving average of daily flights in the U.S. CONUS area and in
Europe between 2019 and 2023 (up to end July).
Figure 2-2: Evolution of IFR traffic in the U.S. CONUS area and in Europe (2019-2023)
A first interesting observation is the notably higher seasonal variation in Europe compared to U.S in
2019 which was not affected by the pandemic (top left in Figure 2-2). Flight counts in Europe show a
clear increase in summer (+15% vs average), mainly because of notably increased holiday traffic to
destinations in southern Europe. In the U.S., the seasonal variation is more moderate and skewed by
the high summer traffic in northern states offsetting the high winter/spring traffic in the south.
Following the shock in March 2020, the 7-day average reached its lowest point in Europe in mid-April
2020 when traffic was 91% below the level of 2019. In the U.S., the lowest point was also in mid-April
when traffic was 68% below the comparable traffic level in 2019.
After passing the low point in April 2020, traffic in the U.S. increased continuously whereas in Europe
traffic declined again after an initial surge in summer 2020 and remained at a low level until summer
2021. Despite substantial growth in the second half of 2021, traffic recovery in Europe in 2021 reached
only just above half the level of 2019. As for 2022, European traffic continued its rebound from the
impact of the COVID-19 pandemic, reaching approximately 83% of the 2019 traffic level, while in the
U.S., traffic levels in 2022 rebounded even further, achieving 93% of the 2019 levels.
As highlighted in the special report published on the impact of the COVID-19 pandemic on the U.S.
and European ANS systems [3], the notably higher traffic reduction in Europe was mainly linked to
the differences between the U.S. and Europe in terms of market composition and the timing and
severity of the measures implemented to fight the COVID-19 pandemic.
Domestic traffic was less affected than international traffic on both sides of the Atlantic. However,
the domestic market share in the U.S. is above 80% whereas in Europe domestic flights within States
only account for approximately 30% of all flights. Hence, the high share of international or cross-
border traffic in Europe affected by travel restrictions implemented by European States clearly played
a role in the higher initial traffic reduction in 2020 but was also a factor for the slower recovery rate
observed from 2020 onwards.
0
10
20
30
40
50
01-01-2019
01-04-2019
01-07-2019
01-10-2019
01-01-2020
01-04-2020
01-07-2020
01-10-2020
01-01-2021
01-04-2021
01-07-2021
01-10-2021
01-01-2022
01-04-2022
01-07-2022
01-10-2022
01-01-2023
01-04-2023
01-07-2023
Avg. daily flights
(thousands)
Europe (7 day trailing average)
U.S. CONUS (7 day trailing average)
Evolution of flights in the U.S CONUS area and in Europe
(7 day trailing average)
-91%
-68%
-100%
-80%
-60%
-40%
-20%
0%
20%
Compared to 2019
TRAFFIC CHARACTERISTICS IN THE U.S. AND IN EUROPE 10
U.S. – Europe Comparison of ANS performance (Edition 2023)
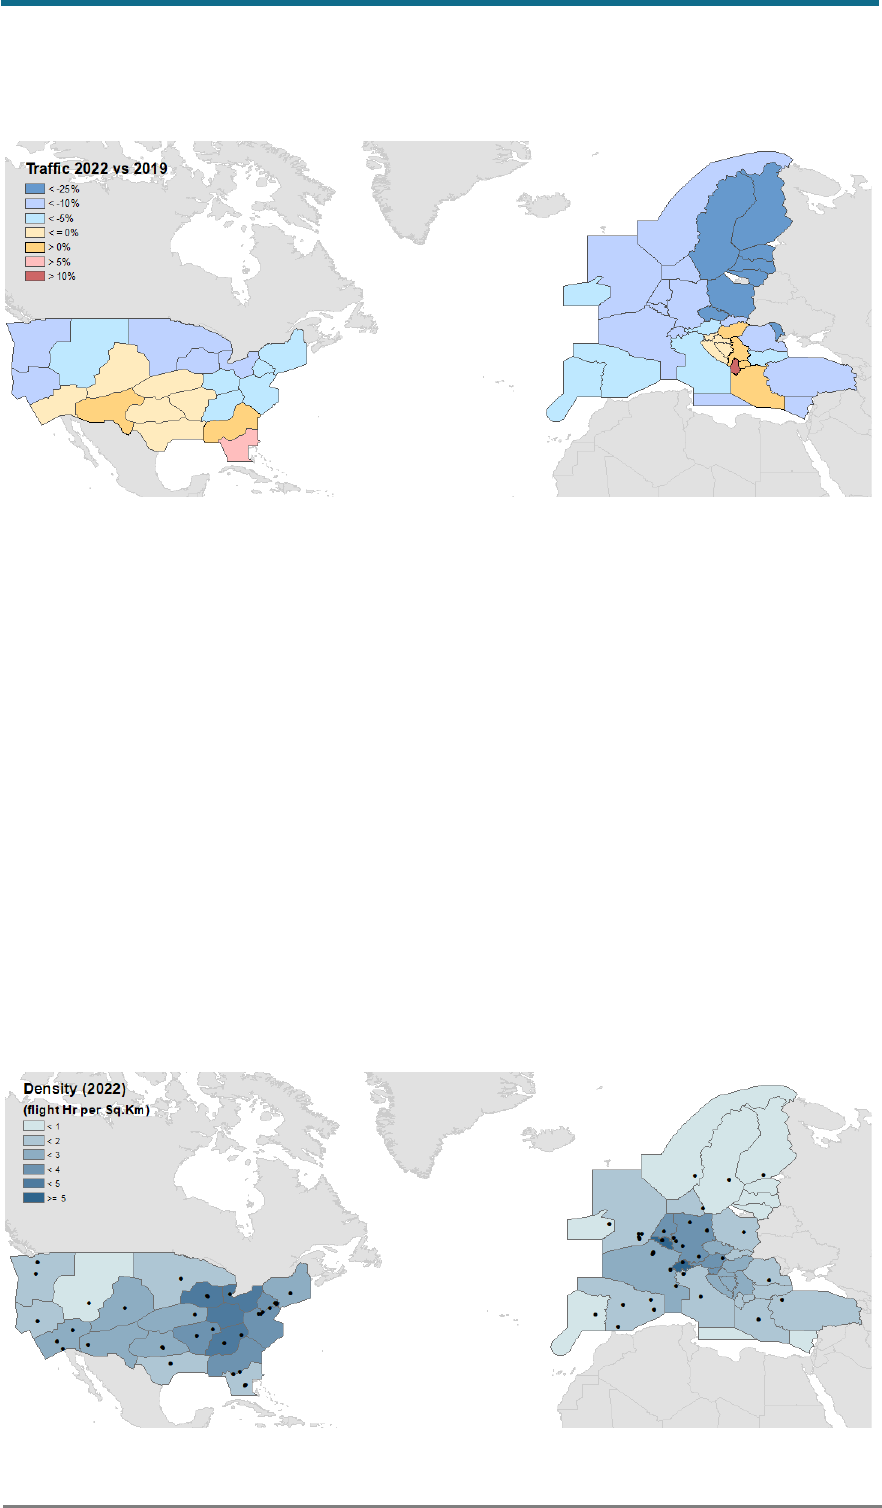
The recovery from the pandemic was not equally distributed among the network, as illustrated in the
map in Figure 2-3.
Figure 2-3: Evolution of IFR traffic in the U.S. and in Europe (2022 vs. 2019)
Europe shows a contrasted picture with wide variations between 2022 and 2019. This is partly due to
differences in COVID-19 recovery patterns but also due to changes in traffic flows because of the war
in Ukraine. Because of a substantial recovery of holiday traffic, typical holiday destinations in southern
Europe generally showed a better recovery in 2022 with some states such as Albania and Greece even
exceeding 2019 traffic levels.
The impact of the Ukraine war and the airspace closures issued by Western countries and Russia
affected traffic flows and overflights in several countries. Some Nordic States have lost substantial
traffic, whereas States south of Ukraine show higher traffic levels from flights circumnavigating
around closed airspace.
The U.S. is a more homogenous and mature market with a large share of domestic traffic which shows
a different behavior. The most noticeable shift in the U.S. is the increase in traffic over pre-pandemic
levels in the southeast. The major international airports in the northeast were slower to recover.
2.2 AIR TRAFFIC DENSITY
Figure 2-4 shows the traffic density in the U.S. and in Europe measured in annual flight-hours per
square kilometer for all altitudes in 2022. For Europe, the map is shown at Flight Information Region
(FIR) level because the display by en-route center would hide the centers in lower airspace.
Figure 2-4: Traffic density in the U.S. and in Europe (2022)

11 TRAFFIC CHARACTERISTICS IN THE U.S. AND IN EUROPE
U.S. – Europe Comparison of ANS performance (Edition 2023)
In Europe, the “core area” comprising the Benelux States, Northeast France, Germany, and
Switzerland is the densest and most complex airspace. The area includes major European hubs, and
it is also the crossing point between traffic from Northern Europe to the Southwest and traffic from
Central Europe to the West.
Similarly in the U.S., the centrally located centers of Cleveland (ZOB), Chicago (ZAU), Indianapolis
(ZID), and Atlanta (ZTL) have flight hour densities of more than twice the CONUS-wide average. The
New York Centre (ZNY) appears less dense due to the inclusion of a portion of coastal/oceanic
airspace. If this portion was excluded, ZNY would be the center with the highest density in the U.S.
In contrast to Europe where high-volume airports are concentrated in the center of the region, many
of the high-volume airports in the U.S. are located on the coasts or edges of the study region creating
a greater percentage of longer haul flights, especially when only flights within the CONUS area are
considered. The airborne trajectory on these transcontinental flights may be more affected by the
influences of wind and convective weather.
2.3 SEASONAL VARIABILITY
Seasonality and variability of air traffic demand can be a factor affecting ATM performance. If traffic
is highly variable, resources may be underutilized during off-peak times but scarce at peak times.
Figure 2-5 compares the seasonal variability (relative difference in traffic levels with respect to the
yearly averages) in the U.S. and in Europe for 2022.
Figure 2-5: Seasonal traffic variability in the U.S. and in Europe (2022)
As was the case before the pandemic, a very high level of seasonal variation in Europe is observed for
the holiday destinations in Southern Europe where a comparatively low number of flights in winter
contrast sharply with high demand in summer. Additionally, the shift of traffic flows following the
outbreak of the war in Ukraine in February 2022 contributed to the variation of traffic in certain areas
adjacent to the region.
In the U.S., the overall seasonality is skewed by the high summer traffic in northern en-route centers
(Boston, Chicago, and Minneapolis) offsetting the high winter/spring traffic of southern centers
(Miami and Jacksonville).

TRAFFIC CHARACTERISTICS IN THE U.S. AND IN EUROPE 12
U.S. – Europe Comparison of ANS performance (Edition 2023)
2.4 AIRCRAFT MIX
As shown in Table 1-1, the share of general aviation is notably higher in the U.S. and, although outside
the scope of this study, the U.S. also handles notably more Visual Flight Rules (VFR) traffic.
Figure 2-6 shows the
distribution of physical aircraft
classes for all flights and at the
main 34 airports in each region.
If all traffic is considered, the
U.S. shows a notably higher
share of smaller piston and
turboprop aircraft.
Even though the average
aircraft size is still notably
smaller in the U.S., the samples
are more comparable when only
flights to and from the 34 main
airports are considered.
The higher share of larger
aircraft in Europe is also
confirmed by the evolution of
the average number of seats per
scheduled passenger flight in
Figure 2-7. For 2022, the
average number of seats per
scheduled flight is +26% (+34
seats) higher in Europe for
traffic to or from the main 34
airports.
The noticeable variation in aircraft size between the two regions is connected to the distinct
approaches adopted by airlines, influenced by factors such as demand, market competition, and other
considerations. A growing number of European low-cost carriers opt for a high-density, one-class
seating arrangement, in contrast to the typical two-class configuration favored by U.S. carriers.
Furthermore, given the limited number of slot-restricted airports in the U.S., airlines have the
flexibility to increase service frequency by employing smaller aircraft, which helps them capture a
larger market share and cater to high-yield business travelers.
In contrast to Europe, where the average number of seats per flight consistently rose between 2008
and 2022, the United States experienced a more modest growth rate in the number of seats per
aircraft during the same period. However, this suggests the potential to accommodate more
passengers with relatively minor increases in operations. The substantial increase in average seat
numbers in the U.S. since 2013 can be primarily attributed to industry consolidation, resulting in fewer
flight frequencies but the utilization of larger aircraft. Additionally, the significant upswing in the U.S.
from 2014 to 2015 can be traced to alterations in airlines' regional fleets, which included a sharp
reduction in 45-50 seat jets in favor of larger 65-75 seat aircraft on select routes.
Figure 2-6: Comparison by physical aircraft class (2022)
0%
20%
40%
60%
80%
100%
U.S. EUR U.S. EUR
Comparison by physical aircraft class (2022)
Jet Heavy (>136t)
Jet Large (50t<>136t) +757
Jet Medium (7t<>50t)
Jet Light (<7t)
Turboprop
Piston
Other
All flights
Traffic to OR from
34 main airports
Figure 2-7: Average seats per scheduled flight (2008-2023)
102
103
106
112
114
119
121
135
99
102
105
112
114
119
121
135
90
100
110
120
130
140
150
160
170
180
2008
2010
2012
2014
2016
2018
2020
2022
Avg. seats per IFR flight
Scheduled Services (Main 34)
Scheduled Services (All)
Domestic U.S. (CONUS)
128
135
140
144
151
156
158
163
124
132
138
143
149
153
155
161
90
100
110
120
130
140
150
160
170
180
2008
2010
2012
2014
2016
2018
2020
2022
Avg. seats per IFR flight
Scheduled Services (Main 34)
Scheduled Services (All)
Intra-European

13 TRAFFIC CHARACTERISTICS IN THE U.S. AND IN EUROPE
U.S. – Europe Comparison of ANS performance (Edition 2023)
2.5 OPERATIONS AT THE MAIN 34 AIRPORTS
Figure 2-8 shows the average daily IFR departures at the main 34 airports
17
in the U.S. and in Europe.
The average number of daily IFR departures is considerably higher in the U.S., compared to Europe.
On both sides of the Atlantic, the highest decrease compared to 2019 is observed in April 2020. At the
34 main U.S. airports, departures in April 2020 were -69% lower than in April 2019. In Europe, the
decrease in April 2020 was with 91% notably higher at the main 34 airports.
As mentioned before, the notably lower decrease in the U.S. is linked to the stronger domestic market
in the U.S. which was less affected than international traffic. U.S. hubs with stronger international
traffic (e.g. Atlanta, Chicago, and San Francisco) were subject to a higher traffic reduction within the
U.S. during the pandemic.
Figure 2-8: Evolution of IFR traffic at the main 34 airports
.
17
Prior to the transfer of operations to the New Istanbul airport on 06 April 2019, traffic at Istanbul Ataturk airport
has been included. Before the transfer of traffic to Berlin Brandenburg airport in October 2020, traffic at Berlin Tegel
airport has been considered in the analysis.
The analysis relates only to IFR flights. Some airports – especially in the U.S. – have a significant share of additional
VFR traffic which has not been considered in the analysis.
Average daily IFR departures at the main 34 airports
297
578
570
561
523
521
482
388
386
302
298
291
290
289
284
282
280
278
277
272
256
241
239
233
222
213
198
192
191
185
182
162
161
141
139
0 500 1000
Europe - M34
Istanbul (IST)
Amsterdam (AMS)
Paris (CDG)
Frankfurt (FRA)
London (LHR)
Madrid (MAD)
Barcelona (BCN)
Munich (MUC)
Palma (PMI)
London (LGW)
Rome (FCO)
Dublin (DUB)
Zurich (ZRH)
Athens (ATH)
Oslo (OSL)
Vienna (VIE)
Lisbon (LIS)
Copenhagen (CPH)
Paris (ORY)
Milan (MXP)
London (STN)
Brussels (BRU)
Stockholm (ARN)
Berlin (BER)
Geneva (GVA)
Warsaw (WAW)
Dusseldorf (DUS)
Malaga (AGP)
Nice (NCE)
Helsinki (HEL)
Cologne (CGN)
London (LTN)
Hamburg (HAM)
Bucharest (OTP)
Avg. daily IFR departures
2022
-20%
1%
-18%
-19%
-26%
-20%
-17%
-18%
-32%
1%
-24%
-31%
-11%
-22%
-6%
-18%
-27%
-8%
-23%
-10%
-20%
-11%
-24%
-27%
-43%
-13%
-25%
-38%
-1%
-7%
-32%
-16%
-16%
-31%
-17%
-400 -200 0 200
Change
2022 vs 2019
0
100
200
300
400
500
600
JAN
APR
JUL
OCT
JAN
APR
JUL
OCT
JAN
APR
JUL
OCT
JAN
APR
JUL
OCT
JAN
APR
JUL
2019 2020 2021 2022 2023
-91% vs.
April 2019
MAIN 34 AIRPORTS - EUROPE
0
100
200
300
400
500
600
JAN
APR
JUL
OCT
JAN
APR
JUL
OCT
JAN
APR
JUL
OCT
JAN
APR
JUL
OCT
JAN
APR
JUL
2019 2020 2021 2022 2023
-69% vs.
April 2019
MAIN 34 AIRPORTS - U.S. (CONUS)
487
982
963
892
834
756
673
638
617
598
555
545
542
542
512
494
481
475
421
403
401
387
383
370
368
326
306
296
287
281
281
277
240
231
212
0 500 1000
US (conus) - M34
Atlanta (ATL)
Chicago (ORD)
Dallas (DFW)
Denver (DEN)
Los Angeles (LAX)
Charlotte (CLT)
Las Vegas (LAS)
Miami (MIA)
New York (JFK)
Phoenix (PHX)
Seattle (SEA)
Houston (IAH)
Newark (EWR)
Boston (BOS)
Orlando (MCO)
New York (LGA)
San Francisco (SFO)
Minneapolis (MSP)
Salt Lake City (SLC)
Washington (DCA)
Detroit (DTW)
Philadelphia (PHL)
Ft. Lauderdale (FLL)
Washington (IAD)
Nashville (BNA)
Dallas Love (DAL)
Baltimore (BWI)
Memphis (MEM)
San Diego (SAN)
Chicago (MDW)
Tampa (TPA)
Houston (HOU)
Portland (PDX)
St. Louis (STL)
Avg. daily IFR departures
2022
-12%
-20%
-23%
-9%
-4%
-20%
-14%
3%
9%
-3%
-5%
-11%
-17%
-10%
-12%
0%
-5%
-23%
-24%
-5%
0%
-29%
-28%
-15%
-12%
8%
0%
-17%
-7%
-10%
-9%
-2%
-6%
-27%
-19%
-400 -200 0 200
Change
2022 vs 2019

COMPARISON OF OPERATIONAL ANS PERFORMANCE 14
U.S. – Europe Comparison of ANS performance (Edition 2023)
3 Comparison of operational ANS performance
3.1 INTRODUCTION AND BACKGROUND
This chapter evaluates ANS operational performance in the U.S. and in Europe, based on commonly
agreed indicators used in international benchmarking studies and in the ICAO Global Air Navigation
Plan (GANP) context [1]. More information about the GANP indicators is available online on the GANP
Portal – KPI Overview.
To ensure comparability based on a common set of data sources with a sufficient level of detail and
coverage, the operational comparison of ANS performance was limited to flights to or from the main
34 airports for IFR traffic in the U.S. and in Europe which account for approximately 68% and 65% of
the controlled flights in Europe and the U.S., respectively. As shown in the previous section, those
samples are more comparable in terms of traffic as it removes a large share of the smaller aircraft
(general aviation traffic), particularly in the U.S.
3.2 APPROACH
Before moving to the analysis of ANS-related operational performance, it is useful to look at the On-
time Performance (OTP) in the U.S. and in Europe. OTP is a widely used industry standard to measure
the reliability and service quality of air transport. Different from the analysis of ANS related
18
operational performance in the second part of the chapter, OTP compares published airline schedules
to actual departure and arrival times.
OTP is influenced by complex interactions between airlines, airport operators and Air Navigation
Service Providers (ANSPs), from the planning and scheduling phases up to the day of operation. Based
on experience and the level of predictability of operations, airlines may include time buffers in their
schedule to maintain a satisfactory level of OTP and schedule integrity. On the day of operations, OTP
is influenced by airline and airport related delays, extreme weather, security issues, late arriving
aircraft but also by the way ANS mange the traffic.
Although OTP is a valid indicator from a passenger point of view and provides first insights into the
level of air transport performance, the understanding of ANS related operational performance
requires a more sophisticated analysis of actual operations by flight phase without time buffers
included in airline schedules to compensate for expected travel time variations.
The analysis of ANS related operational performance based on established indicators is provided in
Chapter 3.4.
18
In this report, “ANS-related“ means that ANS has a significant influence on the operations.
Figure 3-1: On time performance and ANS related performance
Predictability and Efficiency of gate-to-gate ops.
Departure
delays
Scheduled block time
Departure
Punctuality
Arrival
Punctuality
Sched. Actual.
Sched. Actual.
OUT
OFF
ON
IN
Taxi-out En-route TMA Taxi-in
ANS-related
Buffer

15 COMPARISON OF OPERATIONAL ANS PERFORMANCE
U.S. – Europe Comparison of ANS performance (Edition 2023)
3.3 ON-TIME PERFORMANCE (OTP)
The OTP analysis in this report considers flights that
departed/arrived within 14 minutes and 59 seconds of their
scheduled departure/arrival time as “on-time” or “punctual”.
Cancelled and diverted flights are not included.
Figure 3-2 shows the arrival punctuality at the 34 main airports
in the U.S. and in Europe. Some seasonal patterns are visible
on both sides of the Atlantic. Whereas the winter performance is mostly affected by weather related
delays at airports, the summer is affected by higher demand and resulting congestion but also by
convective weather in the en-route airspace.
In 2019, arrival punctuality in the U.S. (80.1%) was almost 4 percentage points higher than in Europe
(76.5%). With the start of the COVID-19 pandemic in 2020, punctuality improved in both systems
because of the substantial drop in traffic. In the U.S., almost 90% of the flights at the main 34 airports
reached their destination within 15 minutes of their scheduled arrival time in 2020 (Europe 87%).
Figure 3-2: Arrival punctuality at the main 34 airports in the U.S. and in Europe (aggregated level)
As traffic began to rebound, punctuality levels started to decline once more on both sides of the
Atlantic. In the U.S., arrival punctuality consistently worsened from 2020 through mid-2023, falling
below the levels observed in 2019. In Europe, arrival punctuality initially saw a moderate decline in
2021 but then reached its all-time low in the summer of 2022. During this period, it became evident
that several service providers were not ready to scale up their operations to meet the rapidly
increasing demand.
Especially during the summer of 2022, this lack of preparedness resulted in unacceptably high delays
for passengers and numerous flight cancellations due to insufficient staff availability to handle
services, even though traffic remained below the 2021 levels. In July 2022, just 60% of flights at the 34
main airports arrived within 15 minutes of their scheduled times. Although there was an improvement
in performance during the first quarter of 2023, punctuality in Europe once again suffered a significant
decline with the onset of the 2023 holiday season.
The poor performance in Europe was not driven by a deterioration of performance in one single area
but by shortcomings at various levels, mainly related to staff shortages (airports, airlines, ATC).
Although a degradation of ANS performance contributed to the poor overall performance in Europe,
the main contributing factors were airline and airport related delays linked to passenger and ground
Arrival punctuality
% of arrivals delayed by less than 15 min vs published schedule
76.5%
87.2%
83.0%
70.9%
69.5%
50%
60%
70%
80%
90%
100%
Jan
Apr
Jul
Oct
Jan
Apr
Jul
Oct
Jan
Apr
Jul
Oct
Jan
Apr
Jul
Oct
Jan
Apr
Jul
2019 2020 2021 2022 2023
MAIN 34 AIRPORTS- EUROPE
80.1%
89.7%
83.0%
78.5%
75.8%
50%
60%
70%
80%
90%
100%
Jan
Apr
Jul
Oct
Jan
Apr
Jul
Oct
Jan
Apr
Jul
Oct
Jan
Apr
Jul
Oct
Jan
Apr
Jul
2019 2020 2021 2022 2023
MAIN 34 AIRPORTS - U.S. (CONUS)
Performance on day of operations
Scheduling of operations
Punctuality
Airport Airlines ANS
Airport Airlines ANS

COMPARISON OF OPERATIONAL ANS PERFORMANCE 16
U.S. – Europe Comparison of ANS performance (Edition 2023)
handling. The delays grew with each turnaround as the day progressed leading not only to lower
punctuality levels but also to an increase in average departure delay throughout the day.
Figure 3-3 shows a breakdown of the arrival punctuality at the main 34 airports in both regions,
including a comparison vs. 2019 when traffic levels at most airports were higher. It is worth pointing
out that poor arrival punctuality at an airport does not automatically mean that the airport was the
root cause of the problem of performing poorly. Although airports can act as delay amplifier when
there are local capacity constraints (runway, ground handling, etc.), arrival punctuality is mainly
affected by delay accumulated on previous flights legs at different locations throughout the network.
Figure 3-3: Arrival punctuality at the main 34 airports in the U.S. and in Europe (2022 vs. 2019)
As can be expected, the observed performance is not homogenous across airports. In Europe
19
, arrival
punctuality at the main 34 airports in 2022 ranged from 79.1% at Madrid (MAD) to 61.0% at London
Gatwick (LGW) airport.
Many of the U.S. airports with lower traffic levels than 2019 saw an increase in punctuality while
operating in a less constrained environment such as EWR (+2.2%), LGA (+3%), ORD (+3.7%), and SFO
(+7.3%). While the Florida airports MCO (-8.3%), MIA (-6.4%), and TPA (-6.1%) saw a decrease in
punctuality as traffic levels to the southeast exceeded pre-pandemic levels.
19
Please note that the transfer of operations to the new Istanbul airport took place on 6 April 2019. Therefore, the
analysis does not include the first 4 months of 2019.
Arrival punctuality
% of arrivals delayed by less than 15 min vs published schedule
70.9%
79.1%
76.5%
75.9%
75.6%
75.2%
74.9%
74.9%
74.6%
74.6%
74.4%
74.0%
73.6%
72.9%
72.8%
72.3%
72.0%
71.7%
71.6%
71.2%
70.4%
70.4%
70.1%
69.9%
69.9%
69.8%
69.6%
63.7%
63.4%
63.3%
62.8%
61.7%
61.7%
61.7%
61.0%
50% 100%
Europe
Madrid (MAD)
Helsinki (HEL)
Oslo (OSL)
Rome (FCO)
Paris (ORY)
Copenhagen (CPH)
Barcelona (BCN)
Munich (MUC)
Geneva (GVA)
Stockholm (ARN)
Vienna (VIE)
Amsterdam (AMS)
London (LHR)
Zurich (ZRH)
Dusseldorf (DUS)
Paris (CDG)
Hamburg (HAM)
Brussels (BRU)
Warsaw (WAW)
Frankfurt (FRA)
Athens (ATH)
Malaga (AGP)
Milan (MXP)
Nice (NCE)
Palma (PMI)
Berlin (BER)
Bucharest (OTP)
London (LTN)
London (STN)
Cologne (CGN)
Lisbon (LIS)
Istanbul (IST)
Dublin (DUB)
London (LGW)
% of punctual arrivals
2022
-5.7%
0.2%
-2.6%
-4.1%
-6.2%
-2.7%
-5.7%
-0.1%
-4.0%
-2.5%
-3.6%
-1.2%
-1.7%
-5.5%
-2.9%
-7.6%
-7.3%
-5.7%
-2.8%
-5.5%
-6.3%
-1.0%
-9.2%
-1.8%
-5.6%
-7.6%
-2.5%
-8.0%
-8.7%
-11.8%
-13.8%
-2.2%
-21.3%
-11.8%
-6.2%
-30% -10% 10%
Change
2022 vs 2019
78.5%
85.0%
83.3%
82.8%
82.5%
82.2%
81.6%
81.6%
81.2%
80.6%
80.3%
80.3%
80.3%
80.1%
79.8%
79.7%
78.8%
78.6%
78.3%
78.0%
77.6%
77.2%
76.6%
76.4%
76.4%
76.1%
75.7%
75.0%
75.0%
74.2%
73.8%
72.4%
72.2%
71.3%
70.5%
50% 100%
US (conus)
Salt Lake City (SLC)
Atlanta (ATL)
Detroit (DTW)
Houston (IAH)
Charlotte (CLT)
Minneapolis (MSP)
Seattle (SEA)
San Francisco (SFO)
Chicago (ORD)
Los Angeles (LAX)
Portland (PDX)
Philadelphia (PHL)
Washington (IAD)
Phoenix (PHX)
Dallas (DFW)
Denver (DEN)
San Diego (SAN)
Houston (HOU)
Nashville (BNA)
St. Louis (STL)
Baltimore (BWI)
Washington (DCA)
Miami (MIA)
Chicago (MDW)
Memphis (MEM)
Dallas Love (DAL)
Boston (BOS)
New York (LGA)
Las Vegas (LAS)
Tampa (TPA)
New York (JFK)
Ft. Lauderdale (FLL)
Newark (EWR)
Orlando (MCO)
% of punctual arrivals
2022
-1.5%
-0.4%
-2.3%
-1.7%
3.1%
-1.2%
-2.1%
1.6%
7.3%
3.7%
-0.6%
-3.6%
-0.8%
-0.8%
-2.4%
0.1%
-0.5%
-2.7%
-4.5%
-3.5%
-3.0%
-6.7%
-3.7%
-6.4%
-6.9%
-3.2%
-6.1%
-0.1%
3.0%
-6.4%
-6.1%
-6.6%
-4.2%
2.2%
-8.3%
-30% -10% 10%
Change
2022 vs 2019

17 COMPARISON OF OPERATIONAL ANS PERFORMANCE
U.S. – Europe Comparison of ANS performance (Edition 2023)
3.4 ANS- RELATED OPERATIONAL PERFORMANCE
This section analyses ANS-related performance at the main 34 airports in the U.S. and in Europe in
more detail. The analysis is based on the joint work in the previous comparison reports. The specific
indicators used in this section were developed using common procedures on comparable data from
both the FAA-ATO and EUROCONTROL. The indicators are aligned and compatible with the KPIs
listed in the ICAO Global Air Navigation Plan (GANP) [5]which can be used to assess the benefits of
the global implementation of Aviation System Block Upgrades (ASBUs).
To better understand the impact of ATM and differences in management techniques, the analysis is
broken down by phase of flight. As illustrated in Figure 3-4, inefficiencies in the different flight phases
have different impacts on aircraft operators and the environment. The U.S. and Europe currently use
different strategies for absorbing necessary delay in the various flight phases. Whereas some Traffic
Management Initiatives (TMIs) have an impact on flights at the gate, other TMIs impact on the gate-
to-gate phase which may generate additional fuel burn and CO
2
emissions (see also Chapter 1.2.1).
However, keeping an aircraft at the gate saves fuel but, if it is held and capacity goes unused, the cost
to the airline of the extra delay may by far exceed the fuel cost.
Figure 3-4: Measures of operational efficiency by phase of flight
The goal is to minimize overall direct (fuel, etc.) and strategic (schedule buffer, etc.) costs and the
impact on environment whilst maximizing the utilization of available capacity. Hence, not all
inefficiencies are to be seen as negative. A certain level is necessary or even desirable if a system is to
be run efficiently without underutilization of available resources. As adverse weather and other
factors will continue to impact ANS capacities in the foreseeable future, there is a benefit in better
understanding the interrelations between variability, efficiency and capacity utilisation.
For the interpretation of the results, the following points should be borne in mind:
• Some of the efficiency indicators in this report compare actual performance to an ideal
(uncongested or unachievable) situation which is not realistic at system level when operational
trade-offs, environmental or political restrictions, or other performance affecting factors such as
weather conditions are considered;
• A clear-cut allocation between ANS and non-ANS related causes is often difficult. While ANS is
often not the root cause of the problem (weather, etc.) the way the situation is handled can have
a significant influence on performance (i.e. distribution of delay between air and ground, use of
scarce capacity, etc.) and thus on costs to airspace users;
• ANS performance is inevitably affected by airline operational trade-offs on each flight. The
measures in this report do not attempt to capture airline goals on an individual flight basis.
Airspace user preferences to optimize their operations based on time and costs can vary
depending on their needs and requirements (fuel price, business model, etc.); and,
• The taxi-in and the TMA departure phase were not analysed in more detail as they are generally
not considered to be large contributors to ANS-related inefficiencies. However, it is
acknowledged that at some selected airports the efficiency of the taxi in phase can be an issue
due to apron and stand limitations. Other restrictions at individual airports may also need further
study to quantify improvement opportunities.
GATE-to-GATE
engines on
DEPARTURE
engines-off
ANS-related
Holding at the
Gate (ATFM/
EDCT)
Taxi-out
efficiency
En-route
Flight
efficiency
IFR flights
To/from
Main 34
airports
Efficiency
In last
100NM
Taxi-in
efficiency
IFR flights
To/from
Main 34
airports

COMPARISON OF OPERATIONAL ANS PERFORMANCE 18
U.S. – Europe Comparison of ANS performance (Edition 2023)
3.4.1 ANS-RELATED DEPARTURE RESTRICTIONS (ATFM/EDCT DELAYS)
This section reviews ANS-related departure delays
in the U.S. and in Europe.
Both the U.S. and Europe report ATM-related delay
imposed on departing flights through Traffic
Management Initiatives (TMIs)
20
to achieve required levels of safety as well as to balance demand and
capacity most effectively. Reducing gate/surface delays (by releasing too many aircraft) at the origin
airport when the destination airport’s capacities are constrained potentially increases airborne delay
(i.e. holding or extended final approaches). Applying excessive gate/surface delays on the other hand,
risks underutilization of capacity and thus increase overall delay.
As described in Chapter 1.2.1, holdings at the gate are in Europe commonly used to handle en-route
and airport constraints already prior to departure. Aircraft subject to ATFM restrictions are held at the
gate at the departure airport according to an ATFM slot, allocated by the European Network Manager.
In the U.S., ground delay programs are mostly used in case of severe capacity restrictions when less
constraining flow measures in the gate-to-gate phase are not sufficient. The Air Traffic Command
Center (ATCSCC) applies Estimated Departure Clearance Times (EDCT) to delay flights prior to
departure.
The resulting delays are calculated with reference to the times in the last submitted flight plan (i.e.,
not the departure times in airline schedules). For the U.S., this is an estimated take-off time based on
the time an aircraft enters FAA control (calls ready) plus a nominal taxi-out time. Most of these delays
are taken at the gate but some delays due to local en-route departure and MIT restrictions occur also
during the taxi phase (see Chapter 3.4.2).
To stay consistent with previous U.S./EU comparison reports, only ATFM/EDCT delays equal or
greater than 15 minutes were included in the analyses.
Table 3-1 compares ATM-related departure restrictions at the gate, imposed in the two ATM systems
due to en-route and airport constraints. As can be expected, the share of flights affected by departure
restrictions at origin airports differs considerably between the U.S. and Europe.
Table 3-1: ATFM/EDCT departure delays (overview)
Flights in Europe are more than 5 times more likely to be held at the gate for en-route constraints than
in the U.S. where the share of flights was just below 1% in 2022.
20
The ATM/TMIs shown for the U.S. in this section include all TMI delays. The TMIs included are Ground Stops (GS),
Ground Delay Program (GDP), Collaborative Trajectory Options Program (CTOP), Airspace Flow Programs (AFP),
Severe Weather Avoidance Plan (SWAP), Miles in Trail (MIT), Minutes in Trail (MINIT), Departure Stops, Metering,
Departure/En-Route/Arrival Spacing Programs (DSP/ESP/ASP).
2017 2019 2022 2017 2019 2022
IFR flights (M) 5.3 M 5.5 M 4.6 M 8.4 M 8.8 M 7.7 M
% of flights delayed >=15 min.
5.3% 7.5% 7.0% 3.4% 3.2% 1.9%
delay per flight (min.)
1.5 2.1 2.1 2.1 2.0 1.0
delay per delayed flight (min.)
29 29 30 61 63 52
% of flights delayed >=15 min.
2.5% 2.6% 1.6% 2.4% 2.3% 1.1%
delay per flight (min.)
0.8 0.8 0.5 1.7 1.7 0.7
delay per delayed flight (min.)
31 31 33 71 74 63
% of flights delayed >=15 min.
2.8% 4.8% 5.4% 1.0% 0.9% 0.9%
delay per flight (min.)
0.8 1.3 1.6 0.4 0.3 0.3
delay per delayed flight (min.)
27 27 29 36 34 39
EUROPE
U.S. (CONUS)
Total delays >=15min.
(ATM/TMI)
En route related delays
>=15min. (ATM/TMI)
Only ATFM/EDCT/TMI delays > = 15 min. are
included.
Airport related delays
>=15min. (ATM/TMI)

19 COMPARISON OF OPERATIONAL ANS PERFORMANCE
U.S. – Europe Comparison of ANS performance (Edition 2023)
For airport related delays the percentage of flights delayed at the gate is only slightly lower in the U.S.
than in Europe but the delay per delayed flight is about twice as high in the U.S. which is consistent
with the use of departure holdings at the gate in the U.S. only as a last resort.
Figure 3-5 shows the average ATFM/EDCT delay by charged facility (en-route, airport) for traffic to
and from the main 34 airports between 2018 and July 2023 at an aggregated level.
Figure 3-5: Average ATFM/EDCT delay per flight at the main 34 airports (aggregated view)
The ATFM related average holding time at the gate is much higher in Europe and shows a clear
seasonal pattern - peaking in summer when traffic levels are highest. It is worth pointing out that 2018
and 2019 were particularly bad years with exceptionally high ATFM delays in Europe after a
continuous degradation of performance since 2013, mainly because of growing en-route capacity
constraints in a limited number of ACCs in the core area which impacted the entire European network
in 2018/19.
Virtually no ATFM/EDCT delay was reported in both regions in 2020, following the unprecedented
COVID-19 related drop in traffic. With traffic recovering again, ATFM/EDCT delays started to rise
again on both sides of the Atlantic but stayed in the U.S. well below the levels observed before the
pandemic.
In Europe, with traffic continuing to recover further, it became obvious that the European ATM
network was not ready to support the traffic levels served in 2019. ATFM delays were recorded at
notably lower daily traffic levels in summer 2022 than in 2018 or in 2019 which is an indication that
ANSPs were unable to deploy as much capacity to handle traffic demand as they had been able to
deploy prior to the COVID-19 pandemic.
ATFM/EDCT departure delays can be further broken down by attributed delay cause (ATC capacity,
staffing, weather, etc.). Figure 3-6 shows a breakdown of the ATFM/EDCT delays by facility (en-route
vs. airport) and by attributed delay cause to get a better understanding of the underlying drivers in
each region.
It confirms again the already highlighted difference between U.S. and Europe in terms of attribution
of delays between en-route facilities and airports. In the U.S. most ATFM/EDCT delays in 2022 were
due to airports (66%) while in Europe most delays (75%) were attributed to en-route facilities.
By far the main reason for delays in the U.S. in 2022 was adverse weather (76%) with a high share
originating from airports (53.3%). In Europe, the main cause in 2022 was ATC capacity and staffing
constraints (including ATC industrial actions) accounting for 44% closely followed by adverse weather
En-route and airport ATFM/EDCT/TMI delay (>=15 min) per flight
(flights within the respective region - to or from the main 34 airports)
2.7
2.5
0.7
0.5
2.2
2.9
0
1
2
3
4
5
JAN
JUL
JAN
JUL
JAN
JUL
JAN
JUL
JAN
JUL
JAN
JUL
2018 2019 2020 2021 2022 2023
Total En-route Airport
MAIN 34 AIRPORTS - EUROPE
1.9
2.0
0.4
0.8
1.0
1.1
0
1
2
3
4
5
JAN
JUL
JAN
JUL
JAN
JUL
JAN
JUL
JAN
JUL
JAN
JUL
2018 2019 2020 2021 2022 2023
Total (month) En-route
Airport Total (annual)
MAIN 34 AIRPORTS - U.S. (CONUS)

COMPARISON OF OPERATIONAL ANS PERFORMANCE 20
U.S. – Europe Comparison of ANS performance (Edition 2023)
(29%) and “Other” reasons (24%). The high share of “Other” delay in Europe was mainly due to ‘special
events’ such as the implementation of various ATC capacity projects (requiring capacity reductions
during the implementation phase) and to airspace restrictions associated with the war in Ukraine.
Figure 3-6: Breakdown of ATFM/EDCT delay by cause and facility
Unlike in Europe, only few airports in the U.S. have schedule limitations and the ATM system is more
geared towards maximizing system and airport throughput under prevailing conditions on the day of
operations. Hence, many issues in the U.S. appear to be attributable to the effects of capacity
variation between most favorable and least favorable conditions, particularly in a highly dense
airspace such as the Greater New York area. Thus, a large part of the EDCT delays in the U.S. originate
from only a limited number of airports (EWR, LGA, JFK, ORD, BOS, SFO, and LAX), mainly due to
adverse weather (wind, thunderstorms, and low ceilings).
This is also confirmed by the analysis of the arrivals at the main 34 airports in the U.S. and in Europe
in Figure 3-7. Whereas in Europe the ATFM/EDCT delays are more equally distributed between en-
route and airport facilities but also between airports, in the U.S., the delays in 2022 were mainly due
to New York La Guardia (LGA) and Newark (EWR) airport.
In Europe, high ATFM delays for arrivals can be observed at London Gatwick (LGW), Lisbon (LIS),
Cologne (CGN), Amsterdam (AMS), and Berlin (BER). A large part of the delay is related to en-route
ATFM delays.
With traffic slower to return to Newark (EWR), San Francisco (SFO), and New York La Guardia (LGA)
in 2022 the ATFM delay attributed to these airports remained well below the 2019 levels. While the
Florida airports had a slight increase in enroute delay coinciding with increased traffic volume.
More analysis is needed to evaluate how the moderation of demand with “airport slots” in Europe
impacts on the significant difference in ATFM/EDCT delay attribution between the U.S. and Europe.
Breakdown of ATFM/ EDCT/TMI delay by cause
only delays equal or greater than 15 minutes are included
11.0%
3.6%
75.6%
9.0%
3.4%
53.3%
0%
20%
40%
60%
80%
100%
22.3%
0%
20%
40%
60%
80%
100%
Other
Equipment
Weather
Runway/Taxi
Volume
Airport
En-route
75.0%
25.0%
EUROPE (2022)
44.3%
29.4%
24.2%
11.2%
10.3%
0%
20%
40%
60%
80%
100%
33.1%
19.1%
21.8%
0%
20%
40%
60%
80%
100%
Other
Equipment
Weather
Runway/Taxi
Volume
Airport
En-route
33.8%
66.2%
U.S. CONUS (2022)

21 COMPARISON OF OPERATIONAL ANS PERFORMANCE
U.S. – Europe Comparison of ANS performance (Edition 2023)
Figure 3-7: Average ATFM/EDCT delay per flight at the main 34 airports
3.4.2 TAXI-OUT EFFICIENCY
This section analyses inefficiencies in the taxi out phase.
The measure is influenced by several factors such as
take-off queue size (waiting time at the runway),
distance to runway (runway configuration, stand
location), downstream restrictions, aircraft type, and remote de-icing to name a few. Of these causal
factors, the take-off queue size is considered to be the most important one.
In the U.S., the additional time observed in the taxi-out phase also includes TMS delays due to local
en-route departure and MIT restrictions. In Europe, the additional time might also include a small
share of ATFM delay which is not taken at the departure gate.
The analysis is in line with the proposed GANP KPI02 methodology to determine the additional taxi
out time. The methodology refers to the period between the time when the aircraft leaves the stand
(actual off-block time) and the take-off time. The additional time is measured as the average
additional time beyond an unimpeded reference time computed as the 20th percentile of the gate-
runway combinations at the analyzed airports over the entire analysis period.
Figure 3-8 shows the result for the U.S. and Europe at aggregated level between 2018 and mid-2023.
Seasonal patterns are visible on both sides of the Atlantic – but with different cycle. Whereas in Europe
the additional times peak during the winter months (most likely due to weather conditions and de-
icing), in the U.S. the peak is in the summer which is most likely linked to congestion.
There was a substantial reduction in additional taxi-out time in the U.S. in early 2020, corresponding
En-route and airport ATFM/EDCT/TMI delay (>=15 min) per arrival
arrivals at main 34 airports in the U.S. and in Europe
2.2
6.4
5.1
3.7
3.4
3.3
3.2
3.1
3.0
2.8
2.8
2.7
2.7
2.6
2.5
2.3
2.3
2.3
2.1
2.1
1.8
1.8
1.7
1.6
1.5
1.5
1.5
1.4
1.3
1.1
1.0
0.9
0.9
0.7
0.6
0.0 5.0 10.0
Europe (M34)
London (LGW)
Lisbon (LIS)
Cologne (CGN)
Amsterdam (AMS)
Berlin (BER)
Warsaw (WAW)
Palma (PMI)
London (LTN)
Dusseldorf (DUS)
London (STN)
Hamburg (HAM)
London (LHR)
Athens (ATH)
Paris (ORY)
Nice (NCE)
Brussels (BRU)
Zurich (ZRH)
Bucharest (OTP)
Vienna (VIE)
Paris (CDG)
Istanbul (IST)
Frankfurt (FRA)
Geneva (GVA)
Barcelona (BCN)
Dublin (DUB)
Munich (MUC)
Milan (MXP)
Palma (PMI)
Rome (FCO)
Copenhagen (CPH)
Madrid (MAD)
Stockholm (ARN)
Oslo (OSL)
Helsinki (HEL)
Avg. per arrival (min)
2022
Airport related
En-route related
-0.2
1.4
0.1
1.4
-2.2
0.4
1.6
-0.1
-0.3
0.3
0.1
0.8
-0.8
-1.9
0.3
0.4
-1.1
-0.5
0.0
-1.0
0.4
0.3
-0.7
-0.3
-1.2
0.5
-0.1
-0.1
-0.5
0.2
0.2
-1.2
0.0
0.0
-0.2
-15 -5 5
Change
2022 vs 2019 (min)
1.3
6.9
6.8
2.1
2.0
1.9
1.9
1.8
1.8
1.7
1.7
1.6
1.5
0.9
0.9
0.8
0.8
0.6
0.6
0.5
0.5
0.4
0.4
0.4
0.4
0.3
0.3
0.3
0.3
0.3
0.2
0.2
0.2
0.1
0.1
0.0 5.0 10.0
U.S. (M34)
New York (LGA)
Newark (EWR)
New York (JFK)
Boston (BOS)
Las Vegas (LAS)
Orlando (MCO)
Chicago (ORD)
Washington (DCA)
Ft. Lauderdale (FLL)
Miami (MIA)
Tampa (TPA)
Dallas Love (DAL)
San Francisco (SFO)
Dallas (DFW)
Denver (DEN)
Philadelphia (PHL)
Washington (IAD)
Houston (IAH)
Baltimore (BWI)
San Diego (SAN)
Seattle (SEA)
Minneapolis (MSP)
Charlotte (CLT)
Houston (HOU)
Nashville (BNA)
Atlanta (ATL)
Los Angeles (LAX)
Detroit (DTW)
Chicago (MDW)
Phoenix (PHX)
Memphis (MEM)
St. Louis (STL)
Salt Lake City (SLC)
Portland (PDX)
Avg. per arrival (min)
2022
Airport related
En-route related
-1.5
-6.6
-11.8
-2.4
-4.3
0.8
1.0
-4.5
0.0
0.9
1.1
1.0
0.9
-9.6
-1.2
-0.9
-2.6
-0.5
-1.3
-0.1
0.2
-1.4
-0.9
-0.4
-0.2
0.0
-0.4
-0.6
-0.4
-0.2
-0.1
-0.3
0.0
-0.1
-0.1
-15 -5 5
Change
2022 vs 2019 (min)

COMPARISON OF OPERATIONAL ANS PERFORMANCE 22
U.S. – Europe Comparison of ANS performance (Edition 2023)
to the decrease in traffic due to the onset of the pandemic. However, this additional taxi-out time
gradually rebounded and eventually returned to a level comparable to the pre-pandemic period.
In Europe, a comparable decline in the average additional taxi-out time occurred after the pandemic
outbreak. In line with the slower traffic recovery in Europe, average additional taxi-out time remained
relatively low until 2022 when it began to rise again to almost reach pre-pandemic levels by the first
half of 2023.
Figure 3-8: Additional times in the taxi-out phase (aggregated view)
Figure 3-9: Additional times in the taxi-out phase (2022 vs. 2019)
Figure 3-9 shows a breakdown of additional taxi-out time by airport in 2022, including a comparison
vs. 2019. Particularly in the U.S., the high-level result is driven by contrasted situations among airports
Additional time in the taxi out phase
(minutes per departure)
3.6
3.7
2.1
2.2
2.9
3.3
0.0
1.0
2.0
3.0
4.0
5.0
6.0
7.0
8.0
JAN
MAY
SEP
JAN
MAY
SEP
JAN
MAY
SEP
JAN
MAY
SEP
JAN
MAY
SEP
JAN
MAY
2018 2019 2020 2021 2022 2023
MAIN 34 AIRPORTS - EUROPE
7.0
7.0
4.4
5.2
6.3
7.0
0.0
1.0
2.0
3.0
4.0
5.0
6.0
7.0
8.0
JAN
MAY
SEP
JAN
MAY
SEP
JAN
MAY
SEP
JAN
MAY
SEP
JAN
MAY
SEP
JAN
MAY
2018 2019 2020 2021 2022 2023
MAIN 34 AIRPORTS - U.S. (CONUS)
2.9
5.1
5.0
4.7
4.4
3.9
3.7
3.5
3.4
3.3
3.3
3.3
3.1
2.8
2.7
2.7
2.7
2.6
2.6
2.6
2.6
2.5
2.4
2.4
2.4
2.2
2.1
2.1
2.1
2.1
2.0
2.0
1.9
1.9
1.9
0 5 10 15
Europe (main 34)
London (LGW)
Dublin (DUB)
Rome (FCO)
London (STN)
London (LTN)
London (LHR)
Milan (MXP)
Istanbul (IST)
Athens (ATH)
Oslo (OSL)
Helsinki (HEL)
Paris (CDG)
Malaga (AGP)
Palma (PMI)
Warsaw (WAW)
Bucharest (OTP)
Copenhagen (CPH)
Madrid (MAD)
Zurich (ZRH)
Cologne (CGN)
Munich (MUC)
Lisbon (LIS)
Barcelona (BCN)
Geneva (GVA)
Amsterdam (AMS)
Berlin (BER)
Frankfurt (FRA)
Vienna (VIE)
Paris (ORY)
Stockholm (ARN)
Dusseldorf (DUS)
Nice (NCE)
Hamburg (HAM)
Brussels (BRU)
Minutes per departure
2022
-0.7
-2.2
-0.5
-1.9
0.1
-0.2
-2.8
-1.1
0.0
1.1
-0.7
-0.3
-0.3
0.2
0.2
-0.6
-0.7
0.0
-0.5
-1.0
0.5
-1.0
-0.9
-1.0
-0.3
-0.4
-0.1
-1.7
-0.6
-0.3
-0.3
-1.0
-0.4
-0.2
-0.5
-5 0 5
Change
2022 vs 2019
6.3
11.7
11.6
9.5
9.0
8.9
8.1
7.8
7.5
7.5
7.2
7.1
7.0
6.7
6.5
6.3
6.1
5.5
5.4
5.1
4.6
4.5
4.5
4.3
4.2
4.1
4.1
3.8
3.5
3.4
3.2
3.2
2.8
2.5
2.4
0 5 10 15
US (main 34)
New York (LGA)
Newark (EWR)
Chicago (ORD)
New York (JFK)
Washington (DCA)
Charlotte (CLT)
Philadelphia (PHL)
Washington (IAD)
San Diego (SAN)
Orlando (MCO)
Miami (MIA)
Seattle (SEA)
Las Vegas (LAS)
Dallas (DFW)
Denver (DEN)
Houston (IAH)
San Francisco (SFO)
Boston (BOS)
Minneapolis (MSP)
Phoenix (PHX)
Los Angeles (LAX)
Tampa (TPA)
Baltimore (BWI)
Nashville (BNA)
Chicago (MDW)
Ft. Lauderdale (FLL)
Salt Lake City (SLC)
Dallas Love (DAL)
Houston (HOU)
Portland (PDX)
St. Louis (STL)
Memphis (MEM)
Detroit (DTW)
Atlanta (ATL)
Minutes per departure
2022
-0.8
-2.1
-1.2
-2.4
0.0
1.3
-0.2
-1.9
-1.3
0.6
1.8
1.5
-0.9
1.2
-1.1
-1.3
-2.1
-3.8
-0.6
-1.1
-0.1
-1.3
0.8
-0.2
0.5
0.5
-1.4
-0.3
-0.2
0.3
-0.3
-0.8
-0.2
-2.3
-1.1
-5 0 5
Change
2022 vs 2019
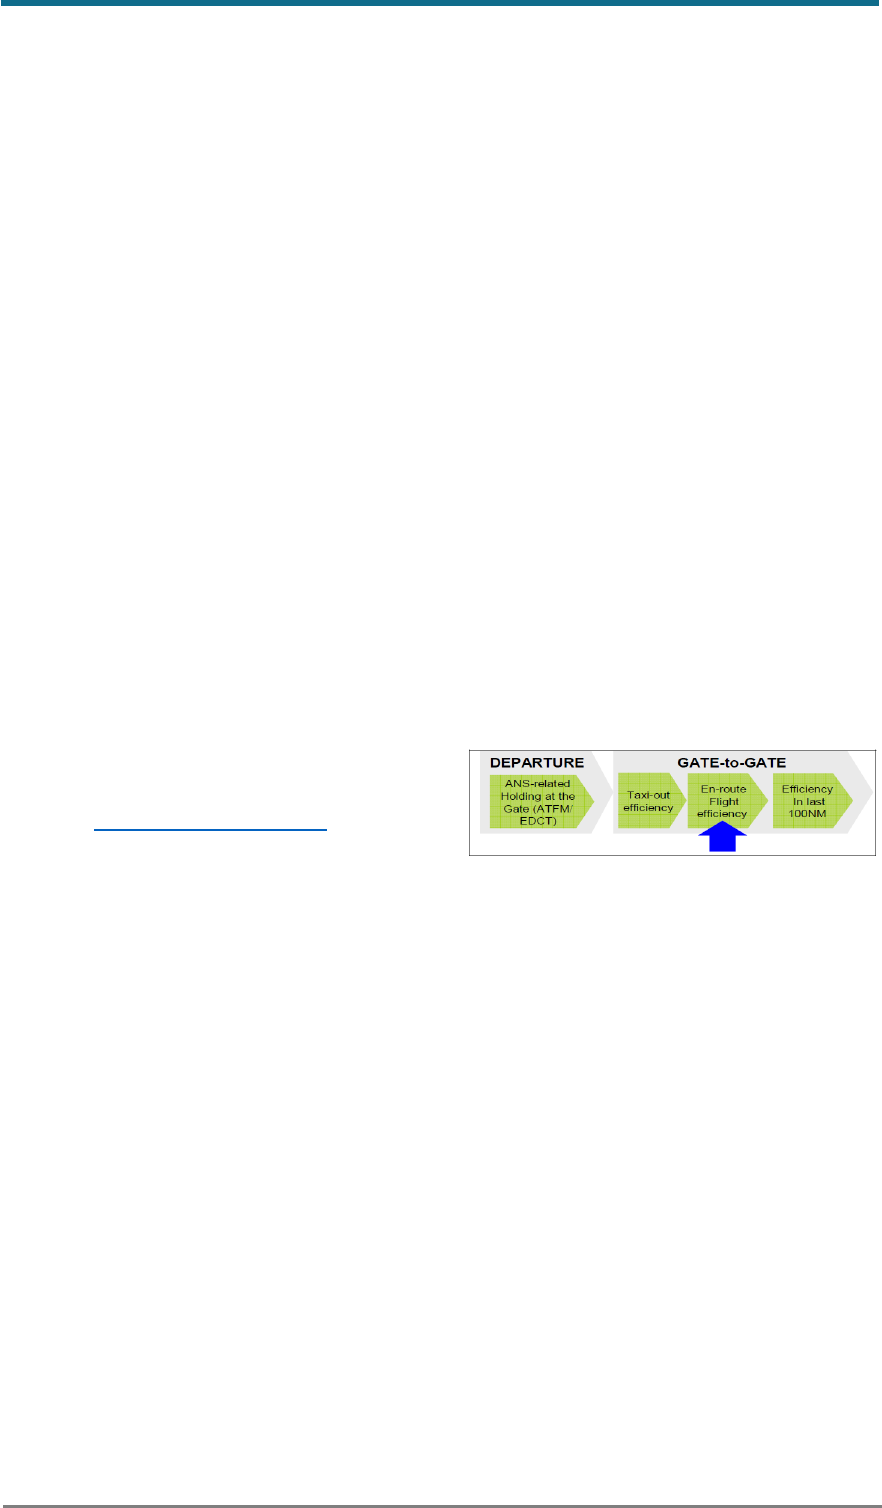
23 COMPARISON OF OPERATIONAL ANS PERFORMANCE
U.S. – Europe Comparison of ANS performance (Edition 2023)
and, to a large extent, influenced by the performance at the airports in the New York metropolitan
area and Chicago where average additional taxi out times above 10 minutes were observed.
Many of the U.S. airports that had lower daily departure traffic than 2019 levels also had a decrease
in taxi out delay, for example: New York La Guardia (LGA) (departures -23%), Newark (EWR)
(departures -10%), Chicago (ORD) (departures -23%), San Francisco (SFO) (departures -23%).
In Europe, overall taxi-out performance at the main 34 airports in 2022 was still slightly below the level
of 2019, but with less traffic than in 2019. The highest average additional taxi-out times in 2022 were
observed at London Gatwick (LGW), Dublin (DUB), Rome (FCO) and the three other London airports
(STN, LTN, LHR). The most significant improvements compared to 2019 were observed at London
Heathrow (LHR), London Gatwick (LGW), Rome Fiumicino (FCO), and Frankfurt (FRA).
Overall, additional taxi-out times appear to be notably higher in the U.S which is mainly due to the
difference in flow control policies (more tactical focus) and the absence of scheduling caps at most
U.S. airports (see Chapter 1.2.1). At an aggregated level, the average additional taxi-out time in the
U.S. is roughly twice the additional time observed in Europe.
Although the impact of ANSPs on total additional time is limited when runway capacities are
constraining departures, in Europe, Airport Collaborative Decision Making (A-CDM) initiatives try to
optimize the departure queue by managing the pushback times. The aim is to keep aircraft at the
stand to reduce additional time and fuel burn in the taxi-out phase to a minimum by providing only
minimal queues and improved sequencing at the threshold to maximize runway throughput. The
resulting inefficiencies would show as ATC related departure delays at the gate.
3.4.3 HORIZONTAL EN-ROUTE FLIGHT EFFICIENCY
This section analyses inefficiencies in the horizontal
en-route flight phase. The analysis is in line with the
proposed GANP KPI05 methodology to determine
the actual en-route extension. The flight efficiency
in the terminal maneuvering areas (TMA) of airports is addressed in the next section.
It is acknowledged that flight efficiency also has a vertical component which is also important in terms
of additional fuel burn and environmental impact. The horizontal en-route flight efficiency (HFE)
indicator in this report does not measure this vertical component and there is scope for further
improvement in future reports. Such additional work on vertical flight inefficiencies and potential
benefits of implementing Continuous Descent Operations (CDO) will form a more complete picture.
The efficiency of a flight in the en-route phase is affected by a considerable number of factors
involving different stakeholders. Not all those factors are under the direct control of ANS (adverse
weather, segregated airspace, etc.) but ANS has a role to play in reducing the constraints to a
necessary minimum while maximizing the use of airspace and ensuring safe separation of flights.
In view of external factors such as adverse weather and necessary (safety) as well as desired (capacity)
trade-offs, there will always be a certain level of flight inefficiency which is important to bear in mind
for the interpretation of the results.
The HFE indicator in this report compares the actual flown trajectory with the shortest distance
between flight origin and destination using the Great Circle Distance (GCD). “En-route” is defined as
the portion between a 40 NM radius around the departure airport and a 100 NM radius around the
arrival airport. Where a flight departs or arrives outside the respective airspace, only that part inside
the airspace is considered. Flights with a great circle distance (G) shorter than 60NM between terminal
areas were excluded from the analysis.

COMPARISON OF OPERATIONAL ANS PERFORMANCE 24
U.S. – Europe Comparison of ANS performance (Edition 2023)
It is acknowledged that such a distance-based approach does not necessarily correspond to the
“optimum” trajectory when meteorological conditions or economic preferences of airspace users are
considered for specific flights. However, when used at the strategic level, the indicator will point to
areas where horizontal flight efficiency is increasing or decreasing over time.
Figure 3-10 shows the average horizontal en-route flight efficiency of flights to or from the main 34
airports in the U.S. and Europe. Only flights taking off and landing within the respective region were
considered in the analysis (i.e. transatlantic flights are excluded). An “inefficiency” of 5% means for
instance that the extra distance over 1 000 NM was 50 NM.
Figure 3-10: Horizontal en-route flight efficiency
Overall, the level of horizontal en-route flight efficiency in both regions seems similar. Both regions
show seasonal patterns with lower flight efficiency in summer, which is mainly due to adverse weather
(particularly in the U.S.) and congested airspace (particularly in Europe).
The sharp decline in traffic that occurred after the onset of COVID-19 in March 2020 led to a temporary
and brief improvement in horizontal en-route flight efficiency in both Europe and the U.S. However,
as traffic began to recover, flight efficiency deteriorated again, returning to levels similar to those
seen before the pandemic on both sides of the Atlantic.
In Europe, virtually from one day to the next the flow measures implemented to manage the en-route
capacity crisis (re-routing, level-capping) in 2019 were no longer necessary and therefore removed.
Yet, as traffic continued to rebound throughout 2022, the implementation of new measures to
alleviate congestion in ACCs and the effects of the war in Ukraine led to a decline in horizontal en-
route flight efficiency resulting in efficiency levels falling below those observed in 2019.
In recent years, the ongoing adoption of Free Route Airspace (FRA) across Europe has yielded
significant advantages. FRA provides airlines with a more adaptable framework in contrast to a rigid
route structure, offering increased options and opportunities to curtail fuel consumption and
emissions. Despite these regional efforts, there is room for further enhancements, primarily
stemming from the fragmented nature of European airspace design, which remains the responsibility
of individual states. While local efficiency has improved through FRA implementation, there is a need
to shift attention toward cross-border initiatives to fully harness the broader network-wide benefits.
In the U.S., horizontal en-route flight efficiency also includes some path stretching due to Miles in Trail
(MIT) restrictions (compare Chapter 1.2.1). While many of the heaviest travelled city pairs in the U.S.
such as San Francisco to Los Angeles or Chicago to the New York area achieve direct routing for most
flights, some important city pairs are affected by special activity airspaces on the East and the West
Coast impacting negatively on flight efficiency. Also, the existing route design into the New York area
Average horizontal en-route flight inefficiency (%)
flights to or from the main 34 airports within the respective region
3.1%
2.8%
2.8%
3.3%
3.4%
1.0%
1.5%
2.0%
2.5%
3.0%
3.5%
4.0%
Jan
Apr
Jul
Oct
Jan
Apr
Jul
Oct
Jan
Apr
Jul
Oct
Jan
Apr
Jul
Oct
Jan
Apr
Jul
2019 2020 2021 2022 2023
MAIN 34 AIRPORTS - EUROPE
3.1%
2.6%
3.0%
2.9%
3.1%
1.0%
1.5%
2.0%
2.5%
3.0%
3.5%
4.0%
Jan
Apr
Jul
Oct
Jan
Apr
Jul
Oct
Jan
Apr
Jul
Oct
Jan
Apr
Jul
Oct
Jan
Apr
Jul
2019 2020 2021 2022 2023
MAIN 34 AIRPORTS - U.S. (CONUS)

25 COMPARISON OF OPERATIONAL ANS PERFORMANCE
U.S. – Europe Comparison of ANS performance (Edition 2023)
does not allow for direct flights for some key city pairs (DFW and IAH to New York Area) due to high
traffic and the presence of major airports located close together. Over time, flight paths have moved
further away from the New York area. The excess distance is needed to manage workload and
maintain safety.
While there are economic and environmental benefits in improving flight-efficiency, there are also
inherent limitations on both sides of the Atlantic. Trade-offs and interdependencies with other
performance areas, including safety, capacity, environment, shared civil/military airspace and
airspace user preferences (such as selecting routes due to weather conditions, wind-optimized routes,
or other factors like variations in route charges), need to be considered.
While new technologies and procedures have helped to further optimize safety, added some capacity,
and increased efficiency (e.g. Reduced Vertical Separation Minima, RNAV), it will remain challenging
to maintain the same level of efficiency while absorbing projected demand increases over the next 20
years.
3.4.4 FLIGHT EFFICIENCY WITHIN THE LAST 100NM
This section analyses the level of inefficiencies due to
airborne holding and metering that occur during the
arrival/descent phase. The analysis is in line with the
proposed GANP KPI08 methodology to determine
additional time in the terminal airspace.
To capture tactical arrival control measures (sequencing, flow integration, speed control, spacing,
stretching, etc.) irrespective of local ATM strategies, a standardized Arrival Sequencing and Metering
Area (ASMA) with a 100 nautical mile radius around each airport was used. To prevent the need for
continuous adjustments to the entry fix and runway pairing, approach sectors were designated for
each airport, allowing for modifications to approach fixes within specified limits. Because of the
multitude of variables at play, it is challenging to pinpoint the direct contribution of the Air Navigation
Service (ANS) toward the additional time within the last 100 nautical miles.
The transit times within the 100 NM ASMA ring are affected by several ATM and non-ATM-related
parameters including, but not limited to, flow management measures (holdings, etc.), airspace
design, airports configuration, aircraft type environmental restrictions, and in Europe, to some extent,
the objectives agreed by the airport scheduling committee when declaring the airport capacity.
The “additional” time is used as a proxy for the level of inefficiency within the last 100 NM. It is defined
as the average additional time beyond the unimpeded transit time computed as the 20
th
percentile of
each approach sector, runway combination and aircraft class combination over the entire analysis
period.
Figure 3-11 shows the evolution of average additional time within the last 100 NM for the U.S. and
Europe at aggregated level between 2018 and mid-2023.
At system level, average additional time within the last 100 NM was higher in Europe before the
pandemic which was to some extent driven by London Heathrow
21
which was a clear outlier in Europe.
Similar to what was observed in the case of other operational performance indicators, there was a
marked enhancement during the period of reduced traffic due to the pandemic, followed by a steady
decline as traffic levels continued to recover.
21
The performance at London Heathrow was consistent with the decision taken during the airport scheduling process
to accept a 10 minute average holding delay to maximise the utilisation of the scarce runway capacity.

COMPARISON OF OPERATIONAL ANS PERFORMANCE 26
U.S. – Europe Comparison of ANS performance (Edition 2023)
Figure 3-11: Additional time within the last 100 NM (aggregated view)
Figure 3-12 shows the additional time within the last 100NM at the main 34 airports in both regions,
including a comparison of the performance vs. 2019.
Figure 3-12: Additional time within the last 100 NM (2022 vs. 2019)
In the U.S., similar to taxi-out performance, there is still a notable difference for the airports in the
greater New York area, which show the highest level of additional time within the last 100 NM. The
New York airspace is highly constrained with the terminal areas of Newark (EWR), New York (JFK),
and La Guardia (LGA) overlapping closely.
In Europe, many of the major airports were still well below the traffic levels of 2019 which positively
influenced performance. London Heathrow shows an average improvement of 3.5 minutes in 2022
compared to 2019.
Additional time within the last 100 NM
(minutes per arrival)
3.0
3.1
2.1
1.9
2.4
2.7
0.0
1.0
2.0
3.0
4.0
JAN
APR
JUL
OCT
JAN
APR
JUL
OCT
JAN
APR
JUL
OCT
JAN
APR
JUL
OCT
JAN
APR
JUL
OCT
JAN
APR
JUL
2018 2019 2020 2021 2022 2023
MAIN 34 AIRPORTS - EUROPE
2.6
2.5
2.2
2.3
2.2
2.4
0.0
1.0
2.0
3.0
4.0
JAN
APR
JUL
OCT
JAN
APR
JUL
OCT
JAN
APR
JUL
OCT
JAN
APR
JUL
OCT
JAN
APR
JUL
OCT
JAN
APR
JUL
2018 2019 2020 2021 2022 2023
MAIN 34 AIRPORTS - U.S. (CONUS)
Additional time within the last 100 NM
(minutes per arrival)
2.4
3.8
3.4
3.2
3.1
3.0
2.9
2.8
2.8
2.7
2.7
2.7
2.4
2.4
2.4
2.4
2.3
2.3
2.3
2.3
2.2
2.2
2.0
2.0
2.0
1.9
1.8
1.8
1.8
1.8
1.8
1.8
1.7
1.7
1.6
0.0 5.0
Europe (main 34)
London (LTN)
London (LGW)
London (LHR)
Dublin (DUB)
Milan (MXP)
Istanbul (IST)
Cologne (CGN)
Lisbon (LIS)
Zurich (ZRH)
Nice (NCE)
Athens (ATH)
Geneva (GVA)
Malaga (AGP)
Madrid (MAD)
Amsterdam (AMS)
Barcelona (BCN)
London (STN)
Warsaw (WAW)
Palma (PMI)
Paris (ORY)
Frankfurt (FRA)
Rome (FCO)
Oslo (OSL)
Dusseldorf (DUS)
Paris (CDG)
Vienna (VIE)
Berlin (BER)
Copenhagen (CPH)
Helsinki (HEL)
Stockholm (ARN)
Brussels (BRU)
Bucharest (OTP)
Hamburg (HAM)
Munich (MUC)
Minutes per arrival
2022
-0.7
1.1
-1.7
-3.5
-1.2
-0.8
0.0
0.5
-1.0
-1.1
-0.1
0.4
-0.4
0.3
-1.6
-1.0
-0.7
-0.4
-1.1
0.2
0.0
-0.4
-1.4
-0.1
-0.9
0.0
-1.2
0.3
0.0
-0.4
-0.4
-0.4
-0.2
-0.7
-1.3
-4.0 -2.0 0.0 2.0
Change
2022 vs 2019
2.2
3.8
3.6
3.6
3.2
3.0
2.9
2.9
2.9
2.8
2.6
2.5
2.4
2.4
2.4
2.2
2.2
2.0
2.0
1.9
1.9
1.9
1.9
1.8
1.8
1.7
1.7
1.6
1.6
1.6
1.6
1.5
1.4
1.3
1.2
0.0 5.0
US (main 34)
Washington (DCA)
New York (JFK)
Philadelphia (PHL)
Newark (EWR)
Chicago (ORD)
Memphis (MEM)
New York (LGA)
Houston (IAH)
Boston (BOS)
Charlotte (CLT)
St. Louis (STL)
Dallas Love (DAL)
Washington (IAD)
Tampa (TPA)
Baltimore (BWI)
Houston (HOU)
Atlanta (ATL)
Dallas (DFW)
Orlando (MCO)
Denver (DEN)
Nashville (BNA)
Miami (MIA)
Phoenix (PHX)
Seattle (SEA)
Minneapolis (MSP)
Portland (PDX)
Chicago (MDW)
Detroit (DTW)
Salt Lake City (SLC)
Las Vegas (LAS)
Los Angeles (LAX)
Ft. Lauderdale (FLL)
San Diego (SAN)
San Francisco (SFO)
Minutes per arrival
2022
-0.3
0.5
0.1
-0.5
0.0
-0.2
-0.4
-0.3
-0.5
-0.3
-0.6
0.1
0.1
0.0
0.0
-0.2
-0.5
-0.2
-0.3
-0.1
-0.3
0.0
0.0
-0.1
-0.8
-0.8
-0.2
-0.4
-1.0
-0.6
-0.2
-0.1
-0.4
-0.3
-0.4
-4.0 -2.0 0.0 2.0
Change
2022 vs 2019

27 COMPARISON OF OPERATIONAL ANS PERFORMANCE
U.S. – Europe Comparison of ANS performance (Edition 2023)
Due to the large number of variables involved, the direct ATM contribution towards the additional
time within the last 100 NM is difficult to determine. One of the main differences of the U.S. air traffic
management system is the ability to maximize airport capacity by taking action in the en-route phase
of flights, such as path stretching to achieve the in-trail spacing required as described in section 1.2.1.
3.4.4.1 Arrival management in the U.S. and in Europe
Both the U.S. and Europe focus on safely optimizing arrival management to reduce congestion,
enhance efficiency, and minimize environmental impacts. However, the specific strategies,
technologies, and regulatory frameworks can differ based on regional characteristics and priorities.
In a constrained environment, ANS must maintain peak throughput as well as manage delay. There is
a trade-off between operational efficiency and airport capacity utilization. For instance, to ensure a
high airport capacity utilization, London Heathrow (LHR) airport accepts a given amount of holding
delay already in their airport scheduling process.
Arrival procedures in Europe vary significantly from airport to airport and recent years have seen a
significant number of changes to approach procedures. However, in Europe, the support of the en-
route function is limited and rarely extends beyond the national boundaries. As a result, most of the
sequencing and holding activities occur at lower altitudes near the respective airports. Any additional
delays that cannot be accommodated in the vicinity of the airport are managed on the ground at
departure airports through the allocation of ATFM departure slots.
Figure 3-13 illustrates how local ATM
strategies affect arrival flows at two
major European airports. Whereas at
London Heathrow most of the approach
operations take place near the airport, at
Paris CDG, the sequencing of arrival
traffic starts already much further out.
To reduce the fuel inefficient time spent
in stacks at lower altitudes, NATS and
partnering ANSPs have implemented a
collaborative ATM procedure called
Cross Border Arrivals Management (XMAN) for flights to London Heathrow airport. It has been
developed within the Single European Sky ATM Research Programme (SESAR).
ATC instructs the pilot to adjust the aircraft’s speed to move some of the anticipated time spent
holding at lower altitudes to more fuel-efficient higher altitudes. This will save fuel and carbon dioxide
(CO
2
) emissions on its approach into London Heathrow.
One of the key questions is therefore what strategy works best for ATM to absorb delay in the most
fuel-efficient manner while ensuring the maximization of scarce runway capacity at any point in time.
Considerable focus is being placed on the role of optimal descent profiles to reduce fuel burn. Vertical
and horizontal inefficiencies on descent are primarily a function of absorbing necessary time to
manage runway capacity constraints. While there are numerous studies published related to the
benefits of optimal descent profiles, most reflect benefits during non-congested periods and focus
only on vertical flight inefficiencies.
Today, the use of speed control already in the cruise phase for the purpose of absorbing terminal area
congestion is limited in both regions. Without an agreed time of arrival, flights usually compete for
runway capacity on a first come first served basis. While in some cases this speeding up may benefit
the individual airline, the tactical competition for runway resources results in additional delay
Figure 3-13: Impact of local ATM strategies on arrival flows

COMPARISON OF OPERATIONAL ANS PERFORMANCE 28
U.S. – Europe Comparison of ANS performance (Edition 2023)
absorption around the arrival airport and the added terminal area congestion increases fuel burn at
system level.
However, ANS management could start well before top of descent to reduce fuel burn. The concept
involves shifting the duration spent at lower altitudes to more fuel-efficient higher altitudes. Any
surplus time consumed during level flight segments is exchanged for an equivalent surplus time at
more fuel-efficient higher altitudes. It's worth noting that long-haul flights hold the greatest potential
for fuel savings by implementing speed control during the cruise phase of the journey.
Both NextGen and SESAR have 4-D trajectories as basic tenets, which would implicitly involve speed
control. ATM has incentives to reduce congestion around terminal areas beyond saving fuel including
reducing the workload associated with merging and spacing, and reducing the safety risk associated
with aircraft considering fuel related diversions to alternate airports.
More work is needed to better address and understand the value of speed control in the cruise phase
for terminal congestion and potential fuel savings with speed control strategies.
3.5 CONCLUSIONS - OPERATIONAL ANS PERFORMANCE
It is important to note that ANS performance varies within both Europe and the U.S. due to factors
such as regional traffic patterns, airport sizes, weather conditions, and investment in infrastructure.
Based on established indicators, the analysis of ATM-related operational performance in this report
aims to quantify and monitor constraints imposed on airspace users through the application of air
traffic flow measures. Particularly, the focus is on the performance of the two ATM systems since the
outbreak of the COVID-19 pandemic in 2020.
Air traffic in both systems was severely affected by the measures put in place to fight the pandemic
but with a notably higher impact in Europe. In comparison to 2019, there was a -33% decrease in traffic
in the United States in 2020, while Europe experienced a more significant drop of -56%. Fast forward
to 2022, traffic in the U.S. still lagged behind 2019 levels by -6.7%, whereas in Europe, traffic (in terms
of IFR flights) remained -16.9% below 2019 levels. The notably steeper decline in Europe can be
attributed to differences in market composition. The U.S. benefits from a large domestic market,
which facilitated a swifter recovery compared to predominantly international flights in Europe.
Additionally, the outbreak of the war in Ukraine in 2022 and the resulting economic downturn in
several European countries further contributed to the challenges faced by the European aviation
sector.
From a passenger point of view, on time performance is generally used as the industry standard to get
a first high level understanding of air transport performance. As traffic declined in early 2020, the
proportion of flights arriving within a 15-minute window of their scheduled arrival time initially
experienced a substantial rise. However, it subsequently began to decline again in both the U.S. and
Europe in accordance with the observed patterns of traffic recovery.
In the U.S., arrival punctuality continuously degraded between 2020 and mid-2023 to a level below
2019 (78.5%). In Europe, arrival punctuality first degraded moderately in 2021 but then dropped to the
worst level on record in summer 2022, mainly driven by staff shortages in all parts of the aviation
industry which made it difficult to accommodate the quickly growing demand in summer.
The more focused analysis of ATM performance by phase of flight compares actual performance to
an unconstrained theoretical optimum, which removes possible influences from time buffers included
by airlines to maintain schedule integrity.
ANS performance on both sides of the Atlantic showed improvements in all stages of flight
immediately following the decline in traffic caused by the pandemic in April 2020. However,

29 COMPARISON OF OPERATIONAL ANS PERFORMANCE
U.S. – Europe Comparison of ANS performance (Edition 2023)
performance began to deteriorate again, in line with the traffic recovery patterns observed in the U.S.
and Europe.
Consistent with the observations made in previous reports, the relative distribution of the ATM-
related inefficiencies by phase of flight reflects the differences in flow management strategies in both
systems. The U.S. and Europe currently use different strategies for absorbing necessary delay in the
various flight phases.
Overall, the differences in ATM related operational service quality between the two systems appear
to originate from different reasons, including, inter alia, regulatory and operational differences,
policies in allocation of airport slots and flow management, as well as different weather patterns.
In Europe, a lot of emphasis is put on strategic planning and a large part of the demand/capacity
management measures are applied months in advance. Unlike in the U.S. where only 3 airports have
schedule limitations, traffic at major European airports is usually already regulated (in terms of
volume and concentration) in the strategic phase through an airport scheduling process. With no or
very limited en-route spacing or metering in Europe, the focus is placed on anticipating demand/
capacity imbalances in en-route centres or at airports and, if necessary, to solve them by delaying
aircraft at the origin airports on the ground (allocation of ATFM take-off slots).
In the U.S., the emphasis is more on the tactical traffic management in the gate-to-gate phase to
maximize system and airport throughput under prevailing conditions on the day of operations. The
approach is supported by the en-route function and less en-route capacity restrictions than in Europe.
As needed, miles in trail (MIT) or minutes in trail (MINIT) are used to apportion traffic into a
manageable flow, as well as to provide space for additional traffic (merging or departing) to enter the
flow of traffic. Resulting delays are normally manifested as delays in the taxi-out phase or at the gate.
Inefficiencies in the various flight phases (airborne versus ground) have a very different impact on
airspace users in terms of fuel burn (engines on versus engines off). For ANS-related delays at the gate
(ATFM/EDCT departure restrictions) the fuel burn is quasi nil
22
while in the gate-to-gate phase (taxi,
en-route, terminal holdings) the impact in terms of additional time, fuel and associated costs is
significant. Hence, the environmental impact of ATM on climate is closely related to operational
inefficiencies in the gate-to-gate phase and associated additional greenhouse gas emissions.
By combining the analyses of the individual phases of flight, an estimate of the theoretical maximum
“improvement pool” actionable by ANS can be derived. It is important to stress again that this “benefit
pool” is based on a theoretical
optimum, which is not
achievable at system level due
to inherent necessary (safety) or
desired (capacity) limitations.
In Europe, average ANS-related
delays experienced at the gate
(ATFM/EDCT) are more than
twice as high as in the U.S.
Flights in Europe are 5 times
more likely to be held at the
gate than in the U.S. because of
22
It is acknowledged that due to the first come, first served principle applied at the arrival airports – in some cases
aircraft operators try to make up for ground delay encountered at the origin airport through increased speed which
in turn may have a negative impact on total fuel burn for the entire flight.
Figure 3-14: Theoretical maximum benefit pool actionable by ATM in the U.S.
and in Europe (2022)
Theoretical maximum benefit pool actionable by ATM (2022)
Avg. min change vs 2019 Avg. min change vs 2019
1.0
6.3
2.3
2.2
11.8
ATFM/EDCT delay
per flight
Add. taxi out time
per departure
Horizonal en-route
flight inefficiency
Terminal area
inefficiency
Benefit pool
-1.0
-0.8
-0.1
-0.3
-2.2
2.2
2.9
2.5
2.4
10.0
-0.2
-0.8
0.1
-0.8
-1.6
U.S. (CONUS)
Europe

COMPARISON OF OPERATIONAL ANS PERFORMANCE 30
U.S. – Europe Comparison of ANS performance (Edition 2023)
en-route capacity constraints. In the U.S. most delays experienced at the gate are related to adverse
weather at airports.
This could be associated with the difference in approach: In Europe, the capacity declaration process
tends to arrange traffic in closer alignment with Instrument Meteorological Conditions (IMC) capacity.
In contrast, in the U.S., where demand levels are regulated by airlines and capacity is managed with
greater flexibility, the ATM system seems to be better equipped to adjust throughput in response to
current conditions, potentially allowing for operation closer to Visual Meteorological Conditions
(VMC) capacity when feasible. The more tactical approach in the U.S. is also visible in the high average
additional taxi-out time which in the U.S. is twice as high as in Europe.
Overall, the total benefit pool in 2022 was higher in the U.S. than in Europe, but with traffic levels in
the U.S. notably closer to pre-pandemic levels.
To get a more complete picture of ATM performance in each region, it is necessary to also consider
capacity utilization in both systems together with the observed “benefit pool”.
Clearly, keeping an aircraft at the gate saves fuel but if it is held and capacity goes unused, the cost to
the airline of the extra delay may by far exceed the savings in fuel cost. More study is needed to
understand the real costs of each strategy.

31 COMPARISON OF ANS COST-EFFICIENCY TRENDS (2011-21)
U.S. – Europe Comparison of ANS performance (Edition 2023)
4 Comparison of ANS cost-efficiency trends (2011-21)
4.1 INTRODUCTION AND BACKGROUND
This analysis is the fourth in a series of factual high-level comparison of ANS cost-efficiency trends
between the U.S. and Europe [6], [7], [2] based on a well-established economic performance
framework. The factual high-level comparison of ANS cost-efficiency between the U.S. and Europe in
this chapter focuses on the continental costs of:
• Air Traffic Management (ATM) and
• Communications, and Navigation and Surveillance (CNS) provision.
It does not address:
• Oceanic ANS,
• services provided to military operational air traffic (OAT), or
• airport landside management operations.
For Europe, results are shown at European and at the SES State level:
• “Europe” corresponds to 36 ANSPs
23
included in the ATM cost-effectiveness (ACE) benchmarking
programme;
• “SES States” refers to the 29 ANSPs of the EU27+2 States
24
which are subject to the SES
performance and charging scheme regulation in the third Reference Period (RP3, 2020-2024) [4].
Figure 4-1: U.S. geographic scope included in the
economic comparison
Figure 4-2: European States included in the economic
comparison
Since 2012, the EU SES performance scheme places a strong emphasis on various aspects, including
performance planning and accountability, the establishment of binding targets (covering Safety,
Cost-Efficiency, Capacity, and Environmental aspects), continuous monitoring, incentives, and
corrective measures, both at the European and national levels. This scheme is closely linked with a
charging regime, which replaced the concept of "full cost recovery" with a system known as
23
While the latest ACE Benchmarking report [9] includes 38 ANSPs, Sakaeronavigacija, the Georgian ANSP, and
BHANSA, the ANSP of Bosnia and Herzegovina, only started to provide data for the years 2015 and 2019
respectively and are therefore excluded from the analysis presented in this Report. See Annex 3 for details.
24
27 National ANSPs (EU27) without Luxembourg, plus Norway, Switzerland, and Maastricht Upper Area Control
Centre (MUAC) operated by EUROCONTROL. See Annex 3 for details.

COMPARISON OF ANS COST-EFFICIENCY TRENDS (2011-21) 32
U.S. – Europe Comparison of ANS performance (Edition 2023)
"determined costs" and introduced risk-sharing mechanisms in conjunction with the setting of
performance targets.
The “U.S.” refers to continental U.S. (CONUS), which includes the 48 connected states and District of
Columbia located on the North American continent south of the border with Canada plus activity for
Alaska, Hawaii, Puerto Rico, and Guam.
Although both figures for the SES States and Europe are shown in the analysis, for sake of simplicity
and clarity only the differences between the U.S. and the SES States are highlighted in the figures and
commented in the text wherever appropriate.
It is important to highlight that there is a fundamental difference in how ATM/CNS provision is funded
in the U.S. and in Europe. Whereas in Europe air navigation services are primarily funded through
specific en-route and terminal ANS charges, in the U.S., the Federal Aviation Administration (FAA) is
primarily funded by excise taxes deposited into the Airport and Airway Trust Fund (AATF) with
additional funding from the General Fund of the U.S. Treasury as necessary. This funding is provided
to the FAA by Congress through annual appropriations laws and supplemental funding laws.
The SES performance scheme is coupled with a charging regime which replaces “full cost recovery”
with a system of “determined costs” set at the same time as the performance targets. These
performance targets are legally binding for EU Member States and are designed to encourage ANSPs
to be more efficient and responsive to traffic demand, while ensuring adequate safety levels. The goal
is to achieve significant and sustainable performance improvements.
Finally, it should be noted that the analysis in this report is not affected by funding differences as it
compares the costs rather than the funding of both systems. However, there may be significant
difference in accounting principles and costing methods so steps have been taken to account for these
or, at least, note them.
4.2 SCOPE, METHODOLOGY AND INFLUENCING FACTORS
4.2.1 SCOPE OF THE ECONOMIC ANALYSIS
The data used in this analysis represent the latest year for which actual financial data are available for
the U.S. and for Europe
25
.
• for Europe and the SES States, costs and operational data are sourced from submissions by
ANSPs to the Performance Review Unit (PRU) for the ACE benchmarking reports [8] [9] [10], [11];
• for the U.S., costs and operational data provided by the FAA-ATO
26
are consistent with the
submission to the CANSO
27
Global Benchmarking Reports [12] which have underlying definitions
of cost items and output metrics in line and consistent with those used in the ACE benchmarking
programme in Europe.
25
The U.S. data refers to financial years whereas for Europe the data refers to calendar years.
26
Only the costs attributable to the U.S. Air Traffic Organization (FAA-ATO), the operational arm of the FAA, were
considered in the comparison. The FAA-ATO continental costs represent around two thirds of the total FAA net
cost of operations for FY 2021 (US$18.0 billion). The other third relates to costs outside the FAA-ATO (such as
airports, certification, aviation research, airspace infrastructure improvements, among other FAA costs that are
not associated with the ATO), but also to FAA-ATO costs falling outside the scope of this study (Oceanic services
and weather).
27
The Civil Air Navigation Services Organization.

33 COMPARISON OF ANS COST-EFFICIENCY TRENDS (2011-21)
U.S. – Europe Comparison of ANS performance (Edition 2023)
To ensure the comparability of ANS cost-efficiency, the analysis in this chapter is undertaken on a
gate-to-gate basis. This approach accounts for differences in cost allocation practices between the
U.S. and Europe in terms of en-route and terminal ANS costs.
To the greatest degree possible, efforts have been made to reach comparability of financial data by
excluding "other" or "unique" costs. A summary of the costs that are included and excluded in the
comparison is provided in Table 4-1 with a more complete breakdown to follow.
Cost type
U.S.
Europe/SES States
ATM/CNS provision costs
✓
✓
Flow management coordination
✓
✓
Cost of capital
n/a
MET costs (internal/external)
R&D (e.g. NextGen, SESAR, etc.)
28
ATC provision to military (OAT)
Regulatory costs
Includes the proportion for
the ATO
Cost for contract towers
✓
29
Flight Services
✓
✓
Table 4-1: Summary of included and excluded costs
Flow management coordination: Costs for the Air Traffic Control System Command Center (ATCSCC)
are included in the U.S. data and similarly the EUROCONTROL Network Manager Operations Centre
(NMOC) costs are included in the overall European data. NMOC costs for the SES States have been
calculated on a pro-rata basis, allocating the overall European NMOC costs between SES States (85%)
and other EUROCONTROL States (15%).
Cost of capital: Due to the differences in the funding process, the cost of capital (interest on debt and
remuneration of equity) is not part of the FAA-ATO cost base. For comparison purposes, the cost of
capital (some 5% of the European costs) has been removed from the European figures.
MET costs: The costs of meteorological services (MET), airport management and related services have
been removed, where possible.
Research & Development: Despite all the efforts to ensure comparability, there are inherent
differences in the cost structures of government entities and privately operated entities which are not
easily quantified or removed. It should be noted that FAA-ATO funded R&D expenditures are
included. However, the FAA is making significant investment into their NextGen program, some of
which is not funded by the FAA-ATO and therefore not included in this report.
Regulatory: While regulatory costs are not included in the European data (e.g. costs of National
Supervisory Authorities or Civil Aviation Authorities), a small portion of the FAA costs includes
regulatory costs, which could not be excluded due to the FAA being a governmental entity. However,
the amount is small and does not significantly impact the overall results of the comparison.
Contract towers: are outsourced services by the FAA. Hence, the staff employed in FAA contract
towers (including more than 1,400 ATCOs) are not represented in the staff or ATCO-hour figures for
FAA-ATO. The total amount of costs related to contract towers (including ATCO employment costs)
is reported under and considered as part of the “support costs” in this report.
28
Excluded if not FAA-ATO funded.
29
The cost of contract towers for 2021 was some 188 million USD (some 155 million EUR).

COMPARISON OF ANS COST-EFFICIENCY TRENDS (2011-21) 34
U.S. – Europe Comparison of ANS performance (Edition 2023)
Flight Services: The cost of flight services is part of the FAA-ATO continental costs; similarly, costs for
Flight Information Services are part of the cost base for European ANSPs.
Where necessary, some minor refinements were made to historic data reported in previous cost-
efficiency comparisons to reflect changes in cost allocation systems and to provide the reader with
the most accurate picture.
4.2.2 METHODOLOGY AND FRAMEWORK
As was the case in the previous comparison reports [6] [7] [2], the analysis draws heavily on the well-
established ATM Cost-Effectiveness (ACE) benchmarking framework [13].
Figure 4-3: Cost-effectiveness analytical framework
Figure 4-3 illustrates the key economic (input/output) metrics that are used for the analysis.
The ATM/CNS provision costs per IFR flight-hour controlled is the key cost-effectiveness indicator,
which reflects the ratio of total ATM/CNS provision costs and the output measured in terms of flight-
hours controlled. For a better understanding of the drivers, it is further broken down into:
• Air Traffic Controller (ATCO) in OPS employment costs
30
per unit of output (itself broken
down into ATCO-hour productivity and ATCO employment costs per ATCO in OPS); and
• Support costs per unit of output is the ratio of support costs (defined as ATM/CNS provision
costs other than ATCO in OPS employment costs) to IFR flight-hour. Typically, these include
support staff employment costs, operating costs and depreciation/amortization. For FAA-
ATO, the support costs also include some operational staff engaged in ATC activities (i.e.
traffic management coordinators, controllers, inflight services, developmentals and CPC-IT,
ATCOs in contract towers, Oceanic ATCOs as detailed in section 4.2.1).
30
Only full time certified ATCOs were considered in the specific ATCO in OPS employment costs. Employment costs
for developmental controllers, controllers in training (CPC-IT) and contract tower controllers were included in
support costs. This distinction is made to facilitate international comparisons and differs from total controller
counts reported in the FAA controller workforce plan [23] which includes developmental controllers and controllers
in training as part of the total count.
Total IFR flight-hours
controlled
Total ATCO in OPS
hours on duty
Total employment
costs for ATCOs in OPS
Total support costs
Total ATM/CNS
provision costs
ATCO in OPS hour
productivity
Total ATCO in OPS
employment cost
per flight-hour
Total support cost
per flight-hour
Total ATCO in OPS
employment cost
per ATCO-hour
ATM/CNS provision
cost per flight-hour
Data inputs
Key performance
indicators (KPIs)
Total ATCOs in OPS
Total ATCO in OPS
employment cost
per ATCO in OPS
Legend:
EUROCONTROL / AIU

35 COMPARISON OF ANS COST-EFFICIENCY TRENDS (2011-21)
U.S. – Europe Comparison of ANS performance (Edition 2023)
4.2.3 CURRENCY EXCHANGE AND INFLATION EFFECTS
All cost figures in this chapter are expressed in 2021 real terms, i.e. the nominal cost series were
deflated using the respective Consumer Price Index (CPI) deflators for the FAA-ATO and the European
ANSPs. To enable cost-efficiency comparisons between the U.S. and Europe, there is a need to
convert the costs to a common currency. This can be done by one of two ways:
• using currency exchange rates; or
• by means of an artificial currency.
The latter—Purchasing Power Standards (PPS) through the means of Purchasing Power Parities
(PPPs) is used and refers to the units needed to purchase a defined basket of consumer goods in each
country. More details on the methodology and data used are provided in Annex 4.
The PPS method equalises the purchasing power of two currencies by taking the relative cost of living
into account. Depending on the analysis, using PPS can make international comparisons more valid,
particularly when directly comparing some cost categories, such as staff costs.
Using the annual currency exchange rates would introduce a bias because of the fluctuations over
time (see Figure 4-4). All else equal, the appreciation of the USD would increase the U.S. ANS costs,
when expressed in Euro, and therefore narrow the observed gap. Accordingly, the depreciation of the
USD would widen the cost-efficiency gap.
To minimise the effects of
currency exchange rate
fluctuations in the time
series analysis, the 2011-
2021 average exchange
rate $1.21: €1 consistently
to the entire (deflated)
cost series for the U.S was
applied.
31
The analysis in this report
was therefore carried out
primarily using the
USD/Euro exchange rate
methodology with some
supplemental PPS charts
(based on EUROSTAT
data) and the results are
shown and described as considered most appropriate for the respective section.
Accordingly, a PPP exchange rate of 1.40 was used for the U.S. to express figures in PPS,
corresponding to the 2011-2021 average PPP exchange rate, which reflects the fact that for every unit
spent in the EU27 Area it takes 1.40 to obtain the same unit in the U.S.
31
The treatment of financial figures for European ANSPs is explained in detail in Annex 4 of the ACE Benchmarking
report (May 2023 edition) [9].
Figure 4-4: Time series of the €/US$ exchange rate
1.0
1.1
1.2
1.3
1.4
1.5
1.6
Exchange rate 1 EURO =
€/US$ exchange rate (2011-2021)
Monthly avg. Annual avg. Average (2011-2021)
Source: EUROSTAT
1.21 €/US$

COMPARISON OF ANS COST-EFFICIENCY TRENDS (2011-21) 36
U.S. – Europe Comparison of ANS performance (Edition 2023)
4.3 LONG-TERM OVERVIEW
In aviation, a range of outputs are measured to describe performance (flights, passenger, tonne-
kilometre revenue, available seat km, etc.). For the analysis in this chapter, the instrument flight rules
(IFR) flight-hours controlled are used as they are closely associated with the work provided by ATCOs.
While relevant for the air transport system in general, the use of other output measures such as
passenger kilometres might be misleading in the ANS context as larger aircraft would automatically
improve ANS performance.
Figure 4‑3 shows the evolution of IFR flight-hours controlled in the U.S. and in Europe between 2006
and 2021 with the effects of the economic crisis starting in 2008 and the impact of the COVID-19
pandemic is clearly visible on both sides of the Atlantic.
Figure 4-5: Long term trends in IFR flight-hours controlled
In the SES States, the reduced demand for air transport following the fallout of the global financial
crisis in 2008 resulted in a -6.9% reduction in flight-hours. While it took six years for the traffic to
recover to pre-crisis levels (in 2015), the traffic continued to grow rapidly reaching the highest levels
ever recorded in Europe in 2019 (some +27% higher than that in 2006 for SES States). While the U.S.
controls significantly more flight-hours than the SES States (1.5 to 2.5 times more depending on the
year), the robust traffic growth experienced in Europe as of 2013 significantly reduced the gap (from
138% in 2006 to 84% in 2019).
Traffic levels dropped dramatically on both sides of the Atlantic with the outbreak of the pandemic in
2020. The number of flight-hours in the SES States reduced considerably (-56.8%) following the
implementation of lockdowns and other measures primarily targeting the cross-border movement of
people between States. While the U.S. also implemented international and state travel restrictions to
mitigate the spread of COVID-19, the reduction in flight-hours was less than half of that experienced
by the SES States and rebounded faster in the U.S, which is discussed further in Section 4.3.
Figure 4-6 shows the trend in total ATM/CNS provision costs in real terms for the U.S. FAA-ATO and
Europe between 2006 and 2021.
40
60
80
100
120
140
160
2006
2007
2008
2009
2010
2011
2012
2013
2014
2015
2016
2017
2018
2019
2020
2021
Index: 2006 = 100
IFR flight-hours controlled
(Index: 2006 = 100)
U.S. FAA-ATO SES (RP3) Europe (36)
-9.0%
-6.9%
-6.5%
COVID-19
-25.2%
-57.1%
-56.8%
Global
financial crisis
8.7%
22.3%
19.3%
2019 vs. 2011 (%)
-1.6%
32.0%
27.1%
U.S. FAA-ATO
Europe (36)
SES (RP3)
2019 vs. 2006 (%)
-19.9%
-45.1%
-44.6%
2021 vs. 2019 (%)

37 COMPARISON OF ANS COST-EFFICIENCY TRENDS (2011-21)
U.S. – Europe Comparison of ANS performance (Edition 2023)
Figure 4-6: Long term trends in total ATM/CNS provision costs
Between 2006 and 2019, total ATM/CNS costs decreased by -3.1% in the U.S. while they increased by
+4.8% in the SES States (+6.8% for Europe) during the same period. At the same time, flight-hours
controlled decreased by -1.6% in the U.S. while for SES States they increased by +27% (2019 vs. 2006).
The increase in FAA-ATO total ATM/CNS provision cost between 2007 and 2010 is mostly attributable
to the increased purchasing associated with NextGen
39
(part of the FAA-ATO support cost category in
this report). The decrease in FAA-ATO provision costs between 2011 to 2021 is also driven by the
reduction in support costs, which are discussed in detail in section 4.3.
For the SES ANSPs the total provision costs grew by +4.8% between 2006 and 2019 with the notable
reduction in the cost base following the financial crisis between 2009 and 2010 predominantly driven
by cost containment measures implemented by European ANSPs in response to the lower traffic
volumes following the economic downturn. Despite the significant growth in traffic from 2011 to 2019
(+19.3%), the costs in SES ANSPs saw only a marginal increase (+2.1%). This can be attributed in part
to the introduction of the SES Performance Scheme, which imposed cost-efficiency targets that
exerted pressure on costs through legal obligations within the framework.
Considering the different cycles affecting aviation industry on both sides of the Atlantic, the long-
term analysis over the period starting in 2006 offers limited value. For this reason, the 10-year period
(2011-2021) is considered for the analysis of cost-efficiency performance of the two systems. To that
end, it is recalled that the year 2012 marks the start of the Single European Sky (SES) performance
scheme in Europe while in the U.S. the FAA Modernization and Reform Act was passed by Congress
in the same year. Both initiatives are expected to have a bearing on cost-efficiency performance.
Due to the magnitude of disruption by COVID-19 pandemic from 2020 onward in both systems, it is
difficult to compare performance in 2011 to that in 2021. Therefore, to better capture the distinct
cycles observed in the performance of air navigation service providers in the SES States and the FAA-
ATO as well as to gain a deeper understanding of the pandemic's impact on the two systems the
analysis of the main key performance indicators is divided into two separate periods: (1) 2011-2019
and (2) 2019-2021 throughout this chapter.
85
90
95
100
105
110
115
2006
2007
2008
2009
2010
2011
2012
2013
2014
2015
2016
2017
2018
2019
2020
2021
Index: 2006 = 100
Total ATM/CNS provision costs (in € 2021)
(Index: 2006 = 100)
U.S. FAA-ATO SES (RP3) Europe (36)
COVID-19
Global financial crisis
2021 inflation adjusted and converted to Euro
-11.2%
4.0%
2.1%
2019 vs. 2011 (%)
-3.1%
6.8%
4.8%
U.S. FAA-ATO
Europe (36)
SES (RP3)
2019 vs. 2006 (%)
-1.8%
-8.3%
-7.0%
2021 vs. 2019 (%)

COMPARISON OF ANS COST-EFFICIENCY TRENDS (2011-21) 38
U.S. – Europe Comparison of ANS performance (Edition 2023)
4.4 COMPARISON OF ANS COST-EFFICIENCY & PRODUCTIVITY
Figure 4-7 shows a high-level comparison of the total ATM/CNS provision costs in the U.S. and in
Europe in 2021. As described in section 4.2.3, for FAA-ATO, the total costs of €9.7 billion are based on
the conversion of an amount of US$ 11.8 billion to Euro using the average 2011-2021 exchange rate of
US$1.21: €1. In 2021, total ATM/CNS provision costs in the U.S. were 47% higher than in SES States
(27% vs. Europe), but the U.S. controlled +166% (+115% vs. Europe) more IFR flight-hours.
Figure 4-7: Breakdown of ATM/CNS provision costs (€2021)
This data was collected and combined under several different accounting structures that make
different assumptions and run under different principles. Some of the differences in accounting
practices between the U.S. and Europe include:
• FAA-ATO follows U.S. Generally Accepted Accounting Principles (GAAP) based upon the Federal
Accounting Standards Advisory Board (FASAB),
32
while European ANSPs use either International
Financial Reporting Standards (IFRS) or local GAAP, which, while similar in principle, differ in
terms of accounting of development costs (expensed under GAAP and capitalised under IFRS)
and recording of fixed asset values (historical cost under both GAAP and IFRS, but companies are
allowed to revalue at fair market price under IFRS).
• genuine differences in the accounting treatment of depreciation: FAA depreciation expenses are
calculated using the straight-line method, as in Europe, but different depreciation periods and
capitalization amount thresholds may be applied in the U.S. versus in Europe.
As already indicated previously, the financial data used in this chapter is collected from different
organisations using different accounting and reporting methodologies. These inherent differences
are discussed in more detail throughout the chapter as notable discrepancies arise.
4.4.1 UNIT ATM/CNS PROVISION COSTS
Figure 4-8 shows the evolution of the total ATM/CNS provision costs per IFR flight-hour controlled in
the U.S. and in Europe.
The unit ATM/CNS provision costs for the SES States reduced almost continuously (except for a slight
increase in 2012) over the entire 2011-2019 period at an annualised rate of -1.9% per annum. This
significant cost-efficiency improvement was achieved by maintaining the costs relatively stable
(+0.3% p.a.) in the context of significant traffic growth (+2.2% p.a.). This should be seen in the context
of the implementation of SES Performance Scheme and the incentive mechanism embedded in the
charging scheme which contributed to maintaining a downward pressure on costs during the
regulatory Refence Periods (RP1 covering 2012-14 and RP2 covering 2015-19).
The U.S. provision costs per flight-hour were consistently below those in Europe and the SES States
between 2011 and 2021. For example, they were 21% lower in 2011, 24% lower in 2019, and 45% lower
in 2021 than SES. Between 2011 and 2019, U.S. unit ATM/CNS provision costs reduced continuously
32
Federal Accounting Standards Advisory Board, Handbook of Accounting Standards and Other Pronouncements
(FASAB Handbook), as Amended
Total ATM/CNS provision
costs (in M€2021)
U.S. FAA-
ATO
EUROPE
(36 ANSPs)
SES (RP3)
U.S. vs
Europe
U.S. vs SES
(RP3)
2021 IFR flight-hours controlled 20.4 M 9.5 M 7.6 M +115% +166%
Employment costs for ATCO in OPS 2,214€ 2,495€ 2,161€ -11% +2%
Total support costs 7,532€ 5,198€ 4,480€ +45% +68%
Total costs 9,746€ 7,693€ 6,641€ +27% +47%
2021 inflation adjusted and converted to Euro

39 COMPARISON OF ANS COST-EFFICIENCY TRENDS (2011-21)
U.S. – Europe Comparison of ANS performance (Edition 2023)
(-2.5% p.a.), reflecting a combination of significant reduction in ATM/CNS provision costs (-1.5% p.a.)
and an increase in IFR flight-hours controlled (+1.1% p.a.). As a result, the gap between the unit cost
indicator for SES States and the U.S. increased slightly over this period.
Figure 4-8: Trends in unit ATM/CNS provision costs (2011-2021)
The FAA-ATO handles about twice as many flight-hours as Europe. This factors into the increase of
unit costs in 2020, which was not as significant for the U.S. when compared to Europe, mainly due to
the lower traffic reduction (-25.2%), and a faster recovery of the U.S. domestic market, reaching
around 80% of the 2019 traffic level at the end of April 2021. As already discussed in Chapter 2 of this
report, the U.S. has a larger share of domestic flights in proportion to total flights while Europe has a
greater share of international flights as a proportion of total flights.
Following the outbreak of the COVID-19 pandemic, the unit costs in the SES States nearly doubled in
2020. While European ANSPs’ did enact stringent cost-containment measures in 2020, they resulted
in a -3.0% reduction to ATM/CNS provision costs which was not sufficient to compensate for the -
56.8% reduction in traffic over the same period. It should also be recognised that some of these
measures have a lagging effect (e.g. delay between the implementation of redundancy scheme and
departure of staff) or, in some cases, entail higher up-front costs (e.g. redundancy packages)
negatively affecting the cost-base in the short term but bringing significant savings in the medium
and long terms.
4.4.2 SUPPORT COSTS & STAFF
Total support costs (defined as total ATM/CNS provision costs other than ATCO in OPS employment
costs) in the U.S. accounted for around 77.3% of the total ATM/CNS provision costs in 2021, whereas
in the SES States the relative share was almost 10% lower (67.5% in 2021).
Employment costs of support staff (defined as staff other than ATCOs in OPS) constitute a significant
portion of support costs. However, for FAA-ATO, support staff costs also include those for operational
staff that control air traffic but are not fully certified yet, i.e. developmental ATCOs in training and
Certified Professional Controllers in Training (CPC-ITs) that transferred from another facility.
Additionally, contracted ATCOs in OPS working in small contract towers are also included in support
costs but are not reflected in support staff figures.
200
400
600
800
1 000
1 200
2011 2012 2013 2014 2015 2016 2017 2018 2019 2020 2021
€ 2021 per flight
-hour
Total ATM/CNS provision costs per IFR flight-hour controlled (in € 2021)
(% difference corresponds to U.S. vs SES)
U.S. FAA-ATO SES (RP3) Europe (36)
21%
lower
24%
lower
45%
lower
2021 inflation adjusted and converted to Euro
22.6%
67.1%
67.9%
2021 vs. 2019 (%)
-18.4%
-15.0%
-14.4%
U.S. FAA-ATO
Europe (36)
SES (RP3)
2019 vs. 2011 (%)

COMPARISON OF ANS COST-EFFICIENCY TRENDS (2011-21) 40
U.S. – Europe Comparison of ANS performance (Edition 2023)
Figure 4-9: Trends in total support costs (2011-2021)
As shown in Figure 4-9, total support costs in the SES States remained relatively stable (-1.0%)
between 2011 and 2019. On the other hand, for the FAA-ATO, the trend of reducing support costs
between 2011 and 2015 are primarily driven by several factors:
• changes in the accounting treatment for purchasing and expensing equipment instead of
capitalised and depreciated and lower cost from asset disposal.
• decrease in the FAA budget controlled by the U.S. Congress, savings in several areas and the
allocation of expenses based on the reorganisation of FAA lines of business.
The stringent cost-containment measures implemented by the European ANSPs following the
COVID-19 pandemic resulted in a steep reduction of support costs between 2019 and 2021 (-4.0%)
primarily achieved through savings in support staff costs. Similarly, the support costs for the FAA-
ATO also reduced (-2.1%) over the same period.
Figure 4-10 shows the trends in ATCOs in OPS and support staff as well as the breakdown of these
two staff categories for 2021 in Full Time Equivalents (FTEs). It shows that in 2021 the FAA-ATO
employed some -10% less ATCOs in OPS and some -21% less support staff than the SES States, while
controlling more than double the traffic.
Figure 4-10: Trends in ATCOs in OPS and support staff (2011-2021)
75
80
85
90
95
100
105
2011 2012 2013 2014 2015 2016 2017 2018 2019 2020 2021
Index: 2011 = 100
Total support costs (in € 2021)
(Index: 2011 = 100)
U.S. FAA-ATO SES (RP3) Europe (36)
2021 inflation adjusted and converted to Euro
-2.1%
-6.9%
-4.0%
2021 vs. 2019 (%)
-12.9%
1.5%
-1.0%
U.S. FAA-ATO
Europe (36)
SES (RP3)
2019 vs. 2011 (%)
80
90
100
110
120
130
2011
2013
2015
2017
2019
2021
SES States (RP3)
ATCOs in OPS Support staff
Trends in ATCOs in OPS and support staff (in FTEs)
(Index: 2011 = 100)
80
90
100
110
120
130
2011
2013
2015
2017
2019
2021
U.S. FAA-ATO
2011
2013
2015
2017
2019
2021
Europe (36 ANSPs)
11,784
19,897
2021 FTEs
16,552
34,393
2021 FTEs
13,125
25,184
2021 FTEs

41 COMPARISON OF ANS COST-EFFICIENCY TRENDS (2011-21)
U.S. – Europe Comparison of ANS performance (Edition 2023)
Between 2011 and 2019 the number of support staff employed in the SES ANSPs remained relatively
unchanged with two opposite trends observed during this period: a continuous reduction in support
staff until 2016 and intake of additional support staff between 2016 and 2019, which coincides with
the rapid traffic growth experienced by the SES States over this period.
The reduction of support staff for FAA-ATO between 2011 and 2014 is due mainly to the ATO
reorganization, which is consistent with the decrease in support costs during the same time period.
Between 2012 and 2019, FAA-ATO saw a reduction in the total number of ATCOs which is further
discussed in section 4.3.3. While in training, developmental ATCOs in OPS control a portion of traffic;
however, to allow for consistency in reporting and comparison, they are not counted as ATCOs in
OPS, but rather as support staff until they become fully certified.
Unit support costs (defined as all ATM/CNS provision costs other than ATCO in OPS employment
costs per IFR flight-hour controlled) followed a similar pattern as observed for unit ATM/CNS provision
costs between 2011 and 2021 (see Figure 4-8).
Figure 4-11: Trends in unit support costs (2011-2021)
Unit support costs decreased almost continuously between 2011 and 2019 for both the FAA-ATO and
the SES States (-19.9% and -17.0% respectively over the period) with the gap remaining relatively
stable. Following the COVID-19 pandemic, the unit support costs increased substantially on both sides
of the Atlantic, with the unit support cost increase of +22.2% for the FAA-ATO between 2019 and 2021
and +73.4% for the SES States. As a result, the gap in unit support costs between the U.S. and the SES
States increased more than seven-fold from 29.4 Euro per flight-hour in 2011 to 215.8 Euro in 2021.
4.4.3 ATCO-HOUR PRODUCTIVITY
Figure 4-12 shows the trends in ATCO-hour productivity, expressed as total IFR flight-hour controlled
per total ATCO in OPS hours on duty. In the case of FAA-ATO, the total ATCO in OPS hours on duty
is a product of the average annual hours on duty per ATCO and the total number of Continental ATCOs
in OPS. There are notable differences in working arrangements between the U.S. and Europe (annual
150
250
350
450
550
650
750
850
2011 2012 2013 2014 2015 2016 2017 2018 2019 2020 2021
€ 2021 per flight
-hour
Total support costs per IFR flight-hour controlled (in € 2021)
(% difference corresponds to U.S. vs SES)
U.S. FAA-ATO SES (RP3) Europe (36)
7%
lower
10%
lower
37%
lower
COVID-19
22.2%
69.7%
73.4%
2021 vs. 2019 (%)
-19.9%
-17.0%
-17.0%
U.S. FAA-ATO
Europe (36)
SES (RP3)
2019 vs. 2011 (%)
2021 inflation adjusted and converted to Euro

COMPARISON OF ANS COST-EFFICIENCY TRENDS (2011-21) 42
U.S. – Europe Comparison of ANS performance (Edition 2023)
leave, etc.) impacting on the analysis. In 2021, the average annual hours on duty per ATCO in OPS in
the U.S. (1,447 hours
33
) were some 18% higher than in SES States (1,221 hours).
Figure 4-12: Trends in ATCO-hour productivity (2011-2021)
From 2011 to 2021, the output per ATCO-hour has been significantly higher in the U.S., and, while the
productivity gap between the U.S. and the SES States was gradually closing until 2015, the significant
productivity gains for FAA-ATO between 2015 and 2019 reversed this trend and resulted in an increase
of the gap from 56% at the beginning of the period to 63% in 2019.
For FAA-ATO, this significant improvement in ATCO-hour productivity results from the decline in the
number of ATCOs, as discussed in Section 4.4.2 (see also Figure 4-10). Meanwhile, the average annual
ATCO in OPS hours on duty (not shown as its own data component) remained consistent between
2011 and 2019.
In Europe, the level of overall productivity may also be influenced by the level of fragmentation with,
on average, smaller and more numerous en-route facilities which require more handovers and
interactions, as explained in Section 1.2.
As a result of the COVID-19 pandemic, the ATCO productivity indicator in the SES States dropped
much more than in the U.S., partly because of the much greater traffic reduction in Europe. As a result,
in 2021 the FAA-ATO ATCOs controlled almost 2.5 times more flight-hours per working hour than
their counterparts in SES States (1.19 vs. 0.48 flight-hours per ATCO-hour on duty).
Figure 4-13 provides a breakdown of the various components affecting the ATCO-hour productivity
indicator. It shows the evolution of flight-hours controlled, ATCOs in OPS and total ATCOs in OPS
hours on duty between 2011 and 2021.
33
Average annual working hours reported by the FAA-ATO represent actual hours worked including time worked
outside of the scheduled shift, minus leave, as collected through Labour Distribution Reporting. This number also
does not include the hours on duty worked by the “developmental” controllers or controllers working in Contract
Towers. It is also understood that this number includes some time spent on activities outside of the OPS room. This
differs from the definition used in Europe, which only considers hours spent on active duty (incl. mandatory breaks).
0.2
0.4
0.6
0.8
1.0
1.2
1.4
2011 2012 2013 2014 2015 2016 2017 2018 2019 2020 2021
Flight
-hours per ATCO in OPS hour on duty
IFR flight-hours controlled per ATCO in OPS hour on duty
(% difference corresponds to U.S. vs SES)
U.S. FAA-ATO SES (RP3) Europe (36)
150%
higher
63%
higher
56%
higher
COVID-19
-4.5%
-38.0%
-37.8%
2021 vs. 2019 (%)
25.7%
21.5%
20.1%
U.S. FAA-ATO
Europe (36)
SES (RP3)
2019 vs. 2011 (%)

43 COMPARISON OF ANS COST-EFFICIENCY TRENDS (2011-21)
U.S. – Europe Comparison of ANS performance (Edition 2023)
Figure 4-13: Trends in components of ATCO-hour productivity (2011-2021)
Figure 4-13 shows that for the SES States, the continuous ATCO-hour productivity gains over 2011-
2019 period were achieved by maintaining the total ATCO-hours on duty mostly stable in the context
of significant traffic increase. At the same time, the number of ATCOs in OPS also remained
comparatively stable.
The sudden drop in traffic levels in 2020 as well as implementation of exceptional COVID-19-related
measures affecting the operations of many of the European ANSPs were also reflected in the working
arrangements for the European ATCOs in OPS. The re-allocation of ATCOs to non-OPS duties,
reductions in overtime (in ANSPs which recorded overtime) as well as changes in sectorisation and
rostering to adapt to considerably lower traffic resulted in a -11.7% reduction in total ATCO-hours on
duty for SES States.
For the FAA-ATO, the number of total ATCOs in OPS hours on duty declined almost continuously
between 2012 and 2019. The decrease between 2015 and 2018 for the FAA-ATO is driven by ATCO in
OPS hiring challenges between 2013 and 2015. With an approximately two-year training time to
certify as an ATCO, this impacted the hiring and training pipeline through 2018.
During 2020 and 2021, to enhance the health and safety of its workforce and maintain the resiliency
of the ATC system, the FAA-ATO temporarily adjusted the operating hours of approximately 100 air
traffic control towers nationwide and created segregated teams of controllers to curtail the possibility
of cross-exposure to COVID-19 caused by normal shift rotations. The slight reduction of the ATCO in
OPS in 2021 is a result of attrition, delay in certification of ATCOs, and a reduction of hiring due to
COVID-19.
4.4.4 ATCO IN OPS EMPLOYMENT COSTS
As already indicated in section 4.2.3, it is important to account for the differences in purchasing power
between the comparators when directly comparing employment costs in international comparisons.
The top part of the figures is expressed in 2021 real terms and in Euros while the bottom part shows
the same metric expressed in PPS.
Figure 4-14 shows the evolution of the ATCO employment costs
34
per ATCO in OPS between 2011 and
2021. After the slight reduction recorded in 2012 and 2013 (-2.1% and -0.5% respectively), the ATCO
employment costs per ATCO in the SES States grew continuously between 2013 and 2019 (+1.5% p.a.)
primarily owing to upward pressure on salaries experienced by several Central and Eastern European
countries following their accession to the EU. The immediate pressures on the costs of European
34
The employment costs include gross wages and salaries (including payments for overtime), social security scheme
contributions, pension contributions and other benefits.
40
60
80
100
120
140
2011
2013
2015
2017
2019
2021
SES States (RP3)
IFR flight-hours controlled Total ATCOs in OPS (in FTEs) Total ATCO in OPS hours on duty in OPS
Trends in components of ATCO-hour productivity indicator
(Index: 2011 = 100)
40
60
80
100
120
140
2011
2013
2015
2017
2019
2021
U.S. FAA-ATO
2011
2013
2015
2017
2019
2021
Europe (36 ANSPs)

COMPARISON OF ANS COST-EFFICIENCY TRENDS (2011-21) 44
U.S. – Europe Comparison of ANS performance (Edition 2023)
ANSPs following COVID-19
pandemic reversed the trend and
resulted in a sharp reduction in
unit ATCO costs (-9.1% between
2019 and 2021).
For the FAA-ATO, the ATCO
employment costs per ATCO in
OPS grew constantly between
2011 and 2016 (+2.0% p.a.), with
most notable increases observed
in 2015 and 2016 which reflect an
increase in premium pay (e.g.
overtime, cash awards, etc.). The
unit ATCO employment costs
remained mostly flat throughout
the rest of the period until 2021.
The number of ATCOs in OPS in
the FAA-ATO decreased
by -11.2% between 2011 and
2021.
When expressed in Euros, ATCO
employment costs per ATCO in
the U.S. consistently exceeded
those in the SES States from
2011 to 2021, with the gap
widening from around 4% in
2011 to 14% in 2021. However,
when expressed in PPS, the gap
between the SES States and the
U.S. shows an inverse trend,
indicating that, when factoring in
the cost of living, unit ATCO
costs are generally comparable.
For SES States, pre-COVID-19
period saw continuous growth in
ATCO employment costs per
ATCO in OPS hour on duty
reflecting growth in ATCO
employment costs in the context
of relatively stable hours on duty.
Considering differences in
average working hours per ATCO
indicated in section 4.4.3, the
U.S. has notably lower ATCO
employment costs per ATCO-
hour than the SES States.
Figure 4-14: Total ATCO employment costs per ATCO in OPS, in ‘000 €2021
and in PPS (2011-2021)
130
140
150
160
170
180
190
200
2011 2012 2013 2014 2015 2016 2017 2018 2019 2020 2021
Total ATCO employment cost per ATCO in OPS
('000 in € 20
21)
Total ATCO employment cost per ATCO in OPS
(2021 inflation adjusted and converted to Euro)
U.S. FAA-ATO SES (RP3) Europe (36)
4% higher
5%
higher
14%
higher
COVID-19
Expressed in € 2021
(% difference
corresponds
to U.S. vs SES)
-0.8%
-8.7%
-9.1%
2021 vs. 2019 (%)
6.7%
4.3%
6.6%
U.S. FAA-ATO
Europe (36)
SES (RP3)
2019 vs. 2011 (%)
130
140
150
160
170
180
190
200
2011 2012 2013 2014 2015 2016 2017 2018 2019 2020 2021
Total ATCO employment cost per
ATCO in OPS ('000 in PPS)
U.S. FAA-ATO SES (RP3) Europe (36)
9% lower
10%
lower
1%
lower
COVID-19
Expressed in purchasing power standard (PPS)
Figure 4-15: ATCO in OPS employment costs per ATCO-hour on duty, in
€2021 and in PPS (2011-2021)
80
90
100
110
120
130
140
150
2011 2012 2013 2014 2015 2016 2017 2018 2019 2020 2021
ATCO employment cost per ATCO in OPS
-
hour on duty (in PPS)
U.S. FAA-ATO SES (RP3) Europe (36)
30%
lower
31%
lower
16%
lower
COVID-19
Expressed in purchasing power standard (PPS)
80
90
100
110
120
130
140
150
2011 2012 2013 2014 2015 2016 2017 2018 2019 2020 2021
ATCO employment cost per ATCO in OPS
-hour
on duty (in €20
21)
ATCO in OPS employment cost per ATCO-hour on duty
(2021 inflation adjusted and converted to Euro)
U.S. FAA-ATO SES (RP3) Europe (36)
20%
lower
20%
lower
4%
lower
COVID-19
18.2%
0.4%
-1.9%
2021 vs. 2019 (%)
9.7%
8.4%
9.3%
U.S. FAA-ATO
Europe (36)
SES (RP3)
2019 vs. 2011 (%)
(% difference corresponds
to U.S. vs SES)
Expressed in € 2021

45 COMPARISON OF ANS COST-EFFICIENCY TRENDS (2011-21)
U.S. – Europe Comparison of ANS performance (Edition 2023)
However, when accounting for purchasing power, this gap widens even further, increasing from 4%
in Euros to 16% in PPS in 2021.
When combining the ATCO
employment costs and the
output in terms of controlled
flight-hours (see analytical
framework in Figure 4-3), the
resulting ATCO in OPS
employment costs per flight-
hour were 49% and 51% lower in
the U.S. than in the SES States in
2011 and 2019 respectively when
expressed in Euros (Figure 4-16).
This reflects the significantly
higher productivity in the U.S.
(see Figure 4-12), whereby each
U.S. ATCO handles almost
double the flight-hours than their
average European counterparts,
while the employment costs per
ATCO in OPS are only about
+14% higher than in the SES
States (Figure 4-14).
This gap becomes even wider
when also considering the
differences in the cost of living
(from 62% in Euro to 67% in PPS
in 2021).
4.5 CONCLUSIONS - ANS COST-EFFICIENCY COMPARISON
The U.S. is a realistic comparator for the European ANS system when considering the airspace
characteristics and corresponding traffic volumes. Despite many similarities, it is worth highlighting
that there are different regulatory, economic, social, and operational environments which may affect
performance.
To ensure comparability and consistency over time, the analyses of the cost-efficiency trends are
based on key metrics from the well-established performance framework developed in Europe as part
of the ACE benchmarking project
35
.
Considering the significant disruption caused by the COVID-19 pandemic in aviation on both sides of
the Atlantic from 2020 onward, conducting a long-term analysis of cost-efficiency trends spanning
the entire period from 2011 to 2021 offers limited value. Instead, to more accurately capture the
distinct cycles observed in the SES States and the FAA-ATO and to gain a deeper understanding of
the pandemic's impact on the two systems, the analysis was divided into two separate periods: (1)
2011-2019 and (2) 2019-2021.
35
More information on the ACE project is available online: https://ansperformance.eu/economics/ace-overview/
Figure 4-16: ATCO employment costs per flight-hour, in €2021 and in PPS
(2011-2021)
-
100
200
300
400
2011 2012 2013 2014 2015 2016 2017 2018 2019 2020 2021
ATCO in OPS employment cost per
flight
-hour controlled (in PPS)
U.S. FAA-ATO SES (RP3) Europe (36)
55%
lower
58%
lower
67%
lower
COVID-19
Expressed in purchasing power standard (PPS)
-
100
200
300
400
2011 2012 2013 2014 2015 2016 2017 2018 2019 2020 2021
ATCO in OPS employment cost per flight
-hour
controlled (in €20
21)
ATCO in OPS employment cost per flight-hour controlled
(2021 inflation adjusted and converted to Euro)
U.S. FAA-ATO SES (RP3) Europe (36)
49%
lower
51%
lower
62%
lower
COVID-19
Expressed in € 2021
23.7%
61.8%
57.7%
2021 vs. 2019 (%)
-12.7%
-10.7%
-9.0%
U.S. FAA-ATO
Europe (36)
SES (RP3)
2019 vs. 2011 (%)
(% difference corresponds
to U.S. vs SES)

COMPARISON OF ANS COST-EFFICIENCY TRENDS (2011-21) 46
U.S. – Europe Comparison of ANS performance (Edition 2023)
The year 2012 marks the start of the Single European Sky (SES) performance scheme in Europe while
in the U.S. the FAA Modernization and Reform Act of 2012 was signed into law. Both initiatives are
expected to have a bearing on cost-efficiency performance in the first analysis period (2011-19).
The impact of the COVID-19 crisis on both systems is then analysed by comparing 2021 to the pre-
crisis results in 2019.
Evolution of cost-efficiency drivers
Figure 4-17 shows the trends in the main components of the cost-efficiency KPI for the U.S. FAA-ATO
(orange) and the European States subject to the third reference period of the SES performance
scheme (blue). Furthermore, the main drivers affecting the changes in the unit ATM/CNS provision
costs between 2011 and 2019 are shown as complementary information.
Between 2011 and 2019, the main cost-efficiency KPI - ATM/CNS provision costs per IFR flight-hour
controlled- reduced significantly in both the SES States (-14.4%) and the U.S. (-18.4%).
Figure 4-17: Changes in main cost-efficiency metrics in the U.S. and the SES States (2011-2019)
The notable enhancement in cost-efficiency within the U.S. primarily stemmed from a substantial
decrease in support costs (-12.9% compared to 2011). This reduction, combined with robust traffic
growth (+8.7% compared to 2011), led to a significant decrease in support costs per flight-hour (-
19.9% compared to 2011).
The increase in ATCO employment costs per ATCO-hour (+9.7% vs. 2011) was more than
compensated by the increase in ATCO hour productivity (+25.7% vs. 2011), leading to a significant
reduction of ATCO employment cost per IFR flight-hour (-12.7% vs. 2011).
In Europe, the overall performance trends over 2011-19 period were similar to those observed in the
U.S. However, the reduction in unit ATM/CNS provision costs by 14.4% between 2011 and 2019 was
much more driven by the substantial growth in IFR flight-hours (+19.3% vs. 2011) and only to a much
lesser extent by a reduction in total support costs (-1% vs. 2011).
It is worth highlighting that the substantial growth in ATCO-hour productivity (+25.7%) between 2011
and 2019 in the U.S. could be achieved with notably less ATCOs in OPS (-11.1% vs. 2011) and less
ATCO-hours on duty (-13.5% vs. 2011). In SES States, ATCO hour productivity also increased
substantially between 2011 and 2019 (+20.1% vs 2011) but as a result of continuously increasing traffic
levels which were served by a relatively stable number of ATCOs in OPS (+1.8% vs. 2011) and hours
on duty (-0.7% vs. 2011).
20.1%
9.3%
-9.0%
-14.4%
-17.0%
-1.0%
19.3%
25.7%
9.7%
-12.7%
-18.4%
-19.9%
-12.9%
8.7%
ATCO-hour
productivity
ATCO employment
cost per ATCO-
hour in OPS
Total ATCO in OPS
employment cost
per flight-hour
Total ATM/CNS
provision costs per
IFR flight-hour
Total support
cost per flight-
hour
Change in total
support costs
Change in traffic
(IFR flight-hours
controlled)
Changes in main cost-efficiency metrics in the U.S. and the SES States (2019 vs. 2011)
FAA-ATO
SES
Period: 2011
2019
Comparison of financial values is based on figures express in real terms and in €2021

47 COMPARISON OF ANS COST-EFFICIENCY TRENDS (2011-21)
U.S. – Europe Comparison of ANS performance (Edition 2023)
To better capture the impact of COVID-19 pandemic on the two systems, Figure 4-18 shows the
breakdown of cost-efficiency changes between 2019 and 2021.
Figure 4-18: Changes in main cost-efficiency metrics in the U.S. and the SES States (2019-2021)
Following the collapse of traffic levels between 2019 and 2021, the SES States reacted by
implementing a range of cost-saving measures which resulted in a -7.0% reduction in total ATM/CNS
provision costs. These substantial savings, however, were not sufficient to compensate for the
dramatic reduction in IFR flight-hours (-44.6%) which led to a substantial increase in ATM/CNS
provision costs per IFR flight-hour (+67.9%) in 2021.
The sudden drop in traffic levels also had a considerable effect on ATCO-hour productivity in Europe
which, despite a significant reduction in total ATCO in OPS hours on duty (-11.0%), decreased
substantially (-37.8%), further widening the observed gap in productivity between Europe and the U.S.
It is worth highlighting that the combination of cost-saving measures also affecting ATCO in OPS
employment costs and the reduction of ATCO in OPS hours on duty resulted in a -1.9% decrease in
ATCO employment costs per hour in SES States.
In the U.S., the ATM/CNS provision costs per IFR flight-hour in 2021 increased by +22.6% compared
to 2019. Although this is a high increase compared to 2019, it was much lower than the increase in
Europe (+67.9%). The better cost-efficiency performance in the U.S. the result of a -1.8% reduction in
total ATM/CNS provision costs supported by a notably lower traffic reduction compared to Europe
following the COVID-19 outbreak in 2020.
Additionally, the U.S. notably reduced the total ATCO in OPS hours on duty in 2021 (-16.1% vs. 2019)
which helped to keep relatively high ATCO-hour productivity levels (-4.5% vs. 2019) despite traffic
levels still lower than before the pandemic. The reduction in ATCO in OPS hours on duty combined
with relatively stable ATCO in OPS employment costs (-0.9% vs. 2019) nonetheless resulted in a
significant overall increase in ATCO employment costs per hour on duty in the U.S. in 2021 (+18.2%).
-37.8%
-1.9%
57.7%
67.9%
73.4%
-4.0%
-44.6%
-4.5%
18.2%
23.7%
22.6%
22.2%
-2.1%
-19.9%
ATCO-hour
productivity
ATCO employment
cost per ATCO-
hour in OPS
Total ATCO in OPS
employment cost
per flight-hour
Total ATM/CNS
provision costs per
IFR flight-hour
Total support
cost per flight-
hour
Change in total
support costs
Change in traffic
(IFR flight-hours
controlled)
Changes in main cost-efficiency metrics in the U.S. and the SES States (2021 vs. 2019)
FAA-ATO
SES
Period: 2019
2021
Comparison of financial values is based on figures express in real terms and in €2021

COMPARISON OF ANS COST-EFFICIENCY TRENDS (2011-21) 48
U.S. – Europe Comparison of ANS performance (Edition 2023)
Results of main cost-efficiency metrics in 2021
Figure 4-19 provides a direct comparison of key cost-efficiency performance indicators between the
SES States and the U.S. in 2021. As indicated before, the indicators for 2021 are heavily influenced by
the effects of COVID-19 crisis.
Figure 4-19: Summary of main cost-efficiency results for 2021
Previous comparisons of Air Navigation Service (ANS) cost-efficiency between the SES States and the
U.S. had already highlighted that ATM/CNS provision costs per flight-hour were significantly lower in
the United States, with provision costs per flight-hour being approximately 81% higher in the SES
States in 2021.
Even though the overall ATM/CNS provision costs in the SES States were approximately 32% lower
than those in the U.S., the notable difference in unit costs between the two regions was primarily
driven by the fact that the SES States managed roughly 62% less traffic in 2021.
In the SES States, the significant factors contributing to the observed gap in cost-efficiency
performance compared to the U.S. include notably lower ATCO-hour productivity (-60% compared
to the U.S.), along with considerably higher ATCO employment costs per flight-hour controlled
(+160% compared to the U.S.) and higher unit support costs (+58% compared to the U.S.).
While historically the employment costs per ATCO in OPS have been lower in the SES States (-12%
vs. U.S. in 2021), when taking into consideration the differences in cost of living between Europe and
the U.S., the ATCO unit employment costs become comparable (+1% vs. U.S. in 2021).
Conversely, as a result of measures implemented by the SES ANSPs and the FAA-ATO in response to
the COVID-19 pandemic, there has been a significant reduction in the disparity of the total time spent
by ATCOs directly involved in ATC activity (referred to as total ATCO in OPS hours on duty) between
Europe and the U.S. This gap has diminished considerably, decreasing from 23% lower total ATCO-
hours on duty in the SES as compared to the U.S. in 2011 to 6% lower in 2021.
As documented in the relevant sections of this report, areas for improvements in terms of data
reporting have been identified during the preparation of this document. The proper identification and
capturing of certain elements could help to improve the cost-efficiency comparison of the U.S. and
European ANS systems going forward.
Total IFR flight-hours
controlled
Total ATCO in OPS
hours on duty
Total employment
costs for ATCOs in OPS
Total support costs
Total ATM/CNS
provision costs
Total ATCO in OPS
employment cost
per IFR flight-hour
Total support cost
per IFR flight-hour
Total ATCO in OPS
employment cost
per ATCO-hour
ATM/CNS provision
cost per IFR flight-
hour
Total ATCOs in OPS
Total ATCO in OPS
employment cost
per ATCO in OPS
Data inputs
Key performance
indicators (KPIs)
Legend:
Summary of key data for the year 2021
SES States (RP3) vs the U.S. FAA-ATO
Financial values expressed in real terms 2021 and in Euro
€9 746M €6 641M
11 784 FTEs 13 125 FTEs
€7 532M €4 480M
€2 214M €2 161M
17.0 M hrs 16.0 M hrs
20.4 M hrs 7.6 M hrs
€370
€586
€109
€282
€188 ‘000
€165 ‘000
€479
€868
€130
€135
ATCO in OPS hour
productivity
1.19
0.48
FAA-ATO
SES

49 EMERGING THEMES FOR FUTURE RESEARCH
U.S. – Europe Comparison of ANS performance (Edition 2023)
5 Emerging themes for future research
The findings in this report continue to demonstrate that it is practical to examine two different
aviation systems and develop key performance indicators using harmonized procedures. This
common approach allows both groups to examine the essential questions on the extent performance
differences are driven by policy, ATM operating strategies, or prevailing organisational,
meteorological and/or economic conditions.
Building on commonly agreed metrics in line with the ICAO Global Air Navigation Plan (GANP)
indicators, the main operational and cost-efficiency trends and differences between the two systems
have been identified and documented in several comparison reports between the U.S. and Europe.
In Europe, many operational and cost-efficiency questions revolve around the fragmentation of air
navigation service provision and its impact on system-wide flow management and ATM performance
and ANS provision cost. The airspace architecture in Europe, the ATM operational concept, as well as
the processes and technology have not changed much and are still largely in line with national
boundaries instead of operational needs and traffic flows. Although local improvements are visible at
State level in Europe, there is a need to move further towards a true network-oriented approach to
leverage synergies and to realise additional performance benefits (airspace interfaces, capacity
provision, duplication of services, data and information flows, etc.). With very limited or no en-route
support function in Europe, the air traffic flow management focuses on strategic planning (airport
scheduling) and the application of departure slots to solve capacity/ demand imbalances en-route or
at airports.
In the U.S., the Air Traffic Organization (ATO) is the operational arm of the FAA and responsible for
providing safe and efficient air navigation services. Although there is only one service provider in the
U.S., the financing and accounting is different from Europe and exact cost and staff allocation can be
challenging to enable a perfect like with like comparison of cost-efficiency metrics. Operationally,
there is more emphasis in the U.S. on tactical traffic management in the gate-to-gate phase to
maximise throughput under prevailing conditions on the day of operations. Compared to Europe,
airport demand levels are self-controlled by airlines which most likely encourages higher throughput,
but which makes operations more susceptible to disruptions which potentially result in major delays
and cancellations.
Given the key elements affecting performance in the two systems and improvements in data
availability, EUROCONTROL and FAA intend to jointly advance a common performance assessment
capability in the following areas.
ANS operational performance
Quantify the Magnitude and Effect of Traffic Flow Initiatives: In an environment with limited
capacities, any deviation from the flight plan or schedule potentially results in time penalties (i.e.
delay) or an underutilization of available resources if provisions for capacity and demand variations
are made in advance. When an imbalance between capacity and demand occurs, the way the resulting
“extra” time is managed and distributed along the various phases of flight has an impact on airspace
users (predictability, fuel burn), the utilization of scarce capacity, and the environment. More work is
needed to determine how to minimize the impact of flow measures on airspace users and the
environment in each flight phase while maximizing the use of scarce airport and en-route capacity.
For instance, the degree to which the U.S. system currently offers more flexibility in mitigating
demand/capacity imbalances using traffic flow initiatives that are coordinated across multiple en-

EMERGING THEMES FOR FUTURE RESEARCH 50
U.S. – Europe Comparison of ANS performance (Edition 2023)
route centres. More research is needed to understand required flexibility levels of system users and
what level of “delay” in which flight phase would be necessary to maximize the use of capacity.
Quantify capacity utilization: At airports, the main issue is related to strategic scheduling and its
impact on airport throughput and the ability to sustain throughput when weather deteriorates. In a
previous comparison report, a first view of airport arrival capacities and how they relate to peak
throughput was done. In the U.S. the capacities were based on actual recorded (“called”) rates
whereas in Europe strategic peak arrival capacities from the airport scheduling process were used.
Although not done in this report, quantifying capacity utilization and assessing this trade-off would
be a worthwhile subject for further study. The U.S. quantifies capacity utilization formally through its
Terminal Arrival Efficiency Rating (TAER) measure. However, benchmarking the two systems would
require a common understanding of how capacity is declared for comparable airports.
A better understanding of tactical capacities at airports but also in en-route centers would strengthen
the comparison and enable a more complete assessment of flow management together with capacity
utilization. This includes for instance also the impact of environmental constraints on ATM
performance and runway throughput.
Factors affecting en-route flight efficiency: En-route flight efficiency is affected by a considerable
number of factors involving different stakeholders. Not all factors are under the direct control of ANS
(adverse weather conditions, special use airspace, etc.) but ANS has a role to play in reducing
constraints to a necessary minimum while maximizing the use of airspace. In Europe, there is a high
density of special use airspace in the core area of Europe which reduces flexibility in managing traffic
flows. Future reports could provide some initial evaluations of those factors impacting en-route flight
efficiency in each region (trade-offs, special use airspace, TMA entry points, weather impact, etc.).
Vertical flight efficiency: Vertical flight efficiency is not explicitly addressed in this comparison but is
a frequent topic for discussion in various working groups. In previous reports there was an initial high-
level assessment based on distance flown level in descent. More work is required to improve the
assessment of vertical flight efficiency that can be attributed to ATM in the comparison report, and to
develop commonly agreed indicators for the measurement of those inefficiencies.
ANS cost-efficiency
Improve Controller and Staffing Comparisons: This report makes basic high-level comparisons on the
staffing and facilities required to accommodate a given level of traffic at a given level of performance.
This effort indicates that a deeper understanding of the role of the FAA “developmental” and Certified
Professional Controllers In-Training (CPC-ITs), vs. a European equivalent may be necessary to
advance other measures, such as cost based or productivity measures. At present, international
benchmarks make these comparisons using the ACE and CANSO definition of the full time ATCO in
operation (ATCO in OPS). Moreover, a better understanding of working arrangements in each region
(rostering practices, contractual working hours, overtime, leave, training) would be beneficial in
future comparison reports. Similar investigation is also necessary to better assess the impact of
contracted towers on the overall staffing level and ATCO output in the U.S. since these are not
currently reflected in the analysis.
Support cost analysis and breakdown of costs: Support costs are all ATM/CNS provision costs minus
ATCO in OPS employment costs. Support costs can be further broken down into support staff costs,
depreciation costs, and other operating costs. Overall, support costs account for 77% of the total
ATM/CNS provision costs in the U.S. and for some 68% in Europe. In view of the large share in the
total ATM/CNS costs, it would be useful to better understand the main support cost drivers in the U.S.
and in Europe, including a better understanding of the treatment of facilities and equipment as part
of the total operating costs in each region.

51 ANNEXES
U.S. – Europe Comparison of ANS performance (Edition 2023)
6 References
[1]
EUROCONTROL Performance Review Unit and FAA-ATO, “U.S./Europe - Comparison of
ATM-Related Operational Performance 2017,” April 2019.
[2]
EUROCONTROL Performance Review Unit, “U.S./Europe comparison of air navigation
services (ANS) cost-efficiency trends between 2006-2016,” April 2019.
[3]
European Commission, FAA/ATO, EUROCONTROL/ AIU, “Special report on the impact of the
COVID-19 pandemic on the U.S. and European ANS system,” December 2021. [Online].
Available: https://www.eurocontrol.int/publication/special-report-impact-covid-19-
pandemic-us-and-european-ans-systems.
[4]
European Commission (EC), “Commission Implementing Regulation (EU) 2019/317 of 11
February 2019 laying down a performance and charging scheme in the single European sky
and repealing Implementing Regulations (EU) No 390/2013 and (EU) No 391/2013,” 2019.
[5]
ICAO, “GANP Portal - KPI Overview,” 2020. [Online]. Available:
https://www.icao.int/SAM/Documents/2021-RLA06901-TallerVOLIII-
1/KPI%20GANP%206.pdf.
[6]
EUROCONTROL Performance Review Commission, “U.S./Europe continental comparison of
ANS cost-efficiency trends 2002-2011,” November 2013.
[7]
EUROCONTROL Performance Review Commission, “U.S./Europe continental comparison of
ANS cost-efficiency trends 2006-2014,” November 2016.
[8]
Performance Review Unit, “ATM Cost-Effectiveness (ACE) Benchmarking Handbook,”
Available online on: https://ansperformance.eu/economics/ace/ace-handbook/, 1 March 2023.
[9]
EUROCONTROL Performance Review Commission, “ATM Cost-Effectiveness (ACE)
Benchmarking Report (2023 Edition),” May 2023.
[10]
Performance Review Commission, “ATM Cost-effectiveness (ACE) 2016 Benchmarking
Report. Report commissioned by the Performance Review Commission,” Available online at
http://www.eurocontrol.int/prc/publications, May 2018.
[11]
EUROCONTROL, Performance Review Unit, “Specification for Economic Information
Disclosure, v3.0.”.
[12]
CANSO, “Global Air Navigation Services Performance Report 2016, 2011 – 2015 ANSP
Performance Results,” December, 2016.
[13]
EUROCONTROL Aviation Intelligence Unit, “ATM Cost-Effectiveness (ACE) benchmarking
web page,” [Online]. Available: https://ansperformance.eu/economics/ace-overview/.
[14]
European Commission (EC), “Commission Implementing Regulation (EU) No 390/2013 of 3
May 2013 laying down a performance scheme for air navigation services and network
functions,” Official Journal of the European Union. 9.5.2013. p. 1, 3 May 2013.

ANNEXES 52
U.S. – Europe Comparison of ANS performance (Edition 2023)
[15]
Federal Aviation Administration, “JO 7210.55G - Operational Data Reporting Requirements,”
01 06 2017. [Online]. Available:
https://www.faa.gov/regulations_policies/orders_notices/index.cfm/go/document.informatio
n/documentID/99732. [Accessed 2018].
[16]
SESAR JU, “European ATM Master Plan - Edition 2020,” 2019. [Online]. Available:
https://www.sesarju.eu/masterplan.
[17]
STATFOR, “EUROCONTROL Five-Year Forecast 2022-2029,”
https://www.eurocontrol.int/publication/eurocontrol-forecast-update-2022-2028, March
2023.
[18]
U.S. DOT Bureau of Transportation Statistics, “Airline On-Time Performance and Causes of
Flight Delays,” [Online]. Available: https://www.bts.gov/explore-topics-and-
geography/topics/airline-time-performance-and-causes-flight-delays.
[19]
European Commission (EC), “Regulation (EC) No 549/2004 of the European Parliament and of
the Council laying down the framework for the creation of the Single European Sky. OJ L 96,
31.3.2004, p. 1.,” 2004.
[20]
European Commission (EC), “Commission Implementing Regulation (EU) No 390/2013 of 3
May 2013 laying down a performance scheme for air navigation services and network
functions,” Official Journal of the European Union. 9.5.2013. p. 1, 3 May 2013.
[21]
EUROCONTROL Performance Review Unit and FAA-ATO, “Special report on the impact of
the COVID-19 pandemic on the U.S. and European ANS systems,” November 2021. [Online].
Available: https://www.eurocontrol.int/publication/special-report-impact-covid-19-
pandemic-us-and-european-ans-systems.
[22]
European Commission, “Commission Regulation (EC) No 1794/2006 of 6 December 2006
laying down a common charging scheme for air navigation services.,” 2006.
[23]
Federal Aviation Administration (FAA), “The Air Traffic Controller Workforce Plan 2023 -
2032,” May 2023.
[24]
U.S. DOT and Federal Aviation Administration, “Facility Operation and Administration. Order
JO 7210.3Y.,” April 2014.

53 ANNEXES
U.S. – Europe Comparison of ANS performance (Edition 2023)
ANNEX 1 – Operational data sources
Various data sources have been used for the analyses in this report. These data sources include, inter
alia, trajectory position data, ATFM imposed delay, key event times and scheduled data from airlines.
DATA FROM AIR TRAFFIC MANAGEMENT SYSTEMS
Both the U.S. and Europe obtain key data from their respective air traffic flow management (ATFM)
systems. There are two principal sources within ATM. These include trajectory/flight plan databases
used for flight efficiency indicators, and delay databases that record ATFM delay and often include
causal reasons for the delay.
For the U.S, flight data come from the Traffic Flow Management System (TFMS). In Europe, data are
derived from the Enhanced Tactical Flow Management System (ETFMS) of the European Network
Manager. These data sources provide the total IFR traffic picture and are used to determine the “main”
airports in terms of IFR traffic and the flight hour counts used to determine traffic density.
Both ATFM systems have data repositories with detailed data on individual flight plans and
surveillance track sample points from actual flight trajectories. They also have built-in capabilities for
tracking ATM-related ground delays
by departure airport and en-route reference location.
The data sets also provide flight trajectories which are used for the calculation of flight efficiency in
terms of planned routes and actual flown routing. The data sets which include data in the en-route
transitional phase and in the terminal areas allow for performance comparison throughout various
phases of flight.
DATA FROM AIRLINES
The U.S. and Europe receive operational and delay data from airlines for scheduled flights. This
represents a more detailed subset of the traffic flow data described above and is used for punctuality
or phase of flight indicators where more precise times are required.
These data include what is referred to as OOOI (Gate Out, Wheels Off, Wheels On, and Gate In) times.
OOOI data along with airline schedules allow for the calculation of gate delay, taxi times, block times,
and gate arrival time delay on a flight-by-flight basis. The data also contains cause codes for delays
on a flight-by-flight basis.
In the U.S., most performance indicators are derived from the Aviation System Performance Metrics
(ASPM) database which fuses detailed airline data with data from the Traffic Flow Management
System (TFMS). Air carriers are required to report performance data if they have at least 1% of total
scheduled-service domestic passenger revenues monthly. However, as of 2018, airlines with at least
0.5% of the total scheduled-service domestic passenger revenues are required to report performance
data monthly. In addition, there are other carriers that report voluntarily. ASPM coverage is around
95% of the IFR traffic at the main 34 airports (within region) with 86% of the total IFR traffic reported
as scheduled operations. Airline-reported performance data, which includes airline reported delay
cause, for traffic at the main 34 airports represent around 65% of all IFR flights at these airports. This
percentage (as well as the specific carriers that report) does not stay constant from reporting period
to reporting period and this has some effect on the performance indicators based on OOOI data (On-
Time percentage, Taxi-out, Taxi-in). However, for the study period, OOOI data was available for
nearly all commercial carriers with flights to and from the U.S. through OAG.
In Europe, the Central Office for Delay Analysis (CODA) collects data from airlines each month. The
data collection started in 2002 and the reporting was voluntary until the end of 2010. As of January

ANNEXES 54
U.S. – Europe Comparison of ANS performance (Edition 2023)
2011, airlines which operate more than 35 000 flights per year
36
within the European Union (EU)
airspace are required to submit the data monthly according to EU Regulations [Ref. [14]].
A significant difference between the two airline data collections is that the delay causes in the U.S.
relate to arrivals, whereas in Europe they relate to the delays experienced at departure.
ATM/TMI DELAY DATA
In the U.S., delay data is derived from the Operational Network (OPSNET) and is used to calculate
ATM/TMI delay in this report. The data is only available for flights delayed by 15 minutes or more.
Individual flight level data is available for flights delayed due to the following Traffic Management
Initiatives (TMIs): Ground Delay Programs (GDP), Ground Stops (GS), Airspace Flow Program (AFP),
and Collaborative Trajectory Options Program (CTOP). These delays are reported using automation
through the Air Traffic Control System Command Center (ATCSCC).
Flights delayed due to other TMIs, which include Severe Weather Avoidance Plan (SWAP), Miles-In-
Trail (MIT), Departure Stop, Metering, and Departure/En-Route/Arrival Spacing Programs
(DSP/ESP/ASP), are manually reported by facilities from where the aircraft departs (departure airport)
[Ref. [15]]. A portion of these other TMI delays do not have a destination airport because they are
recorded manually by the departure facility as a group of delayed flights. Because the destination
airport is required to determine if a flight falls within the scope of this study, the U.S. CONUS area,
the delays without a recorded destination airport are distributed proportionally to the share of
international vs. U.S. CONUS operations at the departure airport.
ANS PERFORMANCE DATA
This comparison study builds on the data describing the ANS operations within the scope of the U.S.
and European region. Within the field of air transport statistics, a variety of sources report on air
traffic. Care must be taken when comparing the data from different sources, as data collection and
reporting requirements entail different conventions concerning the breakdown of the data in terms
of flight operations, type of flights, etc.
Across Europe, different sources also report on air traffic statistics for the purpose of market analysis.
For example, Eurostat reports on air traffic observed at EU-28 level, while different States (typically
the national civil aviation authorities or associated statistics agencies) report traffic at national level
with varying granularity levels or breakdowns.
The data sets used in this study are derived from the aforementioned systems and ensure
comparability of the data with respect to the provision of air navigation services and operational ANS
performance.
ADDITIONAL DATA ON CONDITIONS
Post-operational analysis should identify the causes of delay and a better understanding of real
constraints. In identifying causal factors, additional data is needed for airport capacities, runway
configurations, sector capacities, winds, visibility, and convective weather. For this report, year over
year trends for airport capacities and meteorological data have been used to help explain changes in
the performance metrics.
36
Calculated as the average over the previous three years.

55 ANNEXES
U.S. – Europe Comparison of ANS performance (Edition 2023)
ANNEX 2 – Operations at the main 34 airports
OPERATIONS AT THE MAIN 34 AIRPORTS IN THE U.S.
USA ICAO IATA COUNTRY
Avg. daily IFR
departures in
2022
2022 vs.
2019
Atlanta (ATL) KATL ATL United States 982 -20.3%
Chicago (ORD) KORD ORD United States 963 -23.1%
Dallas (DFW) KDFW DFW United States 892 -9.2%
Denver (DEN) KDEN DEN United States 834 -4.0%
Los Angeles (LAX) KLAX LAX United States 756 -19.7%
Charlotte (CLT) KCLT CLT United States 673 -14.2%
Las Vegas (LAS) KLAS LAS United States 638 3.5%
Miami (MIA) KMIA MIA United States 617 9.4%
New York (JFK) KJFK JFK United States 598 -2.5%
Phoenix (PHX) KPHX PHX United States 555 -5.1%
Seattle (SEA) KSEA SEA United States 545 -11.1%
Houston (IAH) KIAH IAH United States 542 -16.9%
Newark (EWR) KEWR EWR United States 542 -10.1%
Boston (BOS) KBOS BOS United States 512 -11.8%
Orlando (MCO) KMCO MCO United States 494 -0.5%
New York (LGA) KLGA LGA United States 481 -4.9%
San Francisco (SFO) KSFO SFO United States 475 -22.9%
Minneapolis (MSP) KMSP MSP United States 421 -23.9%
Salt Lake City (SLC) KSLC SLC United States 403 -4.9%
Washington (DCA) KDCA DCA United States 401 -0.3%
Detroit (DTW) KDTW DTW United States 387 -28.6%
Philadelphia (PHL) KPHL PHL United States 383 -27.6%
Ft. Lauderdale (FLL) KFLL FLL United States 370 -15.0%
Washington (IAD) KIAD IAD United States 368 -12.1%
Nashville (BNA) KBNA BNA United States 326 7.5%
Dallas Love (DAL) KDAL DAL United States 306 -0.3%
Baltimore (BWI) KBWI BWI United States 296 -16.7%
Memphis (MEM) KMEM MEM United States 287 -7.4%
San Diego (SAN) KSAN SAN United States 281 -9.8%
Chicago (MDW) KMDW MDW United States 281 -9.1%
Tampa (TPA) KTPA TPA United States 277 -2.3%
Houston (HOU) KHOU HOU United States 240 -6.5%
Portland (PDX) KPDX PDX United States 231 -26.9%
St. Louis (STL) KSTL STL United States 212 -18.7%
Average (M34) 487 -12.0%

ANNEXES 56
U.S. – Europe Comparison of ANS performance (Edition 2023)
OPERATIONS AT THE MAIN 34 AIRPORTS IN EUROPE
37
37
Although they are within the main 34 airports in terms of traffic in Europe, Istanbul (SAW), Antalya (AYT) and
Manchester (MAN) airports were not included in the analysis due to data availability issues.
EUROPE ICAO IATA COUNTRY
Avg. daily IFR
departures in
2022
2022 vs.
2019
Istanbul (IST) LTFM IST Türkye 578 1.3%
Amsterdam (AMS) EHAM AMS Netherlands 570 -18.3%
Paris (CDG) LFPG CDG France 561 -18.9%
Frankfurt (FRA) EDDF FRA Germany 523 -25.6%
London (LHR) EGLL LHR United Kingdom 521 -20.4%
Madrid (MAD) LEMD MAD Spain Continental 482 -17.5%
Barcelona (BCN) LEBL BCN Spain Continental 388 -17.7%
Munich (MUC) EDDM MUC Germany 386 -31.9%
Palma (PMI) LEPA PMI Spain Continental 302 1.4%
London (LGW) EGKK LGW United Kingdom 298 -23.6%
Rome (FCO) LIRF FCO Italy 291 -31.4%
Dublin (DUB) EIDW DUB Ireland 290 -11.2%
Zurich (ZRH) LSZH ZRH Switzerland 289 -21.6%
Athens (ATH) LGAV ATH Greece 284 -6.0%
Oslo (OSL) ENGM OSL Norway 282 -18.4%
Vienna (VIE) LOWW VIE Austria 280 -27.5%
Lisbon (LIS) LPPT LIS Portugal 278 -8.3%
Copenhagen (CPH) EKCH CPH Denmark 277 -23.2%
Paris (ORY) LFPO ORY France 272 -10.3%
Milan (MXP) LIMC MXP Italy 256 -20.2%
London (STN) EGSS STN United Kingdom 241 -11.4%
Brussels (BRU) EBBR BRU Belgium 239 -24.0%
Stockholm (ARN) ESSA ARN Sweden 233 -26.9%
Berlin (BER) EDDB BER Germany 222 -42.5%
Geneva (GVA) LSGG GVA Switzerland 213 -13.1%
Warsaw (WAW) EPWA WAW Poland 198 -25.4%
Dusseldorf (DUS) EDDL DUS Germany 192 -37.8%
Malaga (AGP) LEMG AGP Spain Continental 191 -1.0%
Nice (NCE) LFMN NCE France 185 -7.3%
Helsinki (HEL) EFHK HEL Finland 182 -31.8%
Cologne (CGN) EDDK CGN Germany 162 -15.7%
London (LTN) EGGW LTN United Kingdom 161 -16.4%
Hamburg (HAM) EDDH HAM Germany 141 -31.1%
Bucharest (OTP) LROP OTP Romania 139 -17.2%
Average (M34) 297 -19.8%

57 ANNEXES
U.S. – Europe Comparison of ANS performance (Edition 2023)
ANNEX 3 – European ANSPs included in the comparison
ANSP Country
1 Albcontrol Albania
2 ANS CR Czech Republic
3 ARMATS Armenia
4 Austro Control Austria
5 Avinor Norway
6 BULATSA Bulgaria
7 Croatia Control Croatia
8 DCAC Cyprus Cyprus
9 DFS Germany
10 DHMİ Türkiye
11 DSNA France
12 EANS Estonia
13 ENAIRE Spain
14 ENAV Italy
15 Fintraffic ANS Finland
16 HASP Greece
17 HungaroControl Hungary
18 IAA Ireland
19 LFV Sweden
20 LGS Latvia
21 LPS Slovak Republic
22 LVNL Netherlands
23 MATS Malta
24 M-NAV North Macedonia
25 MOLDATSA Moldova
26 MUAC
27 NATS United Kingdom
28 NAV Portugal Portugal
29 NAVIAIR Denmark
30 Oro Navigacija Lithuania
31 PANSA Poland
32 ROMATSA Romania
33 skeyes Belgium
34 Skyguide Switzerland
35 Slovenia Control Slovenia
Serbia
Montenegro
States covered by the SES Regulations
States not covered by the SES Regulations
36
SMATSA

ANNEXES 58
U.S. – Europe Comparison of ANS performance (Edition 2023)
ANNEX 4 – Methodology - economic comparison
6.1 DEFINITIONS OF KEY DATA
ATCO in OPS (i.e. ATCO on operational duty) refers to an ATCO who is participating in an activity that
is either directly related to the control of traffic or is a necessary requirement for an ATCO to be able
to control traffic. Such activities include manning a position, refresher training and supervising on the-
job trainee controllers, but do not include participating in special projects, teaching at a training
academy, or providing instruction in a simulator.
Support staff refers to total staff other than ATCOs in OPS. These figures include ATCOs which are
not working on operational duties in the OPS room (e.g. on special projects outside the OPS room).
As detailed in section 4.2.1, for FAA-ATO support staff also includes some operational staff engaged
in ATC activities (i.e. traffic management coordinators, controllers, inflight services, developmentals
and CPC-IT, Oceanic ATCOs).
ATCOs in OPS employment costs comprise the gross wages and salaries, payments for overtime,
employers’ contributions to any social security scheme, taxes directly levied on employment,
employers’ pension contributions and the costs of other benefits.
Total ATCO in OPS hours on duty refer to the total actual number of hours spent by ATCOs in OPS
on duty in OPS, including breaks and including overtime in OPS. Since the FAA-ATO reports average
working hours per ATCO in its data submission, the total ATCO in OPS hours on duty are derived as a
product of continental ATCOs in OPS and average working hours per ATCO.
More details on the definitions of key data are available in the EUROCONTROL Specification for
Economic Information Disclosure v3.0 [13].
6.2 INFLATION, EXCHANGE RATES AND PPP DATA
The costs for FAA-ATO and European (including the SES States) ANSPs are expressed in real terms
using the Consumer Price Index (CPI) deflator for each year of the analysis. Inflation figures for Europe
are in line with those published by EUROSTAT, while, for ANSPs for which EUROSTAT data are not
available, IMF figures are used. For FAA-ATO, the IMF inflation figures are used.
Since the ANSPs (incl. FAA-ATO) provide their data to the Performance Review Unit of
EUROCONTROL in national currency, the exchange rates are used to express the financial data in
common currency (Euro) for the purposes of this analysis. For the European ANSPs, the exchange
rates of the year of the analysis (i.e. 2021) are used to express the figures in €2021 and are in line with
those used for charging purposes. ANSP level exchange rate data can be found on Annex 4 of the ACE
Benchmarking Report (May 2023 edition) [9].
Similar methodology is applied to convert the European ANSP figures in Purchasing Power Standard
(PPS) using the purchasing power parity (PPP). The PPP figures are sourced from EUROSTAT, while,
for ANSPs for which EUROSTAT data are not available, IMF figures are used with the PPPs derived
using a common conversion factor between these two data sources. More details on this
methodology as well as the detailed PPP figures are available on Annex 4 of the ACE Benchmarking
Report (May 2023 edition) [9].
The exchange rates, purchasing power parities and methodology used to convert the FAA-ATO
figures to real €2021 are described in detail in section 4.2.3 of this report.
Further details on the treatment of financial data for European (incl. the SES States) ANSPs can be
found in the ACE Benchmarking Report (May 2023 edition) [9] and ACE Benchmarking Handbook [8].

59 ANNEXES
U.S. – Europe Comparison of ANS performance (Edition 2023)
ANNEX 5 – Summary of key cost-efficiency data
U.S. FAA-ATO 2011 2012 2013 2014 2015 2016 2017 2018 2019 2020 2021
Flight Hours 23.4 M 23.0 M 22.8 M 22.9 M 23.4 M 23.8 M 24.2 M 24.9 M 25.4 M 19.0 M 20.4 M
ATCOs in OPS 13,270 13,482 13,209 12,953 12,530 12,168 11,957 11,927 11,800 11,959 11,784
Other Staff 21,705 21,115 20,697 19,264 19,797 20,178 20,487 20,156 19,792 19,843 19,897
Total staff 34,974 34,597 33,906 32,217 32,326 32,346 32,444 32,083 31,592 31,802 31,681
Total ATM/CNS provision cost nominal 11224 M $ 10924 M $ 10766 M $ 10939 M $ 10602 M $ 10776 M $ 10915 M $ 11138 M $ 11326 M $ 11444 M $ 11789 M $
3.1% 2.1% 1.5% 1.6% 0.1% 1.3% 2.1% 2.4% 1.8% 1.3% 4.7%
Total ATM/CNS provision cost $ 2021 13522 M $ 12893 M $ 12523 M $ 12522 M $ 12121 M $ 12166 M $ 12066 M $ 12019 M $ 12005 M $ 11980 M $ 11789 M $ Avg. 2011-2021
1.39 1.28 1.33 1.33 1.11 1.11 1.13 1.18 1.12 1.14 1.18 1.21
2021 prices using avg. €/US$ exchange rate of 1.21
Total ATM/CNS provision cost € 2021 11179 M 10659 M 10353 M 10352 M 10021 M 10059 M 9976 M 9937 M 9925 M 9904 M 9746 M
per flight hour 478 464 454 452 428 423 413 399 390 521 479
Total support cost € 2021 8826 M 8206 M 7924 M 7926 M 7594 M 7681 M 7681 M 7676 M 7691 M 7642 M 7532 M
per flight hour 378 357 348 346 324 323 318 308 303 402 370
ATCO employment cost € 2021 2354 M 2453 M 2430 M 2427 M 2427 M 2378 M 2295 M 2261 M 2234 M 2263 M 2214 M
per flight hour 101 107 107 106 104 100 95 91 88 119 109 Avg. 2011-2021
1.32 1.34 1.36 1.37 1.37 1.41 1.42 1.43 1.47 1.48 1.46 1.40
2021 prices using avg. PPP conversion rate of 1.40
Total ATM/CNS provision cost PPS 9641 M 9192 M 8928 M 8927 M 8642 M 8674 M 8603 M 8569 M 8559 M 8541 M 8405 M
per flight hour 412 400 392 390 369 364 356 344 337 449 413
Total support cost PPS 7611 M 7077 M 6833 M 6835 M 6549 M 6623 M 6623 M 6620 M 6633 M 6590 M 6495 M
per flight hour 326 308 300 298 280 278 274 266 261 347 319
ATCO employment cost PPS 2030 M 2115 M 2095 M 2093 M 2093 M 2051 M 1979 M 1949 M 1926 M 1951 M 1909 M
per flight hour 87 92 92 91 89 86 82 78 76 103 94
EUROPE (36 ANSPs) 2011 2012 2013 2014 2015 2016 2017 2018 2019 2020 2021
Flight Hours 14.1 M 13.8 M 13.9 M 14.4 M 14.7 M 15.2 M 15.9 M 16.9 M 17.2 M 7.4 M 9.5 M
ATCOs in OPS 16,243 16,403 16,566 16,691 16,738 16,982 17,063 16,879 17,008 16,753 16,552
Other Staff 35,628 35,529 35,075 33,397 33,369 32,964 33,239 33,959 34,792 34,976 34,393
Total staff 51,871 51,932 51,641 50,089 50,106 49,945 50,302 50,838 51,800 51,729 50,945
Total ATM/CNS provision cost € 2021 8069 M 8077 M 7897 M 7920 M 8024 M 8076 M 8143 M 8212 M 8391 M 8179 M 7693 M
per flight hour 572 584 569 550 545 532 511 486 486 1,105 813
Total support cost € 2021 5497 M 5529 M 5349 M 5323 M 5366 M 5353 M 5378 M 5437 M 5581 M 5504 M 5198 M
per flight hour 390 400 385 370 364 353 337 322 324 744 549
ATCO employment cost € 2021 2572 M 2547 M 2548 M 2597 M 2659 M 2723 M 2765 M 2775 M 2810 M 2674 M 2495 M
per flight hour 182 184 184 180 180 180 173 164 163 361 264
Total ATM/CNS provision cost PPS 8275 M 8292 M 8108 M 8219 M 8357 M 8493 M 8598 M 8750 M 8978 M 8652 M 8210 M
per flight hour 587 599 584 571 567 560 539 518 520 1,169 867
Total support cost PPS 5684 M 5733 M 5525 M 5574 M 5634 M 5688 M 5725 M 5847 M 6034 M 5847 M 5604 M
per flight hour 403 414 398 387 382 375 359 346 350 790 592
ATCO employment cost PPS 2592 M 2559 M 2583 M 2645 M 2723 M 2805 M 2873 M 2904 M 2943 M 2805 M 2606 M
per flight hour 184 185 186 184 185 185 180 172 171 379 275
Single European Sky States (RP3) 2011 2012 2013 2014 2015 2016 2017 2018 2019 2020 2021
Flight Hours 11.6 M 11.3 M 11.3 M 11.6 M 11.8 M 12.2 M 12.8 M 13.5 M 13.8 M 6.0 M 7.6 M
ATCOs in OPS 13,415 13,512 13,566 13,611 13,600 13,792 13,804 13,608 13,661 13,342 13,125
Other Staff 26,591 26,367 25,762 24,491 24,294 23,925 23,964 24,466 24,947 25,417 25,184
Total staff 40,006 39,879 39,328 38,101 37,894 37,718 37,768 38,074 38,607 38,759 38,309
Total ATM/CNS provision cost € 2021 6991 M 6980 M 6746 M 6815 M 6839 M 6866 M 6955 M 6997 M 7139 M 6922 M 6641 M
per flight hour 604 618 599 588 579 564 545 518 517 1,159 868
Total support cost € 2021 4712 M 4733 M 4503 M 4540 M 4516 M 4479 M 4524 M 4557 M 4665 M 4589 M 4480 M
per flight hour 407 419 400 392 383 368 355 338 338 769 586
ATCO employment cost € 2021 2279 M 2247 M 2244 M 2275 M 2323 M 2387 M 2431 M 2440 M 2474 M 2333 M 2161 M
per flight hour 197 199 199 196 197 196 191 181 179 391 282
Total ATM/CNS provision cost PPS 6893 M 6892 M 6653 M 6766 M 6786 M 6845 M 6934 M 7022 M 7162 M 6844 M 6556 M
per flight hour 595 610 591 584 575 562 544 520 519 1,146 857
Total support cost PPS 4646 M 4682 M 4438 M 4512 M 4471 M 4467 M 4501 M 4569 M 4679 M 4513 M 4412 M
per flight hour 401 414 394 389 379 367 353 339 339 756 577
ATCO employment cost PPS 2247 M 2210 M 2215 M 2254 M 2314 M 2378 M 2433 M 2453 M 2483 M 2331 M 2143 M
per flight hour 194 196 197 194 196 195 191 182 180 390 280
US Inflation rate (IMF)
€/US$ exchange rates (EUROSTAT)
Purchasing Power Parities EU27=1 (EUROSTAT)

Directorate General for Mobility
and Transport (MOVE)
European Commission
B-1049 Brussels, Belgium
Aviation Intelligence Unit
96, rue de la Fusée
B-1130 Brussels, Belgium
FAA/ATO System Operations Services
Office of Performance Analysis
800 Independence Ave., S.W.
Washington, DC 20591
