
1
Influenza
Virologic Surveillance
Right Size
Sample Size Calculators:
User Guide
1
st
Edition
July 2013
2
The Association of Public Health Laboratories (APHL) is a national non-profit organization
dedicated to working with members to strengthen governmental laboratories that perform
testing of public health significance. By promoting effective programs and public policy, APHL
strives to provide member laboratories with the resources and infrastructure needed to protect
the health of U.S. residents and to prevent and control disease globally.
© Copyright 2012, Association of Public Health Laboratories. All Rights Reserved.
This report was fully funded by Cooperative Agreement # U60HM000803 from CDC and/or
Assistant Secretary for Preparedness and Response. Its contents are solely the responsibility of
the authors and do not necessarily represent the official views of CDC and/or Assistant Secretary
for Preparedness and Response or APHL.
3
Acknowledgements
CDC and APHL would like to thank Dr. Lauren Meyers and her team at the University of Texas at
Austin. We appreciate their expertise in developing the calculators. Additionally, thank you to all
of the Right Size Stakeholders Working Group as well as the Right Size Tabletop Exercise and
Pilot Project participants. The feedback garnered from the participants and the activities was
instrumental in calculator development.
Table of Contents
Acknowledgements .................................................................................................................................................. 3
Overview ...................................................................................................................................................................... 5
Introduction ................................................................................................................................................................ 6
Intended audience ............................................................................................................................................... 6
Intended Use .......................................................................................................................................................... 6
Abbreviations ........................................................................................................................................................ 6
Sample Size Calculator Surveillance Objectives and Questions ....................................................... 7
Key Variables for Calculating Sample Size ................................................................................................ 8
Choosing an appropriate threshold, confidence level and error rate ............................................ 9
Recommended confidence level, margins of error and thresholds ................................................ 9
Usage Tips ............................................................................................................................................................... 9
Calculator A: Situational Awareness for Seasonal Influenza ............................................................... 10
Calculator A: Situational Awareness, Tab 1: Sample Size ................................................................... 12
Calculator A: Situational Awareness, Tab 2: Sample Size Table ...................................................... 13
Calculator A: Situational Awareness, Tab 3: Data Confidence.......................................................... 14
Calculator B: Detecting a Rare/Novel Influenza Event .......................................................................... 15
Calculator B: Detecting a Rare/Novel Influenza Event, Tab 1: Flu+ Sample Size ...................... 17
Calculator B: Detecting a Rare/Novel Influenza Event, Tab 2: MA-ILI Sample Size ................. 18
Calculator B: Detecting a Rare/Novel Influenza Event, Tab 3: Combined samples .................. 19
Calculator B: Detecting a Rare/Novel Influenza Event, Tab 4: Data Confidence ....................... 20
Calculator B: Detecting/Monitoring Antiviral Resistance .................................................................... 22
Calculator B: Detecting/Monitoring Antiviral Resistance: Tab 1: Flu+ Sample Size ................ 23
Calculator B: Detecting/Monitoring Antiviral Resistance: Tab 2: MA-ILI Sample Size ........... 24
Calculator B: Detecting/Monitoring Antiviral Resistance: Tab 3: Combined samples ............ 25
Calculator B: Detecting/Monitoring Antiviral Resistance: Tab 4: Data Confidence ................. 27
4
Calculator C: Rare/Novel Influenza Event Investigation ...................................................................... 29
Calculator C: Rare/Novel Influenza Event Investigation: Tab 1: Flu+ Sample Size .................. 31
Calculator C: Rare/Novel Influenza Event Investigation: Tab 2: MA-ILI Sample Size ............. 32
Calculator C: Rare/Novel Influenza Event Investigation: Tab 3: Combined Samples .............. 33
Calculator C: Rare/Novel Influenza Event Investigation: Tab 4: Data Confidence ................... 34
Appendix: Equation 12 ........................................................................................................................................ 36

5
Overview
The CDC-APHL Influenza Virologic Surveillance Right Size Project defines the rationale, vital
capabilities and optimal right size for influenza virologic surveillance. The Influenza Virologic
Surveillance Right Size Road Map consolidates requirements for all components of virologic
surveillance and provides tools to assess and improve the precision of the system to support
disease surveillance, response and control efforts and policy decisions.
State and local influenza surveillance system partners are encouraged to implement a statistical,
systematic approach to estimate the number of specimens to be tested in order to provide a
specific level of data confidence for situational awareness, rare/novel influenza event detection
and rare/novel influenza event investigation at the recommended thresholds. Specimen
sampling approaches should be established to enhance detection of rare/novel influenza events
based on national thresholds, while at the same time collecting a representative sample of
routine influenza cases for overall situational awareness. For more information, please refer to
the Influenza Virologic Surveillance Right Size Road Map
.
This document provides a user’s guide for the
Right Size Influenza Virologic Surveillance Sample
Size Calculators.
6
Introduction
Intended audience
The primary audiences for the Roadmap and the sample size calculators are the state and local
epidemiologists, influenza surveillance coordinators, public health laboratory (PHL) directors
and other senior infectious disease laboratory staff responsible for coordinating policy,
decisions, and implementation of virologic surveillance strategies.
Intended Use
The sample size calculators provided here can be used to estimate the desired number of
specimens that should be tested to ensure adequate confidence in influenza surveillance data
and detection of rare/novel influenza viruses at a point where intervention can be effective.
Alternately, these calculators can be used to demonstrate the level of data confidence obtained
with the systems that a jurisdiction is capable of implementing.
Abbreviations
• Influenza like Illness (ILI): defined as fever (temperature of 100°F [37.8°C] or greater) and
cough and/or sore throat; used as a measure of illness that may be caused by influenza
viruses.
• Medically Attended-Influenza like Illness (MA-ILI): The population of individuals with ILI
who seek medical care. This is the subset of the population available for surveillance
testing.
This number is determined based on estimates that each person in the US visits
an emergency room or physician in ambulatory care setting 2.5 times per year, and that
the percentage of outpatient visits that are for ILI is 2.2% at CDC ILINet Seasonal
Baseline - this number can be changed throughout the season as needed.
• Influenza Positive (Flu+): The number of specimens testing positive for an influenza
virus among specimens collected from patients with MA-ILI.
• Rare/Novel Influenza Positive (Rare+): The number of specimens testing positive for a
rare/novel influenza virus among specimens collected from patients with MA-ILI (e.g.
rare/novel influenza subtypes, very low prevalence subtypes, antiviral resistance).
7
Sample Size Calculator Surveillance Objectives and Questions
Surveillance Objective:
Surveillance Question
Calculator A:
Situational
Awareness for
Seasonal
Influenza
Determine the beginning and end of
the influenza season and monitor the
prevalence and spread of influenza
viruses throughout the year
How many specimens from MA-ILI
patients does the laboratory need to
test in a given period (usually one
week) to determine that the
prevalence of Flu+ specimens among
MA-ILI persons tested is X% (e.g. 10%)
at a specified confidence level and
error rate?
Calculator B:
Rare/novel
influenza event
Detection
Detect a rare/novel influenza virus
among influenza positive surveillance
specimens tested in all states at a
low enough threshold for effective
intervention and control measures.
This objective relates to the initial
detection of a rare/novel influenza
virus which generally occurs as part
of routine surveillance. Investigation
of a rare/novel influenza event after
initial detection (the “deep-dive”) is a
separate objective and is discussed in
more detail below.
How many specimens does the PHL
need to test to allow the national
surveillance system to detect a
rare/novel influenza virus at 0.14%
prevalence with 95% confidence
(aggregating testing data from all
states)?
Calculator B:
Detecting/
Monitoring
Antiviral
Resistance
Detect antiviral resistance virus
among influenza positive surveillance
specimens tested in all states at a
low enough threshold for effective
intervention and control measures.
How many of each influenza A
subtype Flu+ or influenza B Flu+
specimens need to be tested for
antiviral resistance to allow the
national surveillance system to detect
antiviral resistant viruses at or below
a 5% prevalence with 95% confidence
(aggregating testing data from all
states)?
Calculator C:
Rare/novel
influenza event
Investigation
Determine the prevalence of the
rare/novel influenza virus
(Rare+/Flu+) within a state following
the initial detection of a rare/novel
influenza virus (i.e. “deep dive”);
confirm that the prevalence of a
rare/novel influenza event does not
Once a rare/novel influenza virus is
detected, how many ILI specimens
does the PHL need to test to
determine that the true prevalence
does not exceed a specified percent
of Flu+ within the state or in the

8
exceed a specific percent positivity.
Investigation of a rare/novel
influenza event is typically performed
using enhanced, targeted
surveillance.
specific jurisdiction under
investigation?
Key Variables for Calculating Sample Size
Confidence Level
This is the amount of certainty that the true prevalence is equivalent to
the estimated prevalence. As this value increases the sample size
increases.
Margin of Error
This is the amount of error that can be tolerated. A 2% error would
mean that the calculated prevalence may be plus or minus 2% from the
true answer. As this value decreases the sample size increases.
Population
This is the population under surveillance. For routine influenza
surveillance, this is the number of people in the state with influenza like
illness (ILI). As the population size increases the sample size increases.
Expected Prevalence
In the calculators, this is the prevalence that the PHL expects to
calculate or the level of detection the PHL wishes to achieve. For the
purposes of calculating sample size, the expected prevalence refers to
the prevalence of influenza positive (Flu+) specimens among the
number of MA-ILI specimens tested. This is NOT the prevalence of
disease in the community.
Note that as the expected prevalence decreases, the sample size
becomes smaller when the margin of error is held constant. This seems
counter intuitive, but when the margin of error is scaled to align with
the expected prevalence, the sample size should increase. For instance,
a 5% margin of error is more appropriate for a predicted prevalence of
50% than a predicted prevalence of 1%. A more appropriate margin of
error for a predicted prevalence of 1% may be 0.5%. Thus, it is
important to scale the margin of error to the predicted prevalence.

9
Choosing an appropriate threshold, confidence level and error rate
The number of samples to be tested will vary depending on the confidence level, margin of
error, threshold and assumptions used in the calculators. Selecting a lower confidence level
increases the amount of uncertainty in the calculated prevalence but permits a smaller sample
size which may be necessary if resources are limited. A higher margin of error means that more
error can be tolerated. With input from the exercise participants and the evaluation of data
from previous influenza seasons, the stakeholders identified optimal, mid-range and minimal
confidence levels and error rates or thresholds for the two objectives that comprise routine
surveillance. The ultimate goal is to have all jurisdictions participating in virologic surveillance at
the optimal levels defined here. However, to accommodate differences in state and local
resources, including the ability to acquire specimens from healthcare providers, alternate mid-
range and minimal levels are provided. Additionally, options to supplement unscreened MA-ILI
specimens with screened influenza positive specimens is provided, this reduces the total
number of specimens a PHL needs to test to achieve the recommended thresholds. (Note: This
may increase the risk of missing a rare/novel influenza virus if the commercial tests used have
decreased sensitivity to detect the new virus). For more information, please refer to
the
Influenza Virologic Surveillance Right Size Road Map.
Recommended confidence level, margins of error and thresholds
Situational
Awareness
Rare/Novel Influenza Event Detection
High Season
Low Season
Confidence
Level (%)
Margin
of
Error
(%)
Confidence
Level (%)
Threshold
(%)
Confidence
Level (%)
Threshold
(%)
Optimal
95
5
95
1/700
95
1/200
Mid-
range
90 5 95 1/600 95 1/165
Minimum
85
5
95
1/500
95
1/143
Usage Tips
• Moving the mouse over any “blue text” will display a definition of that word/phrase as it
pertains to the calculator.
• Numbers or words in bold face will change as the input values are altered.
• Moving the mouse over a plot will display the values for that point on the curve.
• Clicking on a curve will display a text description of how to interpret the information.

10
Calculator A: Situational Awareness for Seasonal Influenza
Surveillance Objective: Determine the beginning and end of the influenza season and monitor
the prevalence and spread of influenza viruses throughout the year.
Threshold: The beginning of the influenza season is defined as the time when the prevalence of
specimens testing positive for an influenza virus (Flu+) among specimens collected from patients
with MA-ILI is at or above 10% over two consecutive weeks. This value roughly corresponds to
the CDC ILINet Seasonal Baseline where the percentage of outpatient visits for ILI reaches 2.2%.
Jurisdictions may choose to alter the percent positive used in the sample size calculator to more
accurately determine the amount of testing needed throughout the season or assess the
confidence level of the data provided.
Surveillance Question: How many specimens from MA-ILI patients does the laboratory need to
test in a given period (usually one week) to determine that the prevalence of Flu+ specimens
among MA-ILI persons tested is X% (e.g. 10%) at a specified confidence level and error rate?
Assumptions:
• Each person in the US visits an emergency room or ambulatory primary care physician
2.5 times per year and 2.2% of medical visits are for ILI outside of influenza season
ILINet baseline.
• The fraction of a population that is MA-ILI is calculated as: Population*2.5*1/52 * 0.022
= Population * 1.0577x10
−3
.
• The providers are randomly selecting patients with ILI for surveillance testing.
• The specimens tested were either unscreened or submitted randomly irrespective of
test result.
• The sample size is large, i.e. greater than 20 individuals and the prevalence of Flu+
among MA-ILI+ is not close to either 0 or 100 percent.
• Sampling is performed from a finite population (national or state-level).
Equations:
1. Sample size:
n
=
pz
2
α
2
− p
2
z
2
α
2
ε
2
where
n
= required sample size,
p
= expected FLU+/MA-ILI,
α
= confidence level. A value of
α
= 0.95 results in a 95%
confidence interval.
z
2
α
2
=
1−
α
2
percentile of a standard normal distribution,
ε
= error
level. A value of 0.05 results in a confidence interval that is +/- 5%.
2. Finite size correction factor:
n
*
=
nN
n + (N −1)
where
n
*
= corrected sample size,
n
=
required sample size for an infinite population,
N
= total population size (e.g. the
number of people living in the target state).

11
3. Sample power- error:
ε
=
z
α
2
p(1− p)
n
where
n
= actual sample size,
p
= expected
FLU+/MA-ILI,
α
= confidence level. A value of
α
= 0.95 results in a 95% confidence
interval.
z
2
α
2
=
1
−
α
2
percentile of a standard normal distribution,
ε
= error level. A
value of 0.05 results in a confidence interval that is +/- 5%.
4. Sample power –confidence:
z
α
2
=
ε
p(1− p)
n
where
n
= actual sample size,
p
=
expected FLU+/MA-ILI,
α
= confidence level. A value of
α
= 0.95 results in a 95%
confidence interval.
z
2
α
2
=
1−
α
2
percentile of a standard normal distribution,
ε
= error
level. A value of 0.05 results in a confidence interval that is +/- 5%.
Inputs
• Total Population: Use the drop-down menu to select the total population under
surveillance (e.g. state populations). For labs collecting specimens from subsets of state
populations or populations that cross multiple states, choose “Other” and enter the
estimated size of the entire population under consideration. The calculator uses this
number and the assumptions above to estimate the number of MA-ILI cases.
• Estimated prevalence of MA-ILI: Input based on ILINet data during the season. Set the
estimated prevalence of MA-ILI using the slider. The default is 2.2%, which is the
estimated ILINet seasonal baseline for the percentage of outpatient visits that are for ILI.
• Expected prevalence of Flu+/MA-ILI: Set the expected Flu+/MA-ILI using the slider. The
default value is 10% for the beginning and end of the influenza season. Other percent
positive values may be used based on jurisdictional preferences or seasonal variability in
the prevalence of ILI or influenza. For example, if the PHL would like to detect when
Flu+/MA-ILI crosses the 10% threshold at the beginning of the influenza season, then
move the slider to 10%. If instead the plan is to estimate Flu+/MA-ILI later in the season,
when it is closer to 30%, then move the slider to 30%. Note: the true prevalence
(Flu+/MA-ILI) may differ from the estimated prevalence; however, the approximation
still provides an important baseline for determining sample sizes.
• Confidence level: Set the confidence level using the slider. The optimal level of
confidence for situational awareness is 95%, the minimum should be no less than 85%.
• Margin of error: When using laboratory samples to estimate Flu+/MA-ILI, the PHL will
calculate an expected value plus or minus a margin of error. For example, the PHL might
calculate 10% plus or minus 2%, which means that the PHL estimates Flu+/MA-ILI to fall
somewhere between 8% and 12%. An acceptable margin of error should be no greater
than 5%.
• MA-ILI sample size: Input the number of MA-ILI samples. For example, this number
might be the maximum throughput of the PHL or the number of samples tested in the
previous week.
Note: The higher the confidence level, the more confident the PHL can be that the true level of
Flu+/MA-ILI in the population falls within the estimated interval. Intuitively, high confidence

12
levels and small margins of error require many samples, while low confidence levels or large
margins of error require fewer samples.
Calculator A: Situational Awareness, Tab 1: Sample Size
Tab 1 is used to determine the minimum sample size (of unscreened MA-ILI specimens) needed
to estimate the fraction of Flu+/MA-ILI with a specified margin of error and confidence level.
This tab of the calculator utilizes equations 1 and 2.
Instructions:
After setting the (1) total population, (2) estimated prevalence of MA-ILI, (3) expected Flu+/MA-
ILI, and (4) confidence level, a graph and table of minimum samples sizes and margins of error is
generated.
By clicking on the curve, the precise sample size for a given margin of error is shown. The text
below the plot will change as different margin of errors are selected.
For example, if the PHL is conducting surveillance in Alabama, with an expected Flu+/MA-ILI of
10% and a confidence level of 95% and the PHL choses a margin of error of 5% the output will
read, “A sample size of 135 unscreened MA-ILI specimens is needed in order to be 95%

13
confident that the true prevalence of Flu+/MA-ILI is 10% (+/- 5%).” By decreasing the margin of
error to 3%, the minimum sample size decreases and text now reads, “A sample size of 357
unscreened MA-ILI specimens is needed in order to be 95% confident that the true prevalence
of Flu+/MA-ILI is 10% (+/- 3%).
Calculator A: Situational Awareness, Tab 2: Sample Size Table
Tab 2 is used to generate a table of the minimum sample size (of unscreened MA-ILI specimens)
needed to estimate the fraction of Flu+/MA-ILI with a specified margin of error (rows) and
confidence level (columns). Tab 2 utilizes equations 1 and 2.
Instructions:
The output is a table of confidence levels and margin of errors corresponding to the population
size and expected Flu+/MA-ILI. Note: If the table is highlighted, it can be copied and pasted it
into a tab-delimited text file. This file can be imported directly into an excel document.

14
Calculator A: Situational Awareness, Tab 3: Data Confidence
Tab 3 is used to determine the best combinations of margin of error and confidence
level achievable for a specified sample size. This tab utilizes equations 3 and 4.
Instructions:
After setting the (1) total population size, (2) estimated prevalence of MA-ILI, (3) expected
prevalence of Flu+/MA-ILI, and (3) MA-ILI sample size, a graph and table of confidence levels and
margin of errors is generated.
By clicking on the curve, the precise combination of confidence level and margin of error is
shown. The text below the plot will change as different margin of errors are selected.
For example, if the PHL is conducting surveillance in Alabama, with an expected Flu+/MA-ILI of
10% and a sample size of 100 and a margin of error of 3.08% is chosen the output will read, “If
100 MA-ILI specimens were tested and the estimated prevalence is 10%, the PHL can be 70 %
(+/- 3.08%) confident that the true prevalence is 10%.” By increasing the margin of error to
5.04%, the output text now reads, “If 100 MA-ILI specimens were tested and the estimated
prevalence is 10%, the PHL can be 91 % (+/- 5.04%) confident that the true prevalence is 10%.”
Note: the confidence level increases as the margin of error increases.

15
Calculator B: Detecting a Rare/Novel Influenza Event
Surveillance Objective: Detect a rare/novel influenza virus among influenza positive surveillance
specimens tested in all states at a low enough threshold for effective intervention and control
measures. This objective relates to the initial detection of a rare/novel influenza virus which
generally occurs as part of routine surveillance. Investigation of a rare/novel influenza event
after initial detection (the “deep-dive”) is a separate objective and is discussed in a later section.
National Threshold: Different thresholds have been established for the high season (influenza
positivity > 20%), and low season (influenza positivity < 20%). These thresholds represent
achievable levels of detection based on review of virologic surveillance data from several recent
influenza seasons.
• High Season: 0.14% (1/700); one rare/novel influenza virus among 700 influenza virus
positive specimens aggregated at the national surveillance level over a defined period.
During influenza season sample sizes should be calculated based on weekly reporting to
FluView. A minimum threshold of 1/500 may be used for determining the sample size in
states with limited testing capacity. Application of a less sensitive threshold for detection
(e.g. below 1/500) would mean that more rare/novel influenza viruses are circulating prior
to detection and would impair disease prevention and control efforts.
• Low season: 0.5% (1/200); one rare/novel influenza virus among 200 influenza virus
positive specimens aggregated at the national surveillance level over a defined period.
This approximates the prevalence at which the H1N1pdm2009 influenza virus was
detected in April 2009. A minimum threshold of 1/143 may be used for determining the
sample size in states with limited testing capacity.
Surveillance Question: How many specimens does the PHL need to test to allow the national
surveillance system to detect a rare/novel influenza virus at 0.14% (1/700) prevalence with 95%
confidence (aggregating testing data from all states)?
Assumptions
• Specimens are collected randomly.
• Each Flu+ patient has a constant probability of being Rare+, and that probability is the
same for all patients.
• ILI+ patients submitted for testing are not pre-screened positive for influenza.
• Flu+ samples are known to be influenza positive, but their Rare+/- status is unknown.
• There is no correction for finite population size – this is a conservative assumption to
prevent under sampling. Correcting for finite sample size requires accurately
characterizing the surveillance population. In the case of a rare/novel influenza event
investigation, the size of the relevant population may be largely unknown. The sample
size determined without correcting for a finite population size is always correct. If a
sample size correction factor is improperly applied, the target population will be under-
sampled, resulting in an overestimate of the confidence level and underestimate of the
error.
Equations
5. Sample size
n =
Log(1−
φ
)
Log(1− p)
where
n
= required sample size,
φ
= desired probability of

16
observing at least one rare/novel influenza event
p
= expected Rare+/Flu+.
6. Sample power-confidence
φ
= 1− (1− p)
n
where
n
= actual sample size,
φ
= desired
probability of observing at least one rare/novel influenza event,
p
= expected
Rare+/Flu+.
7. Sample power-threshold
p = 1− (1−
φ
)
1
n
where
n
= actual sample size,
φ
= desired
probability of observing at least one rare/novel influenza event,
p
= detection threshold
for Rare+/Flu+.
Inputs
• Total Population: Use the drop-down menu to select the total population under
surveillance (e.g. state populations). For labs collecting specimens from subsets of state
populations or populations that cross multiple states, choose “Other” and enter the
estimated size of the entire population under consideration. The calculator uses the
number and the assumptions above to estimate the weekly number of MA-ILI cases.
• Surveillance Scale: Indicate whether surveillance is being conducted at the national or
state/regional level using the surveillance scale dropdown menu. The default is
national, meaning that all states are contributing to a national surveillance effort
proportional to their population size. The number of samples that a state PHL needs to
test is apportioned based on population size. The calculator also provides the option for
states to calculate the number of specimens to test for detection of a rare/novel
influenza event at a specific threshold within their state. Note: the sample size for an
individual state at the same threshold (e.g. 1/200 or 1/700) will be significantly larger
than that needed for the national threshold.
• Confidence level: Set the confidence level using the slider. The optimal level of
confidence for rare/novel influenza event detection is 95%. For example, if the PHL
choose a confidence level of 95% and a detection threshold of 1/400, then the resulting
minimum sample size should be sufficient to detect a rare/novel influenza virus when it
reaches a prevalence of 1/400 (Rare+/Flu+), 95% of the time. Intuitively, a high
confidence level and a low detection threshold requires many samples, while low
confidence and a high detection threshold results in fewer samples.
• Expected prevalence of Flu+/MA-ILI: Set the expected Flu+/MA-ILI using the slider. This
is an input when calculating the number of MA-ILI specimens needed, or the number of
combined MA-ILI and Flu+ specimens. The default value is 10% for the beginning and
end of the influenza season. Other percent positive values may be used based on
jurisdictional preferences or seasonal variability in the prevalence of ILI or influenza. For
example, if the PHL would like to detect when Flu+/MA-ILI crosses the 10% threshold at
the beginning of the influenza season, then move the slider to 10%. If, instead, the plan
is to estimate Flu+/MA-ILI later in the season, when it is closer to 30%, then move the
slider to 30%. Note: the true prevalence (Flu+ /MA-ILI) may differ from the estimated
prevalence; however, the approximation still provides an important baseline for
determining sample sizes.
• Detection threshold: (Applicable for Calculator B: Detecting a Rare/Novel Influenza
Event, Tab 3: Combined samples Rare/Novel Influenza Event Calculator, Combined
Samples) Set the detection threshold using the slider bar. The detection threshold is the

17
desired detection prevalence of a rare/novel influenza virus among all influenza positive
cases. For example, a detection threshold of 0.25% (1/400) means that rare/novel
influenza event should be detected by the lab when it rises to a prevalence of one out of
every 400 cases of influenza.
• Flu+ Sample Size: Input the number of Flu+ samples.
• MA-ILI Sample Size: Input the number of MA-ILI samples.
Calculator B: Detecting a Rare/Novel Influenza Event, Tab 1: Flu+ Sample Size
Tab 1 is used to determine the minimum sample size (of Flu+ specimens) needed to detect a
rare/novel influenza virus at specified detection threshold (Rare+/Flu+) with a specified
confidence. This tab utilizes equation 5.
Instructions:
After setting the (1) total population, (2) surveillance scale, and (3) confidence level, a graph and
table of minimum Flu+ sample size and detection thresholds (Rare+/Flu+) is generated.
By clicking on the curve, the precise combination of confidence level and detection threshold is
shown. The text below the plot will change as different detection thresholds are selected.

18
For example, if the PHL is conducting surveillance in Alabama, at the national level, with a
confidence of 95% and a detection threshold of 1/700 is selected, the text will read, “To be 95%
confident of detecting 1 or more rare/novel influenza events at a prevalence of (0.1429%) 1/700
at a national level, the PHL must test 32 Flu+ specimens.”
Calculator B: Detecting a Rare/Novel Influenza Event, Tab 2: MA-ILI Sample Size
Tab 2 is used to determine the minimum sample size (of unscreened MA-ILI specimens) needed
to detect a rare/novel influenza virus at a specified detection threshold (Rare+/Flu+) with a
specified confidence. The number of samples required for this form of sampling will be
considerably higher than when only considering Flu+ specimens. This tab utilizes equation 5.
Instructions:
After setting the (1) total population size, (2) surveillance scale, (3) confidence level, and (4)
expected prevalence of Flu+/MA-ILI, a graph and table of minimum MA-ILI sample size and
detection thresholds (Rare+/Flu+) is generated.
By clicking on the curve, the precise combination of confidence level and detection threshold is
shown. The text below the plot will change as different detection thresholds are selected.
19
For example, if the PHL is conducting surveillance in Alabama, at the national level, with a
confidence of 95%, a detection threshold of 1/700, and an expected Flu+/MA-ILI of 30% is
selected, the text will read, “To be 95% confident of detecting 1 or more rare/novel influenza
events at a prevalence of 0.1429% (1/700) at a national level, the PHL must test 107 MA-ILI
specimens.”
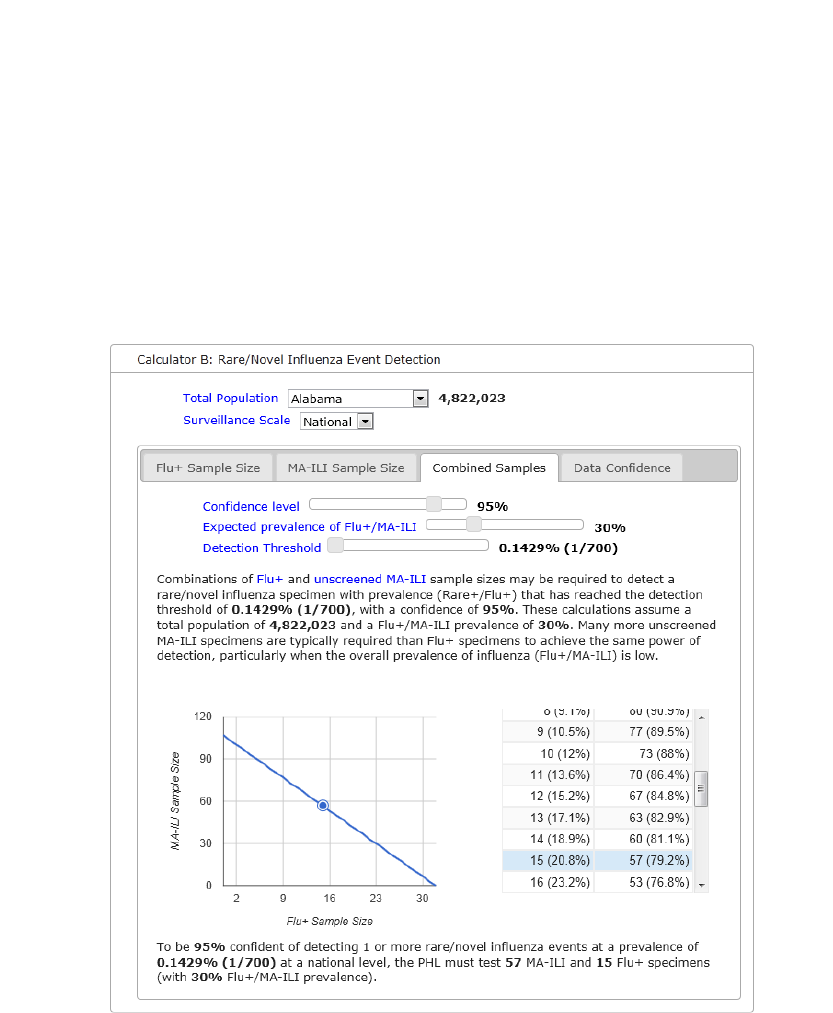
Calculator B: Detecting a Rare/Novel Influenza Event, Tab 3: Combined samples
Tab 3 is used to determine combinations of Flu+ and unscreened MA-ILI sample sizes that may
be needed to detect a rare/novel influenza virus at a specified detection threshold and
confidence level. Note: many more unscreened MA-ILI specimens are typically required than
Flu+ specimens to achieve the same power of detection, particularly when the overall
prevalence of influenza (Flu+/MA-ILI) is low. This tab utilizes equation 5.
Instructions:
After setting the (1) total population, (2) surveillance scale, (3) confidence level, (4) expected
prevalence of Flu+/MA-ILI and (5) detection threshold, a graph and table of the minimum
sample sizes for Flu+ and MA-ILI is generated.

20
By clicking on the curve, the precise combination of sample types and the corresponding
detection threshold and confidence are shown. The text below the plot will change as different
combinations are selected.
For example, if the PHL is conducting surveillance in Alabama, at the national level, with a
confidence of 95% and an estimated 80% MA-ILI and 20% Flu+ specimen type combination is
selected the text will read, “To be 95% confident of detecting 1 or more rare/novel influenza
events at a prevalence of 0.1429% (1/700) at a national level, the PHL must test 57 MA-ILI and
15 Flu+ specimens (with 30% Flu+/MA-ILI prevalence).
Calculator B: Detecting a Rare/Novel Influenza Event, Tab 4: Data Confidence
Tab 4 is used to determine the best combinations of detection threshold and confidence
level achievable for a specified sample size (number of Flu+ and unscreened MA-ILI specimens
to be tested). Note: there is a trade-off between detection threshold and confidence level.
Intuitively, the lower the prevalence of a rare/novel influenza, the less likely it will be detected,
and vice versa. This tab utilizes equations 6 and 7.
Instructions:

21
After setting the (1) total population, (2) surveillance scale, (3) Flu+ sample size (4) MA-ILI
sample size, and (5) expected prevalence of Flu+/MA-ILI a graph and table of detection
thresholds (Rare+/Flu+) and confidence levels is generated.
By clicking on the curve, the precise combination of confidence level and detection threshold is
shown. The text below the plot will change as different confidence levels are selected.
For example, if the PHL is conducting surveillance in Alabama, with an expected Flu+/MA-ILI of
30% and a sample size of 11 Flu+ and 26 MA-ILI samples and a detection threshold of 1/700 is
shown the output will read, “If the laboratory tested 11 Flu+ and 26 MA-ILI specimens and 30%
estimated prevalence of Flu+/MA-ILI, the PHL can be 82.97% confident that the rare/novel
influenza virus would be detected at a prevalence of 0.14% (1/700) at a national level.”

22
Calculator B: Detecting/Monitoring Antiviral Resistance
Surveillance Objective: Detect antiviral resistance virus among influenza positive surveillance
specimens tested in all states at a low enough threshold for effective intervention and control
measures.
National Threshold: 5% prevalence of oseltamivir resistant viruses among positive specimens
for each influenza A subtype or influenza B at the national level.
Surveillance Question: How many of each influenza A Flu+ subtype or influenza B Flu+
specimens need to be tested for antiviral resistance to allow the national surveillance system to
detect antiviral resistant viruses at or below a 5% prevalence with 95% confidence (aggregating
testing data from all states)?
Assumptions
• Specimens are collected randomly.
• Each Flu+ patient has a constant probability of being Rare+, and that probability is the
same for all patients.
• ILI+ patients submitted for testing are not pre-screened positive for influenza.
• Flu+ samples are known to be influenza positive, but their Rare+/- status is unknown.
• There is no correction for finite population size – this is a conservative assumption to
prevent under sampling. Correcting for finite sample size requires accurately
characterizing the surveillance population. In the case of a rare/novel influenza event
investigation, the size of the relevant population may be largely unknown. The sample
size determined without correcting for a finite population size is always correct. If a
sample size correction factor is improperly applied, the target population will be under-
sampled, resulting in an overestimate of the confidence level and underestimate of the
error.
Equations
8. Sample size
n =
Log(1−
φ
)
Log(1− p)
where
n
= required sample size,
φ
= desired probability of
observing at least one rare/novel influenza even,
p
= expected Rare+/Flu+.
9. Sample power confidence
φ
= 1−
(1− p
)
n
where
n
= actual sample size,
φ
= desired
probability of observing at least one rare/novel influenza event,
p
= expected
Rare+/Flu+.
10. Sample power threshold
p = 1
− (1−
φ
)
1
n
where
n
= actual sample size,
φ
= desired
probability of observing at least one rare/novel influenza event,
p
= detection threshold
for Rare+/Flu+.
Inputs
• Total Population: Use the drop-down menu to select the population under surveillance
(e.g. state populations). For labs collecting specimens from subsets of state populations
or populations that cross multiple states, choose “Other” and enter the estimated size

23
of the entire population under consideration. This calculator uses this number and the
assumptions above to estimate the weekly number of MA-ILI cases.
• Surveillance Scale: Indicate whether surveillance is being conducted at the national or
state/regional level using the surveillance scale dropdown menu. The default is
national, representing the number of specimens that need to be tested by the state to
detect antiviral resistance at a national aggregated threshold. The number of samples
the state needs to test is apportioned based on population size. States wishing to
calculate the number of specimens to test for detection of antiviral resistance at a
specific threshold within their state can select their state, note that the sample size of
an individual state will be significantly larger than that needed for the national
threshold.
• Confidence level: Set the confidence level using the slider. The optimal level of
confidence for rare/novel influenza event detection is 95%.
• Expected prevalence of Flu+/MA-ILI: Set the expected Flu+/MA-ILI using the slider. This
is an input when calculating the number of MA-ILI specimens needed, or the number of
combined MA-ILI and Flu+ specimens. The default value is 10% for the beginning and
end of the influenza season. Other percent positive values may be used based on
jurisdictional preferences or seasonal variability in the prevalence of ILI or influenza. For
example, if the PHL would like to detect when Flu+/MA-ILI crosses the 10% threshold at
the beginning of the influenza season, then move the slider to 10%. If instead the plan is
to estimate Flu+/MA-ILI later in the season, when it is closer to 30%, then move the
slider to 30%. Note: the actual prevalence (Flu+ /MA-ILI) may differ from the estimated
prevalence; however, the approximation still provides an important baseline for
determining sample sizes.
• Detection threshold: Set the detection threshold using the slider bar. The detection
threshold is the desired detection prevalence of an antiviral resistance influenza virus
among all influenza positive cases. For example, a detection threshold of 0.25% (1/400)
means that the antiviral resistance virus should be detected by the lab when it rises to a
prevalence of one out of every 400 cases of influenza.
• Flu+ Sample Size: Input the number of Flu+ samples
• MA-ILI Sample Size: Input the number of MA-ILI samples.
Calculator B: Detecting/Monitoring Antiviral Resistance: Tab 1: Flu+ Sample Size
Tab 1 is used to determine the minimum sample size (of Flu+ specimens) needed to
detect/monitor antiviral resistance at a specified detection threshold (Rare+/Flu+) with a
specified confidence. This tab utilizes equation 8.

24
Instructions:
After setting the (1) total population, (2) surveillance scale, and (3) confidence level, a graph and
table of minimum sample size and detection thresholds is generated. The graph and table show
the minimum sample size (of Flu+ specimens) required to detect an antiviral resistant influenza
virus at a specified detection threshold (Rare+/Flu+).
By clicking on the curve, the precise combination of confidence level and detection threshold is
shown. The text below the plot will change as different detection thresholds are selected.
For example, if the PHL is conducting surveillance in Alabama, at the national level, with a
confidence of 95% and a detection threshold of 1/700 is selected, the text will read, “To be 95%
confident of detecting 1 or more rare/novel influenza events at a prevalence of 0.1429% (1/700)
at a national level, the PHL must test 32 Flu+ specimens.”
Calculator B: Detecting/Monitoring Antiviral Resistance: Tab 2: MA-ILI Sample Size
Tab 2 is used to determine the minimum sample size (of unscreened MA-ILI specimens) needed
to detect/monitor antiviral resistance at a specified detection threshold (Rare+/Flu+) with a
specified confidence. The number of samples required for this form of sampling will be
considerably higher than when only considering Flu+ specimens. This tab utilizes equation 8.

25
Instructions:
After setting the (1) total population, (2) surveillance scale, and (3) confidence level, a graph and
table of minimum sample size and detection thresholds is generated. The graph and table show
the minimum sample size (of MA-ILI specimens) required to detect an antiviral resistant
influenza virus at a specified detection threshold (Rare+/Flu+).
By clicking on the curve, the precise combination of confidence level and detection threshold is
shown. The text below the plot will change as different detection thresholds are selected.
For example, if the PHL is conducting surveillance in Alabama, at the national level, with a
confidence of 95%, a detection threshold of 1/700, and an expected Flu+/MA-ILI of 30% is
selected, the text will read, “To be 95% confident of detecting 1 or more rare/novel influenza
events at a prevalence of 0.1429% (1/700) at a national level, the PHL must test 107 MA-ILI
specimens.”
Calculator B: Detecting/Monitoring Antiviral Resistance: Tab 3: Combined samples
Tab 3 is used to determine combinations of Flu+ and unscreened MA-ILI sample sizes that may
be needed to detect/monitor antiviral resistance virus at a specified detection threshold and

26
confidence level. Note: many more unscreened MA-ILI specimens are typically required than
Flu+ specimens to achieve the same power of detection, particularly when the overall
prevalence of influenza (Flu+/MA-ILI) is low. This tab utilizes equation 8.
Instructions:
After setting the (1) total population, (2) surveillance scale, (3) confidence level (4) expected
prevalence of Flu+/MA-ILI, and (5) detection threshold, a graph and table of minimum sample
sizes for Flu+ and MA-ILI is generated.
By clicking on the curve, the precise combination of confidence level and detection threshold is
shown. The text below the plot will change as different detection thresholds are selected.
For example, if the PHL is conducting surveillance in Alabama, at the national level, with a
confidence of 95% and a detection threshold of 5% is selected, the text will read, “To be 95%
confident of detecting 1 or more rare/novel influenza events at a prevalence of 5% at a national
level, the PHL must test 319 MA-ILI specimens per week.”
For example, if the PHL is conducting surveillance in Alabama, at the national level, with a
confidence of 95% and an estimated 80% MA-ILI and 20% Flu+ specimen type combination is
selected the text will read, “To be 95% confident of detecting 1 or more rare/novel influenza

27
events at a prevalence of 0.1429% (1/700) at a national level, the PHL must test 57 MA-ILI and
15 Flu+ specimens (with 30% Flu+/MA-ILI prevalence).
Calculator B: Detecting/Monitoring Antiviral Resistance: Tab 4: Data Confidence
Tab 4 is used to determine the best combinations of detection threshold and confidence
level achievable for a specified sample size (number of Flu+ and unscreened MA-ILI specimens
to be tested). Note: there is a trade-off between detection threshold and confidence level.
Intuitively, the lower the prevalence of antiviral resistance, the less likely it will be detected, and
vice versa. This tab utilizes equations 6 and 7.
Instructions:
After setting the (1) total population, (2) surveillance scale, (3) Flu+ sample size (4) MA-ILI
sample size, and (5) expected prevalence of Flu+/MA-ILI a graph and table of detection
thresholds (Rare+/Flu+) and confidence levels is generated.
By clicking on the curve, the precise combination of confidence level and detection threshold is
shown. The text below the plot will change as different confidence levels are selected.
28
For example, if the PHL is conducting surveillance in Alabama, with an expected Flu+/MA-ILI of
30% and a sample size of 11 Flu+ and 26 MA-ILI samples and a detection threshold of 1/700 is
shown the output will read, “If the laboratory tested 11 Flu+ and 26 MA-ILI specimens and 30%
estimated prevalence of Flu+/MA-ILI, the PHL can be 82.97% confident that the rare/novel
influenza virus would be detected at a prevalence of 0.14% (1/700) at a national level.”
29
Calculator C: Rare/Novel Influenza Event Investigation
Surveillance Objective: Determine the prevalence of the rare/novel influenza virus (Rare+/Flu+)
within a state following the initial detection of a rare/novel influenza virus (i.e. “deep dive”);
confirm that the prevalence of a rare/novel influenza event does not exceed a specific percent
positivity. Investigation of a rare/novel influenza event is typically performed using enhanced,
targeted surveillance.
Threshold: There are no defined thresholds for rare/novel influenza event investigation, as
specific situations and jurisdictional considerations may warrant different thresholds. Generally,
investigations are undertaken to determine how much more of the rare/novel influenza virus is
present in the community and identify source(s) of the rare/novel influenza virus (i.e. animal-
human, human-human). In general, if the rare/novel influenza event was detected at 1/700, the
investigation threshold should be between 1-5%.
Surveillance Question:
Once a rare/novel influenza virus is detected, how many ILI
specimens does the PHL need to test to determine that the true prevalence does not
exceed a specified percent of Flu+ within the state or in the specific jurisdiction under
investigation?
Assumptions:
• Specimens are collected randomly. This is an assumption used in the calculator;
however, in many rare/novel influenza event investigations targeted surveillance is
applied based on the situation and appropriate epidemiologic criteria. Targeted
surveillance intentionally biases the sample. Future iterations of the calculator will allow
users to address bias in calculating sample sizes.
• This calculator would be most relevant in a 2009 H1N1-like event, where the at-risk
population group is unknown and a significant public health investigation for cases has
been initiated. This assumption, however, results in very high sample sizes. This
calculator may not be appropriate when targeted surveillance is a more efficient initial
approach, such as the 2012 H3N2v summer surveillance scenario targeting visitors to
state/county fairs.
• There is no correction for finite population size – this is a conservative assumption to
prevent under sampling. Correcting for finite sample size requires accurately
characterizing the surveillance population. In the case of a rare/novel influenza event
investigation, the size of the relevant population may be largely unknown. The sample
size determined without correcting for a finite population size is always correct. If a
sample size correction factor is improperly applied, the target population will be under-
sampled, resulting in an overestimate of the confidence level and underestimate of the
error.
• Each Flu+ patient has a constant probability of being Rare+, and that constant is the
same for all patients.
• The probability of a Flu+ patient also being Rare+ is close to zero.
• The statistical test of interest is whether the prevalence exceeds a specified threshold
and can be considered a one-tailed test.
• ILI+ patients submitted for testing are not pre-screened positive for influenza.
• Flu+ samples are known to be influenza positive, but their Rare+/- status is unknown.

30
• Asymmetrical distribution.
Equations:
11. Rare/Novel Influenza Event Investigations:
p
*
< p +
δ
+ z
2
α
v(p)+
δ
2
where
δ
=
z
2
α
3
+
1
6
1− 2p
n
and
v(p) =
p(1− p)
n −1
and
p
*
= desired upper-bound on
p
.
n
=
required sample size,
p
= expected Rare+/Flu+,
z
2
α
=
1
−
α
percentile of a standard
normal distribution (one-sided test).
12. Sample size for estimating confidence interval of a small proportion: See Appendix:
Equation 12.
When events are rare (p close to 0), the normal approximation to the binomial does not hold.
Importantly, this results in an underestimate of the number of samples required. Here an
alternative approximation that holds when p is close to 0 is implemented.
Inputs:
• Total Population: Use the drop-down menu to select the population under surveillance
(e.g. state populations). For labs collecting specimens from subsets of state populations or
populations that cross multiple states, choose “Other” and enter the estimated size of the
entire population under consideration. This calculator uses this number and the
assumptions above to estimate the weekly number of MA-ILI cases.
• Surveillance Scale: Indicate whether surveillance is being conducted at the national or
state/regional level using the surveillance scale dropdown menu. The default is state
because the investigation of the rare/novel influenza event would usually occur locally.
This means that all states are able to calculate the number of specimens to test for an
investigation of a rare/novel influenza event at a specific threshold within their state. At a
national scale means that all states are contributing to a national surveillance effort
proportional to their population size. The number of samples that a state PHL needs to
test is apportioned based on population size. Note: the sample size for an individual state
at the same threshold (e.g. 1/200 or 1/700) will be significantly larger than that needed
for the national threshold.
• Expected prevalence of Rare+/Flu+: Set the expected Rare+/Flu+ using the slider. This is
the percent positivity of the rare/novel influenza event that the PHL wants to confirm has
not been exceeded.
• Confidence Level: Set the confidence level using the slider. The optimal level of
confidence is 95%, the minimum should be no less than 85%. The prevalence threshold is
the highest value for the prevalence of the rare/novel influenza virus (Rare+/Flu+) that the
PHL hope to establish with the specified level of confidence. The higher the confidence
level, the more confident the PHL can be that the true level of Rare+/Flu+ in the
population falls below the prevalence threshold. Intuitively, high confidence levels and
small prevalence thresholds require many samples.
• Expected prevalence of Flu+/MA-ILI: Set the expected Flu+/MA-ILI using the slider. This is
an input only when calculating the number of MA-ILI needed, or the number of combined
MA-ILI and Flu+ specimens. The default value is 10% for the beginning and end of the
influenza season. Other percent positive values may be used based on jurisdictional

31
preferences or seasonal variability in the prevalence of ILI or influenza. For example, if the
PHL would like to detect when Flu+/MA-ILI crosses the 10% threshold at the beginning of
the influenza season, then move the slider to 10%. If instead the plan is to estimate
Flu+/MA-ILI later in the season, when it is closer to 30%, then move the slider to 30%.
Note: the actual prevalence (Flu+ /MA-ILI) may differ from the estimated prevalence;
however, the approximation still provides an important baseline for determining sample
sizes.
• Prevalence threshold: (Applicable for Calculator C: Rare/Novel Influenza Event
Investigation: Tab 3: Combined Samples) Set the desired prevalence threshold using the
slider. This is an input for the prevalence of the rare/novel influenza virus which is
expected to be established with a specified level of confidence.
• Flu+ Sample Size: Input the number of Flu+ samples.
• MA-ILI Sample Size: Input the number of MA-ILI samples.
Calculator C: Rare/Novel Influenza Event Investigation: Tab 1: Flu+ Sample Size
Tab 1 is used to determine the minimum sample size (of Flu+ specimens) needed to estimate
that the prevalence of rare/novel influenza (Rare+/Flu+) does not exceed a specified prevalence
threshold (Rare+/Flu+) with a specified confidence. This tab utilizes equations 11 and 12.

32
Instructions:
After setting the (1) total population, (2) surveillance scale, (3) expected Rare+/Flu+ and (4)
confidence level, a graph and table of minimum Flu+ sample sizes and prevalence thresholds
(Rare+/Flu+) is generated.
By clicking on the curve, the precise combination of minimum sample sizes and prevalence
threshold are shown. The text below the plot will change as different prevalence thresholds are
selected.
For example, if the PHL is conducting surveillance in Alabama, with an expected Rare+/Flu+ of
1% and a confidence level of 95% and a prevalence threshold of 3% is selected the text will read,
“To be 95% confident that the actual prevalence of the rare/novel influenza virus does not
exceed 1% (+/- 2%) of Flu+ specimens (within the population under surveillance), the PHL must
test 173 Flu+ specimens.”
Calculator C: Rare/Novel Influenza Event Investigation: Tab 2: MA-ILI Sample Size
Tab 2 is used to determine the minimum sample size (of unscreened MA-ILI specimens) needed
to estimate the prevalence of rare/novel influenza (Rare+/Influenza+) event does not exceed a
specified prevalence threshold (Rare+/Flu+) with a specified confidence. This tab utilizes equations
11 and 12.

33
Instructions:
After setting the (1) total population, (2) surveillance scale, (3) expected Rare+/Flu+, (4)
confidence level and (5) expected Flu+/MA-ILI, a graph and table of minimum MA-ILI sample
sizes and prevalence thresholds (Rare+/Flu+) is generated.
By clicking on the curve, the precise combination of minimum sample sizes and prevalence
threshold are shown. The text below the plot will change as different prevalence thresholds are
selected.
For example, if the PHL is conducting surveillance in Alabama, with an expected Rare+/Flu+ of
1%, a confidence level of 95%, and an expected Flu/MA-ILI of 10% and a prevalence threshold of
3% is selected the text will read, “To be 95% confident that the actual prevalence of the
rare/novel influenza virus does not exceed 3% (+/- 2%) of Flu+ specimens (within the population
under surveillance), the PHL must test 1,721 MA-ILI specimens.” Note: the substantial increase
in sample size as compared to sampling only Flu+ specimens.
Calculator C: Rare/Novel Influenza Event Investigation: Tab 3: Combined Samples
Tab 3 is used to determine the minimum combinations of Flu+ and unscreened MA-ILI sample
sizes needed to detect a rare/novel influenza with prevalence (Rare+/Flu+) that has reached a
specified detection threshold and confidence level. Note: many more unscreened MA-ILI
specimens are typically required than Flu+ specimens to achieve the same power of detection,
particularly when the overall prevalence of influenza (Flu+/MA-ILI) is low. This tab utilizes
equations 11 and 12.

34
Instructions:
After setting the (1) total population, (2) surveillance scale, (3) expected Rare+/Flu+, (4)
confidence level, (5) expected Flu+/MA-ILI and (6) prevalence threshold, a graph and table of
minimum sample sizes of Flu+ and MA-ILI samples is generated.
By clicking on the curve, the precise combination of minimum sample sizes required are shown.
The text below the plot will change as different combinations of Flu+ and MA-ILI are selected.
For example, if the PHL is conducting surveillance in Alabama, with an expected Rare+/Flu+ of
1%, a confidence level of 95%, an expected Flu/MA-ILI of 10%, and a prevalence threshold of 3%
and an estimated 80% MA-ILI and 20% Flu+ specimen type combination is selected the text will
read, “To be 95% confident that the true prevalence of the rare/novel influenza virus does not
exceed 3% (+/- 2%) of Flu+ specimens (within the population under surveillance), the PHL must
test 501 MA-ILI and 122 Flu+ specimens (with 10% Flu+/MA-ILI prevalence). This assumes an
estimated prevalence of the rare type among all flu specimens (Rare+/Flu+) is 1%.”
Calculator C: Rare/Novel Influenza Event Investigation: Tab 4: Data Confidence
Tab 4 is used to determine the best combination of prevalence threshold and confidence
level achievable for a specified sample size (number of Flu+ and unscreened MA-ILI specimens

35
to be tested). Note: there is a trade-off between confidence level and prevalence threshold. The
lower the prevalence threshold, the smaller the confidence, and vice versa. This tab utilizes
equations 11 and 12.
.
Instructions:
After setting the (1) total population, (2) surveillance scale, (3) expected Rare+/Flu+, (4) Flu+
sample size, (5) MA-ILI sample size, and (6) expected Flu+/MA-ILI, a graph and table of
prevalence threshold and confidence levels is generated.
By clicking on the curve, the precise combination of confidence level and prevalence threshold
are shown. The text below the plot will change as different confidence levels are selected.
For example, if the PHL is conducting surveillance in Alabama, with an expected Flu+/MA-ILI of
10% and a sample size of 75 Flu+ and 300 MA-ILI samples and a confidence level of 75% is
chosen the output will read, “If a combination of 75 Flu+ specimens and 300 unscreened MA-ILI
specimens were tested, and the estimated prevalence of the rare/novel influenza virus among
all flu positive specimens (Rare+/Flu+) is 1%, the PHL can be 75.34% confident that the true
prevalence does not exceed 2.04% (+/-1%) within the population under surveillance. This
assumes that 10% of MA-ILI patients are Flu+.” Note: the confidence level increases as the
prevalence threshold increases.
36
Appendix: Equation 12
