NORTH CAROLINA RED DRUM
FISHERY MANAGEMENT PLAN
AMENDMENT I
PREPARED BY THE
RED DRUM FISHERY MANAGEMENT PLAN
ADVISORY COMMITTEE
AND THE
NORTH CAROLINA DIVISION OF MARINE FISHERIES
DEPARTMENT OF ENVIRONMENT AND NATURAL RESOURCES
MOREHEAD CITY, NORTH CAROLINA
November, 2008
NC red drum stock assessment completed April 2007
MFC approves FMP for public comment January 2008
Finalize RDAC and DMF recommendations March/April 2008
MFC selects preferred management options April 2008
Submitted to DENR for review May 2008
Submitted to JLCSA May 2008
Draft rules approved for notice to text June 2008
Public hearings on draft rules October 2008
MFC selects rules and adopts plan November 2008

ii
1. ACKNOWLEDGEMENTS
Amendment 1 to the North Carolina Red Drum Fishery Management Plan (FMP) was
developed by the North Carolina Department of Environment and Natural Resources’
Division of Marine Fisheries (DMF) under the direction of the North Carolina Marine
Fisheries Commission (MFC) with the advice of the Red Drum Public Advisory Committee.
Deserving special recognition are the members of the Red Drum Public Advisory
Committee and the Plan Development Team who contributed their time and knowledge to
this effort.
Red Drum Public Advisory Committee
Charlie Adams, co-chair
Dr. Fred Scharf, co-chair
Eugene Balance
George Beckwith
Frank Folb
Thomas Hardison
Sarah Jackson
William Mandulak
Tommy McArthur
Bernie McCants
Norman Miller
Ken Siegler
David Smith
Dr. Christopher Taylor
Red Drum Plan Development Team
Lee Paramore, co-lead
Fritz Rohde, co-lead
Chris Batsavage
Alan Bianchi
Dr. Scott Crosson
Ann Deaton
Eric Fitzpatrick
Jim Kelley
Helen Takade
iii
2. TABLE OF CONTENTS
1. ACKNOWLEDGEMENTS ................................................................................................... ii
2. TABLE OF CONTENTS ...................................................................................................... iii
3. EXECUTIVE SUMMARY ....................................................................................................1
4. INTRODUCTION...................................................................................................................7
4.1 Legal Authority for Management.......................................................7
4.2 Goals and Objectives...........................................................................8
4.3 Sustainable Harvest.............................................................................9
4.4 Management Unit................................................................................9
4.5 General Problem Statement ................................................................9
4.6 Interim Measures.................................................................................9
4.7 Existing Plans, Statutes, and Rules...................................................10
4.7.1 Existing Plans ..............................................................................10
4.7.2 Statutes.........................................................................................11
4.7.3 Rules ............................................................................................12
5. GENERAL LIFE HISTORY................................................................................................16
5.1 Description and Distribution.............................................................16
5.2 Reproduction and Development .......................................................16
5.3 Diet and Food Habits.........................................................................18
5.4 Migration Patterns.............................................................................19
6. STATUS OF STOCKS ..........................................................................................................20
7. DESCRIPTION OF FISHERIES........................................................................................22
7.1 Commercial Fishery..........................................................................22
7.2 Recreational Fishery..........................................................................28
8. DESCRIPTION OF THE SOCIOECONOMIC CHARACTERISTICS OF THE
FISHERY....................................................................................................................................32
8.1 Economic Aspects of the Fishery .....................................................32
8.1.1 Ex-Vessel Value and Price ..........................................................32
8.1.2 Participants and Trips ..................................................................34
8.1.3 Economic Impact of Commercial Fishery...................................36
8.1.4 Recreational Fishery Economics .................................................37
8.2 Social Aspects of the Fishery............................................................38
8.2.1 Commercial Fishermen................................................................38
8.3.1 Recreational Fishery ....................................................................41
8.4 Research Recommendations.............................................................42
8.5 Definitions and Acronyms ................................................................42
9. ENVIRONMENTAL FACTORS........................................................................................43
9.1 Habitat................................................................................................43
9.1.1. Water column...............................................................................43
9.1.2. Wetlands ......................................................................................45
9.1.3. Submerged Aquatic Vegetation...................................................46
9.1.4. Soft bottom...................................................................................48
iv
9.1.5. Shell bottom.................................................................................49
9.1.6. Nursery habitat preference...........................................................50
9.1.7. Habitat condition..........................................................................51
9.2 Water Quality.....................................................................................59
9.2.1 Water quality status .....................................................................60
9.2.2 Water quality stressors.................................................................62
9.3 Habitat and Water Quality Protection...............................................66
9.4 Recommended Management Actions...............................................71
9.4.1 Environmental Factors.................................................................71
10. PRINCIPAL ISSUES AND MANAGEMENT OPTIONS..............................................72
10.1 Identification of Issues ......................................................................72
10.1.1 Issues Addressed in this Plan.......................................................72
10.2 Issues and Management Strategies...................................................72
10.2.1 Adult Harvest Limits ...................................................................72
10.2.2 Recreational Targeting of Adult Red Drum ................................80
10.2.3 Recreational Bag and Size Limits................................................87
10.2.4 Commerical Harvest Limits.........................................................94
10.2.5 Red Drum Discarded Bycatch in the Estuarine Gill Net Fishery103
11. MANAGEMENT PROGRAM .........................................................................................169
11.1 Data Needs.......................................................................................169
11.2 Management Strategies and Proposed Actions..............................171
11.2.1 Adult Harvest Limits .................................................................171
11.2.2 Recreational Targeting of Adult Red Drum ..............................171
11.2.3 Recreational Bag and Size Limits..............................................172
11.2.4 Commercial Harvest Limits.......................................................172
11.2.5 Bycatch in the Estuarine Gill Net Fishery .................................174
11.3 Habitat and Water Quality Management Recommendations........176
11.4 Research Needs Summary ..............................................................176
11.5 Review Cycle...................................................................................177
12. LITERATURE CITED ....................................................................................................178
Appendix 1 – Rule Changes Necessary to Implement Red Drum FMP Amendment One.192
Appendix 2. Active and Complete NC Red Drum FMP Management Issues...................197
Appendix 3 – Stock Status of the Northern Red Drum Stock………….…………….Attached
v
List of Tables
Table 1. Primary harvest limits for recreational and commercial fisheries within each of
the regulation periods.............................................................................................. 21
Table 2. Annual commercial landings (lb) of red drum by state along the mid-Atlantic
coast......................................................................................................................... 24
Table 3. Percentage of commercial landings of red drum in North Carolina by major
water bodies............................................................................................................. 27
Table 4. Red drum catches for recreational anglers (MRFSS), for 1989 - 2005. All
weights are in pounds. Commercial weights are included as a reference
with combined weights reported............................................................................. 29
Table 5. Recreational harvest (pounds of A + B1 fish) of red drum along the Atlantic
coast, 1981-2005 (NMFS, Office of Science & Technology)................................. 30
Table 6. The number of award citations issued on an annual basis for catches of red
drum. Citations are awarded for releases ≥ 40 in and weigh-ins* ≥ 45 lb............. 31
Table 7. Detail values of red drum landed, total value, deflated value, price per pound,
and percent change from year to year for red drum landed in North
Carolina, 1972—2005. DMF Trip Ticket Program................................................. 33
Table 8. Number of participants and the number of trips taken that landed red drum in
North Carolina, 1999 - 2005 (DMF Trip Ticket Program)..................................... 35
Table 9. Number of participants in the red drum fishery by value of landings and year
in North Carolina, 1999—2005. DMF Trip Ticket Program................................. 35
Table 10. Economic impact of the commercial red drum fishery in North Carolina,
2000—2005. DMF Trip Ticket Program, IMPLAN.............................................. 37
Table 11. Estimated number of red drum-related recreational fishing trips. MRFSS
Program................................................................................................................... 37
Table 12. Estimated expenditures of drum-related recreational fishing trips. MRFSS
Program................................................................................................................... 37
Table 13. Demographic characteristics of red drum commercial fishermen. DMF
Socioeconomic Program. ........................................................................................ 39
Table 14. Prevalent species targeted by red drum commercial fishermen. DMF
Socioeconomic Program. ........................................................................................ 39
Table 15. Fishing related issues considered most important to fishermen who landed
drum. DMF Socioeconomic Program. ................................................................... 40
Table 16. Demographic characteristics of red drum RCGL fishermen. DMF RCGL
Program................................................................................................................... 41
Table 17. DWQ 401 permitted wetland impacts (acres) in coastal river basins inhabited

vi
by red drum, 2001-2006 (DWQ, unpubl. data, R. Ridings, 2007).......................... 52
Table 18. Impaired water ratings for Aquatic Life and Shellfish Harvest Use Support
categories in six coastal river basins (DWQ 2002a,b, 2003, 2004, 2005,
2007)........................................................................................................................ 61
Table 19. Reported fish kills in coastal river basins supporting red drum, 1996-2006
(DWQ 2006)............................................................................................................ 64
Table 20. North Carolina red drum catches for recreational anglers (MRFSS), for 1989
– 2005 with PSE. All weights are in pounds. Commercial weights are
included as a reference, and combined weights are reported.................................. 88
Table 21. Average annual landings of red drum by fishing sector and management
period....................................................................................................................... 88
Table 22. Potential bag and size limit combinations that are projected by the bag and
size limit analysis to achieve the 40% SPR. ........................................................... 89
Table 23. Percent non-compliance (red drum harvested that were <18 or >27 inches
total length) and the percent of fish measured that would be illegal if
either a 19 inch minimum or a 26 inch maximum size limit were put into
place. Samples from MRFSS 1993 to 2006........................................................... 92
Table 24. Fate of legal size red drum (n=1,246) in the large mesh estuarine gill net
fishery. NCDMF observer data from 2001 to 2006 (n=1,470 trips
sampled) .................................................................................................................. 99
Table 25. Anchored estuarine gill net trips with the species of highest abundance
landed (target species) being used to define a trip................................................ 106
Table 26. Annual landings of major species in North Carolina’s anchored estuarine gill
net fishery.............................................................................................................. 106
Table 27. Large mesh (>
5 inch) gill net fishery parameters commonly associated with
the targeting of various species, 2001-2006.......................................................... 107
Table 28. Small mesh (< 5 inch) gill net fishery parameters commonly associated with
the targeting of various species, 2001-2006.......................................................... 108
Table 29. Observed estuarine gill net trips by month and year from the North Carolina
observer program................................................................................................... 115
Table 30. Estimated dead discards (number and weight) of red drum from the large
mesh estuarine gill net fishery............................................................................... 117
Table 31. Estimated dead discards (number and weight) of red drum from the small
mesh estuarine gill net fishery............................................................................... 118
Table 32. Estimated release mortalities (number and weight) of red drum from the large
mesh estuarine gill net fishery............................................................................... 119
Table 33. Estimated release mortalities (number and weight) of red drum from the
small mesh estuarine gill net fishery..................................................................... 120
vii
Table 34. Estimated number and pounds of red drum harvested and the number of red
drum discarded using the Recreational Commercial Gear License in North
Carolina................................................................................................................. 122
Table 35. Estimated dead discards from large mesh RCGL gill nets........................................ 123
Table 36. Summary of all estimated discard mortalities in pounds associated with the
anchored estuarine gill net fishery. ....................................................................... 124
Table 37. Summary of all estimated discard mortalities in numbers associated with the
anchored estuarine gill net fishery. ....................................................................... 124
Table 38. Estimated total takes from the red drum population by year from the
recreational hook and line fishery......................................................................... 124
Table 39. Independent gill net survey CPUE for sub-legal red drum (<18 inches TL)
captured in shallow (<6 ft) versus deep (>6 ft) sets from 2001 to 2005............... 126
Table 40. Sub-legal red drum CPUE from the NCDMF independent gill net survey
with percent reductions in CPUE based on establishing 50, 100, and 200
yard buffers from shorelines for gill nets.............................................................. 127
Table 41. Sub-legal red drum acute mortality from capture in small and large mesh gill
nets from the NCDMF independent gill net survey, 2001 to 2006. Based
on 12-hour soak time............................................................................................. 128
Table 42. CPUE of southern flounder captured in IGNS from 2001 to 2006 in gill net
sets made either less than or greater than 50 yards from shore............................. 130
Table 43. Average annual landings, trips and value of key species captured in the
estuarine gill net fishery before (1994-1998) and after (1999-2006) the
small mesh gill net rules were implemented. Species included are those
typically taken in the small mesh gill net fishery. These data include both
anchored and run-around gill net landings............................................................ 133
Table 45. Average monthly landings (pounds) for targeted small mesh gill net species
in the Neuse River, NC 2001 – 06, set nets only. ................................................. 145
Table 46. Average monthly landings (pounds) for targeted small mesh gill net species
in the Pamlico, Pungo rivers, NC 2001 – 06, set nets only................................... 145
Table 47. Species composition from Program 462, Estuarine Gill Net Selectivity Study,
Neuse River NC, October, 2005 - 06. ................................................................... 146
Table 48. Species composition from Program 462, Estuarine Gill Net Selectivity Study,
Neuse River NC, November - December, 2005 - 06............................................. 147
Table 49. Program 915 sampling effort and number of red drum by month in shallow
(<6ft) and deep (>6ft) water gill net sets. Data is combined for all river
systems sampled, Pamlico, Pungo and Neuse rivers. Set is defined as each
30 yard net (3 ½, 4, and 4 ½”)............................................................................... 148
Table 50. Neuse River species composition data from Program 915, Pamlico Sound
Independent Gill Net Survey, October, 2005 - 06................................................. 149
viii
Table 51. Pamlico and Pungo rivers species composition data from Program 915,
Pamlico Sound Independent Gill Net Survey, October, 2005 - 06....................... 150
Table 52. Neuse River species composition data from Program 915, Pamlico Sound
Independent Gill Net Survey, November - December 2005 - 06.......................... 151
Table 53. Pamlico and Pungo rivers species composition data from Program 915,
Pamlico Sound Independent Gill Net Survey, November - December 2005
- 06......................................................................................................................... 152
Table 54. Program 462 mortality estimates for red drum by mesh and month for Neuse
River, NC, 2005 and 2006 (N = Number captured).............................................. 155
Table 55. Program 915 mortality estimates for red drum by mesh and month for Neuse
River, NC, 2005 and 2006 (N = Number captured).............................................. 155
Table 56. Program 915 mortality estimates for red drum by mesh and month for
Pamlico Pungo rivers NC, 2005 and 2006 (N = Number captured). .................... 155
Table 57. Neuse River estimated red drum CPUE for commercial small mesh fishery
from October – December (2005-06 combined). Data from Program 915-
Pamlico Sound Independent Gill Net Survey, Program 462-Estuarine Gill
Net Selectivity Study and Program 461 – Estuarine Gill Net Sampling
were used to estimate commercial discards. ......................................................... 157
Table 58. Neuse River estimated number of red drum captured in commercial small
mesh gill nets based on mortality and month from October – December
(2005-06 combined). Data from Program 915- Pamlico Sound
Independent Gill Net Survey, Program 462-Estuarine Gill Net Selectivity
Study, and Trip Ticket Program were used to estimate commercial
mortality. ............................................................................................................... 158
Table 59. Pamlico - Pungo river estimated red drum CPUE for commercial small mesh
fishery from October – December (2005-06 combined). Data from
Program 915- Pamlico Sound Independent Gill Net Survey, Program 462-
Estuarine Gill Net Selectivity Study, and Program 461 – Estuarine Gill
Net Sampling were used to estimate commercial discards. .................................. 159
Table 60. Pamlico - Pungo estimated number of red drum captured in commercial
small mesh gill nets based on mortality and month from October –
December (2005-06 combined). Data from Program 915- Pamlico Sound
Independent Gill Net Survey and Trip Ticket Program were used to
estimate commercial mortality.............................................................................. 159
Table 61. Percentage of reported trips in the Neuse River using various types of gill
nets before the attendance rule was implemented (1994 - 1998), and after
it was implemented................................................................................................ 160
Table 62. Percentage of reported trips in the Pamlico/Pungo river complex using
various types of gill nets before the attendance rule was implemented
(1994 -1998), and after it was implemented. ........................................................ 161
ix
Table 63. Percent contribution (landings) of targeted species for small mesh gill net
fisheries by gear type (set nets, and run around), pre and post small mesh
attendance rules, Pamlico, Pungo, and Neuse rivers landings data
combined. 1994 – 2006, trip ticket data............................................................... 162
x
List of Figures
Figure 1. Red drum spawning sites identified in the Bay River and Ocracoke Inlet areas
through acoustic sampling (Luczkovich et al., 1999). ............................................ 17
Figure 2. Summary of the stock status for the northern region red drum stocks during
the early (1987 – 1991), mid (1992 – 1998) and late (1999 – 2005)
regulatory periods.................................................................................................... 21
Figure 3. Annual commercial landings of red drum in North Carolina....................................... 25
Figure 4. Length frequency of red drum sampled from the North Carolina commercial
harvest (all gears combined) for the periods 1987-1991, 1992-1998, and
1999-2005................................................................................................................ 25
Figure 5. Percent landings of red drum by gear type for each harvest period............................. 26
Figure 6. Value of red drum landings in North Carolina, 1972 – 2005. DMF Trip
Ticket Program........................................................................................................ 32
Figure 7. Average price per pound of red drum landings in North Carolina, 1972 -
2005. DMF Trip Ticket Program. .......................................................................... 34
Figure 8. Number of dealers who purchased red drum from 1994—2005. DMF Trip
Ticket Program........................................................................................................ 36
Figure 9. Reported conflicts of Commercial Fishermen (DMF Socioeconomic Progam).......... 40
Figure 10. Perceptions of Recreational Commercial Gear License Holders. (DMF
RCGL Program)...................................................................................................... 42
Figure 11. Location of esturarine and riverine wetlands in coastal North Carolina,
based on 1994 DCM mapping data (Street et al. 2005).......................................... 46
Figure 12. Distribution of known submerged aquatic vegetation habitat in North
Carolina (Street et al. 2005). ................................................................................... 48
Figure 13. MFC designated fishery nursery areas....................................................................... 58
Figure 14. Location of North Carolina river basins (http://h2o.enr.state.nc.us/basinwide) ......... 61
Figure 15. Reported annual fish kill events in coastal river basins supporting red drum,
1996-2006. Includes Pasquotank, Tar-Pamlico, Neuse, White Oak, Cape
Fear, and Lumber river basins................................................................................. 64
Figure 16. Cumulative percent frequency at size for adult red drum tagged in Ocracoke
Inlet from the NCDMF Red Drum Volunteer Tagging Program during the
early (1986-1991), mid (1992-1997) and late (1999-2005) management
periods..................................................................................................................... 74
Figure 17. Length frequency distributions of red drum from the commercial estuarine
gill net fishery during the early (1986-91), middle (1992-98) and late
xi
(1999-04) management periods............................................................................... 74
Figure 18. Length frequency distribution of adult red drum from the NCDMF
Volunteer Tagging Program, 1984-2006. ............................................................... 76
Figure 19. Average, minimum and maximum ages for adult red drum per one inch size
class, 37-56 in TL.................................................................................................... 76
Figure 20. Probability of success for anglers targeting red drum recreationally.
Successful trip defined as a trip that targeted and landed red drum........................ 90
Figure 21. Recreational fishing effort (number of trips) from 1981 to 2006. Source
MRFSS.................................................................................................................... 91
Figure 22. Number of participants in North Carolina recreational fishery (coastal, non-
coastal and non-resident)......................................................................................... 91
Figure 23. Length frequency distribution of red drum observed in MRFSS survey by
region from 1993 to 2006........................................................................................ 92
Figure 24. Annual commercial landings of red drum from 1950 to 2006................................... 95
Figure 25. Proportion of commercial red drum ladings by gear type from 1987 to 2006........... 96
Figure 26. Percentage of estuarine gill net trips that did or did not capture the seven
fish bycatch allowance. Given for all trips sampled and for all trips
sampled where red drum were present.................................................................... 98
Figure 27. Monthly landings by region for common species targeted in the large mesh
estuarine gill net fishery........................................................................................ 111
Figure 28. Monthly landings by region for common species targeted in the small mesh
estuarine gill net fishery........................................................................................ 112
Figure 29. Map of Pamlico Sound and associated rivers showing the sample strata and
locations of individual samples taken in the NCDMF independent gill net
survey from 2001 to 2006. .................................................................................... 126
Figure 30. Sub-legal red drum (<18 inches TL) CPUE by month and region from the
Pamlico Sound independent gill net survey from 2001 to 2005........................... 127
Figure 31. Mean water temperature (
o
F) and percent acute mortality (at the net) for sub-
legal red drum captured in small and large mesh gill nets by month.................... 128
Figure 32. Potential impact of large mesh gill nets per unit of effort based on the
availability of sub-legal red drum (CPUE from IGNS) and the % acute
mortality associated with capture in a gill net by month. Based on
samples collected from 2001 to 2006.................................................................... 131
Figure 33. Potential impact of small mesh gill nets per unit of effort based on the
availability of sub-legal red drum (CPUE from IGNS) and the % acute
mortality associated with capture in a gill net by month. Based on
samples collected from 2001 to 2006.................................................................... 132
Figure 34. Program 462 gill net sampling areas........................................................................ 140
xii
Figure 35. Independent gill net (Program 915) sampling grids for the Neuse, Pamlico,
and Pungo, rivers................................................................................................... 141
Figure 36. Reported landings for targeted small mesh gill net species. River includes
Pamlico, Pungo, and Neuse rivers; other includes all other estuarine
waters of the state. Targeted species are bluefish, red drum, kingfish,
Spanish mackerel, Atlantic Menhaden (bait), striped mullet, white perch,
spotted seatrout, spot, and weakfish...................................................................... 142
Figure 37. Numbers of trips for targeted small mesh gill net species. River includes
Pamlico, Pungo, and Neuse rivers; other includes all other estuarine
waters of the state.................................................................................................. 142
Figure 38. Numbers of participants targeting small mesh gill net species. River
includes Pamlico, Pungo, and Neuse rivers; other includes all other
estuarine waters of the state. ................................................................................. 143
Figure 39. Red drum length frequency from October - December 2005 and 2006 from
Neuse River, NC. Samples taken from NCDMF Program 462 independent
Estuarine Gill Net Sampling. ................................................................................ 153
Figure 40. Red drum length frequency from October-December 2005 and 2006 from
Neuse River, NC. Samples taken from NCDMF Program 915 Pamlico
Sound Independent Gill Net Survey...................................................................... 154
Figure 41. Red drum length frequency from October-December 2005 and 2006 from
Pamlico, Pungo rivers, NC. Samples taken from NCDMF Program 915
Pamlico Sound Independent Gill Net Survey. ...................................................... 154
Figure 42. Neuse River small mesh gill net trips (all gears combined), and overall trend
for gill net trips in this river, 1994 – 2006. ........................................................... 160
Figure 43. Pamlico, Pungo rivers small mesh gill net trips (all gears combined), and
overall trend for gill net trips in this system, 1994 – 2006. .................................. 161
Figure 44. Map of the current gill net attendance area along the Outer Banks. The
black-dashed line denotes the modified attended gill net area (AGNA)
along the Outer Banks of Pamlico Sound. Proposed changes to “Area 1”
near Rodanthe and “Area 2” behind Hatteras would allow for additional
deep water areas to be fished outside the attendance area. ................................... 166
3. EXECUTIVE SUMMARY
Goals and Objectives
The goal of Amendment 1 to the North Carolina Red Drum Fishery Management Plan
(FMP) is to prevent overfishing in the red drum (Sciaenops ocellatus) stocks by allowing the
long-term sustainable harvest in the red drum fishery. To achieve these goals, it is recommended
that the following objectives be met:
1. Achieve and maintain a minimum overfishing threshold where the rate of juvenile
escapement to the adult stock is sufficient to maintain the long-term sustainable
harvest in the fishery.
2. Establish a target SPR to provide the Optimum Yield (OY) from the fishery in order
to maintain a state FMP that is in compliance with the requirements of the Atlantic
States Marine Fisheries Commission (ASMFC) Red Drum FMP.
3. Continue to develop an information program to educate the public and elevate their
awareness of the causes and nature of problems in the red drum stock, its habitat and
fisheries, and explain the rationale for management efforts to solve these problems.
4. Develop regulations that while maintaining sustainable harvest from the fishery,
considers the needs of all user groups and provides adequate resource protection.
5. Promote harvest practices that minimize the mortality associated with regulatory
discards of red drum.
6. In a manner consistent with Coastal Habitat Protection Plan (CHPP), restore, improve
and protect essential red drum habitat and environmental quality to increase growth,
survival, and reproduction of red drum.
7. Improve our understanding of red drum population dynamics and ecology through the
continuation of current studies and the development of better data collection methods,
as well as, through the identification and encouragement of new research.
8. Initiate, enhance, and continue studies to collect and analyze the socio-economic data
needed to properly monitor and manage the red drum fishery.
Stock Status
The current stock status of red drum in North Carolina waters indicates that the stock is
currently not undergoing overfishing. More restrictive management measures in place as a result
of the 2001 North Carolina Red Drum FMP have effectively reduced fishing mortality. The
primary benchmarks in determining the stock status, spawning potential ratio (SPR) and
escapement are currently at or near target levels. It is critical to note that reaching the target is
only the first step in maintaining this fishery. In order for the red drum stock to be considered
healthy and viable, the 40% SPR target must be maintained continuously over time. Increases in
1
the harvest rates (relaxation of current regulations) of red drum should only be allowed if those
increases are not anticipated to lower the SPR values below the overfishing definition.
Commercial and Recreational Fisheries
While landings typically peak in the fall, red drum are harvested commercially and
recreationally on a year round basis throughout North Carolina’s estuarine and nearshore coastal
waters. Commercially, red drum are harvested using a variety of gears and have traditionally
been harvested as bycatch in fisheries targeting other species. A directed fishery using run-
around gillnets did develop in the mid-1990’s. Regulations implemented through the 2001 Red
Drum FMP prohibit the targeting of red drum and restrict commercial harvest to a daily trip
limit. As a bycatch fishery, anchored gill nets account for the vast majority of the commercial
landings. The commercial dockside value of the red drum fishery is seasonally variable but has
shown an upward trend since the 1970’s. The average price paid per pound has steadily
increased from $0.12 per pound in 1972 to $1.34 per pound in 2005.
Recreational anglers account for about 60% of the annual harvest of red drum. Red drum
are consistently rated as one of the top target species by shore based recreational anglers. Over
time, the practice of catch and release fishing has become an increasingly larger component of
the recreational fishery due both to angler preference and further bag and size limit restrictions.
Economic data on the recreational red drum fishery are occasionally collected through add-on
surveys through the Marine Recreational Fisheries Statistics Survey. The most recent data
estimates that total expenditures of red drum related recreational fishing trips totaled
approximately $50 million in 2004.
Habitat and Water Quality
Red drum utilize a variety of estuarine and oceanic habitats throughout their life cycle.
Each habitat type provides ecological services that aid in maintaining and enhancing the red
drum population, and also influences the functioning of the ecosystem overall. The South
Atlantic Fishery Management Council has recognized areas of Essential Fish Habitat (EFH) and
Habitat Areas of Particular Concern (HAPC) for red drum. In North Carolina the primary EFH
areas include flooded salt marsh, fresh and brackish marsh, tidal creeks, submerged rooted
vascular plants (sea grass), oyster reefs and shell banks, soft sediment bottom, ocean high
salinity surf zones and artificial reefs. HAPC are those areas that are known to be critical to a
particular life history stage for red drum, including spawning areas and nursery grounds. These
areas include all coastal inlets, state-designated nursery habitats known to be important to red
drum, currently known spawning sites and any future designated sites of spawning activity and
areas supporting submerged aquatic vegetation (SAV).
At the state level, North Carolina has developed a strategy to protect and restore habitats
critical to North Carolina’s coastal fishery resources through the implementation of the Coastal
Habitat Protection Plan (CHPP). This plan recognizes those habitats that have been identified to
provide critical habitat functions or that are particularly at risk due to imminent threats,
vulnerability or rarity. Areas meeting these criteria are to be designated as “Strategic Habitat
2

Areas” (SHAs) and given the highest priority for protection. In addition to its overall goals, the
CHPP has specific recommendations that will benefit habitat used by red drum. Additional red
drum habitat research needs identified in the Red Drum FMP are:
• Determine juvenile habitat preference and examine if recruitment is habitat limited.
• Examine ecological use and importance of shell bottom to red drum.
• Identify coastal wetlands and other habitats utilized by juvenile red drum and assess
relationship between changes in recruitment success and changes in habitat conditions.
• Assess cumulative impact of large-scale beach nourishment and inlet dredging on red
drum and other demersal fish that use the surf zone.
• Determine location and significance of spawning aggregation sites throughout the coast.
• Determine if navigational dredging between August and October significantly impacts
spawning activity.
• Determine if designation of spawning areas by MFC is needed, and if specific protective
measures should be developed.
Management Issues and Proposed Actions
In the development of Amendment 1 to the Red Drum FMP, management options were
developed for identified key issues through the FMP process. These issues and options were
developed by the NCDMF through the cooperation and advice solicited from the Red Drum
Advisory Committee (RDAC), MFC, Finfish and Regional Advisory committees, public, as well
as the scientific community. The MFC selected preferred management strategies for each of the
key issues at their November 6-7, 2008 business meeting. A summary of the key issues along
with the selected MFC management strategies are listed in the following table (Any
changes/additions to current rules or proclamations are underlined and italicized in the table):
ISSUE
MFC SELECTED MANAGEMENT
STRATEGY
OBJECTIVES
ADDRESSED
REGULATORY
ACTION
Adult Harvest Limits Status quo (no harvest over 27 inches TL) 1 & 2 No action required
Recreational
Targeting of Adult
Red Drum
It is unlawful to use any hook larger than 4/0
from July 1 through September 30 in the
internal coastal fishing waters of Pamlico
Sound and its tributaries south of the
Albemarle Sound Management Area as
defined in 15A NCAC 03R .0201 and north of
a line beginning at a point 34° 59.7942' N -
76° 14.6514' W on Camp Point; running
easterly to a point at 34° 58.7853' N -
76° 09.8922' W on Core Banks while using
natural bait from 7:00 p.m. to 7:00 a.m.
unless the terminal tackle consists of:
(1) A circle hook defined as a hook with the
point of the hook directed perpendicularly
back toward the shank, and with the barb
1, 2 & 5 Rule change
3J .0306
3

either compressed or removed.
(2) A fixed sinker not less than two ounces in
weight, secured not more than six inches
from the fixed weight to the circle hook.
(also continued education on fishing
methods that minimize risk to fish)During
July through September, unlawful to use J-
hooks larger than 4/0 while fishing natural
bait in Pamlico Sound and its tributraries,
excluding the ASMA and Core Sound, south
(also continued education on fishing methods
that minimize risk to fish)
Recreational Bag
and Size Limits
Status quo (one fish per day between 18 and
27 inches TL)
1, 2 & 4 No action required
Commercial Limits
Trip Limit and Bycatch Provision
Status quo (7 fish trip limit with 50% bycatch
provision). Director retains authority
to
modify trip limit and bycatch provision as
needed.
Allow the possession of up to 3 fish while
engaged in fishing without requiring that
they be subject to the bycatch provision.
Upon landing/sale all red drum possessed
would be subject to bycatch provision.
Commercial Cap
Continue 250,000 lb annual cap monitored
from
September 1 to August 31.
Implement a split season on the annual
commercial cap, capping the period of
September 1 to April 30 at 150,000 lb and
conserving the remaining portion of the cap
for the period of May 1 to August 31. Unused
cap in period one would be available for
period two. Any annual commercial harvest
limit that is exceeded one year will result in
the poundage overage being deducted from
the subsequent year’s commercial harvest
limit.
1, 2, 4 & 5
New proclamation
Rule Change
3M .0501
4

Estuarine Gill Net
Discarded Bycatch
of Red Drum
Small Mesh Attendance
(<5” stretch mesh)
Year-round Attendance
Expand year-round attendance within 200
yards of shore to include the area of the
lower Neuse out to the mouth of the river.
Seasonal Attendance
1) Modify the seasonal attendance
requirem
ents for small mesh gill nets
(currently May 1 to October 31) to include
the period of May 1 through
November 30
in
the following locations:
a) All primary and permanent secondary
nursery areas and modified no-trawl areas
b) Within 200 yards of any shoreline for
the areas of Pamlico, Pungo, Neuse and
Bay Rivers and bays
c) Within 50 yards of any shoreline in the
areas of Pamlico and Core Sound south to
the NC/SC line
d) Area Core Sound and south is excluded
from 50 yard shoreline attendance
requirement during October and
November
Modification to current small mesh
seasonal attendance area along the Outer
Banks (i.e. modified no-trawl area)
Modify attendance area between Rodanthe
and Gull Island to straighten out line and
allow for non-attended nets in area of deeper
water
Modify the current attendance line in the
area of Oliver Reef, near Hatteras to allow
for non-attended nets in area of deeper
water.
1, 2, & 5
Rule change
3R .0112
Rule change
3J .0103 &
3R .0112
Rule change
3R .0112
5

Estuarine Gill Net
Discarded By
catch
of Red Drum
Large Mesh (>5” stretch mesh)
Require all unattended large mesh gill nets to
be set a minimum of 10 feet from any
shoreline from June through October
1, 2, & 5
Rule change
3J .0103
The use of gigs,
gaffs or spears to
take red drum.
Continue to prohibit and move Proclamation
FF-40-2001 into rule
1 & 2 Rule change
3M .0501
Rules in place during the development of the Red Drum FMP Amendment 1 are listed in Section
4.7.3. Rules necessary to implement the MFC selected management strategies as outlined in the
this table are provided in Appendix 1.
6
4. INTRODUCTION
4.1 Legal Authority for Management
Fisheries management includes all activities associated with maintenance, improvement,
and utilization of the fisheries resources of the coastal area, including research, development,
regulation, enhancement, and enforcement.
Many different state laws (General Statutes - G.S.) provide the necessary authority for
fishery management in North Carolina. General authority for stewardship of the marine and
estuarine resources by the North Carolina Department of Environment and Natural Resources
(NCDENR) is provided in G.S. 113-131. The North Carolina Division of Marine Fisheries
(DMF) is the arm of the Department which carries out this responsibility. General Statute 113-
163 authorizes research and statistical programs. The North Carolina Marine Fisheries
Commission (MFC) is charged to “manage, restore, develop, cultivate, conserve, protect, and
regulate the marine and estuarine resources of the State of North Carolina” (G.S. 143B-289.51).
The MFC can regulate fishing times, areas, fishing gear, seasons, size limits, and quantities of
fish harvested and possessed (G.S. 113-182 and 143B-289.52). General Statute 143B-289.52
allows the MFC to delegate the authority to implement its regulations for fisheries “which may
be affected by variable conditions” to the Director of DMF who may then issue public notices
called “proclamations.” Thus, North Carolina has a very powerful and flexible legal basis
governing coastal fisheries management. The General Assembly has retained the authority to
establish commercial fishing licenses, but has delegated to the MFC authority to establish free
permits for various commercial fishing gears and activities.
The Fisheries Reform Act of 1997 (FRA 1997) and as ratified in 2004 establishes a
process for preparation of coastal fisheries management plans for North Carolina. The FRA
states: “the goal of the plans shall be to ensure the long-term viability of the State’s
commercially and recreationally significant species or fisheries. Each plan shall be designed to
reflect fishing practices so that one plan may apply to a specific fishery, while other plans may
be based on gear or geographic areas. Each plan shall:
a. Contain necessary information pertaining to the fishery or fisheries, including
management goals and objectives, status of the relevant fish stocks, stock assessments for
multi-year species, fishery habitat and water quality considerations consistent with
Coastal Habitat Protection Plans adopted pursuant to G.S. 143B-279.8, social and
economic impact of the fishery to the State, and user conflicts.
b. Recommend management actions pertaining to the fishery and fisheries.
c. Include conservation and management measures that will provide the greatest overall
benefit to the State, particularly with respect to food production, recreational
opportunities, and the protection of marine ecosystems, and that will produce a
7
sustainable harvest.
d. Specify a time period, not to exceed 10 years from the date of adoption of the plan, for
ending over fishing and achieving a sustainable harvest. This subdivision shall only
apply to a plan for a fishery that is over fished. This subdivision shall not apply to a plan
for a fishery where the biology of the fish or environmental conditions make ending
overfishing and achieving a sustainable harvest within 10 years impracticable.”
Sustainable harvest is defined in the FRA as “The amount of fish that can be taken from a fishery
on a continuing basis without reducing the stock biomass of the fishery or causing the fishery to
become overfished.”
Overfished is defined as “The condition of a fishery that occurs when the spawning stock
biomass of the fishery is below the level that is adequate for the recruitment class of a fishery to
replace the spawning class of the fishery.
Overfishing is defined as “Fishing that causes a level of mortality that prevents a fishery from
producing a sustainable harvest.”
4.2 Goals and Objectives
The goal Amendment 1 to the North Carolina Red Drum Fishery Management Plan
(FMP) is to prevent overfishing in the red drum (Sciaenops ocellatus) stocks by allowing the
long-term sustainable harvest in the red drum fishery. To achieve these goals, it is recommended
that the following objectives be met:
1. Achieve and maintain a minimum overfishing threshold where the rate of juvenile
escapement to the adult stock is sufficient to maintain the long-term sustainable
harvest in the fishery.
2. Establish a target SPR to provide the Optimum Yield (OY) from the fishery in order
to maintain a state FMP that is in compliance with the requirements of the Atlantic
States Marine Fisheries Commission (ASMFC) Red Drum FMP.*
3. Continue to develop an information program to educate the public and elevate their
awareness of the causes and nature of problems in the red drum stock, its habitat and
fisheries, and explain the rationale for management efforts to solve these problems.
4. Develop regulations that while maintaining sustainable harvest from the fishery,
considers the needs of all user groups and provides adequate resource protection.
5. Promote harvest practices that minimize the mortality associated with regulatory
discards of red drum.
6. In a manner consistent with Coastal Habitat Protection Plan (CHPP), restore, improve
and protect essential red drum habitat and environmental quality to increase growth,
survival, and reproduction of red drum.
8
7. Improve our understanding of red drum population dynamics and ecology through the
continuation of current studies and the development of better data collection methods,
as well as, through the identification and encouragement of new research.
8. Initiate, enhance, and continue studies to collect and analyze the socio-economic data
needed to properly monitor and manage the red drum fishery.
*See ASMFC Red Drum FMP compliance requirements in Section 4.7.1 Existing Plans.
4.3 Sustainable Harvest
The FRA mandates that fishery stocks be managed to allow for sustainable harvest and
prevent overfishing. Sustainable harvest for the North Carolina red drum fishery will be defined
as the amount of harvest, including release and discard mortality, that can be taken while
maintaining a SPR at or above 30% the level that would result if fishing mortality did not exist
(F=0). The red drum fishery in North Carolina will be considered to be undergoing overfishing
when the SPR is below 30%.
4.4 Management Unit
The management unit for this FMP includes red drum and the various fisheries that
encounter red drum in all joint and coastal waters throughout North Carolina.
4.5 General Problem Statement
The 2007 stock assessment report indicates that the red drum stock in North Carolina is
currently not experiencing overfishing. The red drum stock was previously experiencing
overfishing from at least 1986 through 1998. No assessment data is available for years prior to
1986. Current management measures are the direct result of the 2001 NC Red Drum FMP and
were implemented at the beginning of FMP development as interim measures to divert
overfishing. The purpose of this plan is to recommend or maintain management measures that
prevent overfishing and provide the long-term sustainable harvest for the fishery. Areas to be
addressed in the management of North Carolina’s red drum fishery are: 1) management
strategies; 2) insufficient data and research needs; 3) habitat and water quality; and 4)
socioeconomic factors.
4.6 Interim Measures
The DMF is required, under the MFC guidelines, to recommend to the appropriate
standing committee(s) any preservation management measures necessary and appropriate to
maintain the well-being of the stock. These measures are intended to prevent further declines for
a stock that is overfished or for a stock that is experiencing overfishing at a level that may
jeopardize the long-term sustainable harvest for the fishery. Currently the red drum stock in
North Carolina is not experiencing overfishing and no interim measures are necessary.
9
4.7 Existing Plans, Statutes, and Rules
4.7.1 Existing Plans
Red drum along the Atlantic coast are managed jointly by the Atlantic States Marine
Fisheries Commission (ASMFC) and the South Atlantic Fishery Management Council
(SAFMC). The ASMFC adopted an FMP for red drum along the Atlantic coast from Maryland
through Florida in 1984 (ASMFC, 1984), then revised the FMP in 1988 when the Interstate
Fisheries Management Program (ISFMP) Policy Board requested that all states from Maine
through Florida implement plan requirements to prevent development of northern markets for
southern fish. The SAFMC Red Drum FMP (SAFMC, 1990) was developed and passed in 1990
and was subsequently adopted as Amendment 1 to the ASMFC Red Drum FMP (ASMFC,
1991). This joint FMP, or Amendment 1, stated that intense fishing mortality on juvenile red
drum in state waters was resulting in reduced recruitment to the adult spawning stock; this
statement was supported by the 1990 stock assessment report which indicated that the red drum
stock was undergoing overfishing with extremely low SPR values ranging from 2-3 percent
(Vaughan, 1990). The plan recommended closing the Exclusive Economic Zone (EEZ) to all
harvest and possession of red drum to protect the adult stock and thereby placed further
regulatory responsibility with the states. Amendment 1 also required that states adopt measures
to prevent overfishing and rebuild the stock to a target of 30% SPR. Rebuilding was scheduled
to occur in steps, starting with an initial goal of 10% SPR. This initial step required states to
adopt one of two options: 1) 18-inch TL minimum, 27-inch TL maximum, and a five fish bag
limit with the option of one fish exceeding 27-inch TL; or 2) 14-inch minimum, 27-inch TL
maximum, and a 5 fish bag limit, with no fish exceeding 27-inches TL. North Carolina adopted
option 1 in 1992.
In 1998, the Council adopted new definitions of OY and overfishing for red drum. OY
was defined as 40% SPR and overfishing was defined as 30% SPR. The 2000 stock assessment
(Vaughan and Carmichael, 2000) showed that SPR increased to 18% in the Northern region for
the period of 1992-1997, indicating that the management measures imposed under Amendment 1
were successful in improving sub-adult recruitment to the adult stock. The initial step of 10%
SPR called for in Amendment 1 was achieved by all states although red drum stocks in both the
Northern and Southern region of the Atlantic coast were still experiencing overfishing. In 1998
North Carolina began the development of a state red drum FMP as a result of the 1997 FRA
which required the management of all recreationally and commercially important species in
North Carolina to be managed for Optimum Yield. North Carolina adopted the definition of
40% SPR to obtain OY as the goal of the state red drum FMP. As a result, North Carolina took
pro-active management measures for a federally managed species with the implementation of the
2001 North Carolina Red Drum FMP. Rules implemented by the state FMP were enacted as
early as October of 1998 as interim measures to prevent further overfishing while the state red
drum FMP was being developed. Harvest restrictions included: restricting all harvest of red
drum to fish between 18 and 27 inches total length, implementing a one fish recreational bag
limit; limiting the commercial fishery with a daily trip limit set by the Director; and maintaining
the previous 250,000 pound commercial cap. In addition, the commercial fishery for red drum
10
was designated as a bycatch fishery. The North Carolina Red Drum FMP was approved in
March of 2001 and maintained all the interim measures.
Amendment 2 of the ASMFC FMP was adopted in 2002 and required that all states
implement management measures projected to result in a 40% SPR by at least January of 2003.
Individual states must maintain these management strategies in order to ensure that overfishing
is not occurring and that OY in the red drum fishery can be obtained. Amendment 2 compliance
requirements to the states include:
• Implementing bag and size limits projected by bag and size limit analysis to
achieve the minimum 40% SPR.
• Establishing a maximum size limit of 27 inches or less in all red drum fisheries.
• Maintaining current or more restrictive commercial fishery regulations.
• Requires any commercial cap overages from one fishing year to be subtracted
from the subsequent years commercial cap.
As a result of the management measures enacted through the state Red Drum FMP of
2001, no new management measures were required for North Carolina in order to comply with
Amendment 2. Amendment 2 did, however, disallow the “sliding scale” commercial trip limit
implemented in the state FMP. In 2003, the NCDMF requested and received approval from the
ASMFC South Atlantic State-Federal Fisheries Management Board (ASMFC-SAB) to restore
the flexibility of the NCDMF Director to raise or lower the daily commercial trip limit provided
that those changes were done in response to preventing excessive discards. Any other future
regulatory changes by individual states require prior approval of the ASMFC-SAB or that state
will be deemed out of compliance. A state can request to implement alternative measures to the
compliance requirements only if that state can show to the Board’s satisfaction that its alternative
will have the same conservation value as the measure contained in Amendment 2. A more
detailed description of mandatory compliance requirements can be found in the ASMFC
Amendment 2 Red Drum FMP (ASMFC 2002).
4.7.2 Statutes
All management authority for North Carolina’s red drum fishery is vested in the State of
North Carolina. General authorities that are noted in Section 4.1 provide the MFC with the
regulatory powers to manage red drum. Although most red drum harvest is taken from coastal
waters, the limited harvest from inland waters falls under the jurisdiction of the North Carolina
Wildlife Resources Commission (WRC).
11
4.7.3 Rules
The following rules have been enacted to manage red drum stocks in North Carolina
through the authority vested in the MFC. These rules were in place at the beginning of the Red
Drum FMP Amendment 1 development. Rules necessary to implement the selected management
strategies for this plan and selected by the NC MFC are listed in Appendix 1.
SUBCHAPTER 3M-FINFISH
SECTION .0500 - OTHER FINFISH
.0501 RED DRUM
(a) The Fisheries Director, may by proclamation, impose any or all of the following restrictions on the
taking of red
drum:
(1) Specify areas.
(2) Specify seasons.
(3) Specify quantity.
(4) Specify means/methods.
(5) Specify size.
(b) It is unlawful to remove red drum from any type of net
with the aid of any boat hook, gaff, spear, gig, or similar
device.
(c) It is unlawful to possess red drum less than 18 inches total length or greater than 27 inches total length.
(d) It is unlawful to possess more than one red drum per person per day taken-by hook-and-line or for recreational
purposes.
(e) The annual commercial harvest limit (September 1 through August 31) for red drum is 250,000 pounds. If the
harvest lim
it is projected to be taken, the Fisheries Director shall, by proclamation, prohibit possession of red drum taken
in a commercial fishing operation.
History Note: Authority G.S. 113-134; 113-182; 113-221; 143B-289.52;
Eff. January 1, 1991;
Amended Eff. March 1, 1996; October 1, 1992; September 1, 1991;
Temporary Amendment Eff. May 1, 2000; July 1, 1999; October 22, 1998;
Amended Eff. April 1, 2001;
Temporary Amendment Eff. May 1, 2001;
Amended Eff. August 1, 2002.
SUBCHAPTER 3J - NETS, POTS, DREDGES, AND OTHER FISHING DEVICES
SECTION .0100 - NET RULES, GENERAL
SECTION .0103 GILL NETS, SEINES, IDENTIFICATION, RESTRICTIONS
.0103 GILL NETS, SEINES, IDENTIFICATION, RESTRICTIONS
(a) It is unlawful to use gill nets:
(1) With a mesh length less than 2 ½ inches.
(2) In internal waters from April 15 through December 15, with a mesh length 5 inches or greater and less
than 5 ½ inches.
(b) The Fisheries Director may, by proclamation, limit or prohibit the use of gill nets or seines in coastal waters, or any
portion thereof, or im
pose any or all of the following restrictions on the use of gill nets or seines:
(1) Specify area.
(2) Specify season.
12
(3) Specify gill net mesh length.
(4) Specify means/methods.
(5) Specify net number and length.
(c) It is unlawful to use fixed or stationary gill nets in the Atlantic Ocean, drift gill nets in the Atlantic Ocean for
recreational purposes, or any gill nets in internal waters unless nets are m
arked by attaching to them at each end two
separate yellow buoys which shall be of solid foam or other solid buoyant material no less than five inches in diameter
and no less than five inches in length. Gill nets, which are not connected together at the top line, shall be considered as
individual nets, requiring two buoys at each end of each individual net. Gill nets connected together at the top line shall
be considered as a continuous net requiring two buoys at each end of the continuous net. Any other marking buoys on gill
nets used for recreational purposes shall be yellow except one additional buoy, any shade of hot pink in color,
constructed as specified in this Paragraph, shall be added at each end of each individual net. Any other marking buoys on
gill nets used in commercial fishing operations shall be yellow except that one additional identification buoy of any color
or any combination of colors, except any shade of hot pink, may be used at either or both ends. The owner shall always
be identified on a buoy on each end either by using engraved buoys or by attaching engraved metal or plastic tags to the
buoys. Such identification shall include owner's last name and initials and if a vessel is used, one of the following:
(1) Owner's N.C. motor boat registration number, or
(2) Owner's U.S. vessel documentation name.
(d) It is unlawful to use gill nets:
(1) Within 200 yards of any pound net set with lead and either pound or heart in use, except from August
15 through Decem
ber 31 in Albemarle Sound, excluding tributaries, west of a line beginning at a point
36° 04.5184' N - 75° 47.9095' W on Powell Point; running southerly to a point 35° 57.2681' N - 75°
48.3999' W on Caroon Point, it is unlawful to use gill nets within 500 yards of any pound net set with
lead and either pound or heart in use;
(2) From March 1 through October 31 in the Intracoastal Waterway within 150 yards of any railroad or
highway bridge.
(e) It is unlawful to use gill nets within 100 feet either side of the center line of
the Intracoastal Waterway Channel south
of the entrance to the Alligator-Pungo River Canal near Beacon "54" in Alligator River to the South Carolina line, unless
such net is used in accordance with the following conditions:
(1) No more than two gill nets per vessel may be used at any one time;
(2) Any net used must be attended by the fisherman from a vessel who shall at no time be more than 100
yards from
either net; and
(3) Any individual setting such nets shall remove them, when necessary, in sufficient time to permit
unrestricted boat navigation.
(f) It is unlawful to use drift gill nets in violation of 15A NCAC 03J .0101(2) and Paragraph (e) of this Rule.
(g) It is unlawful to use unattended gill nets with a mesh length
less than five inches in a commercial fishing operation in
the gill net attended areas designated in 15A NCAC 03R .0112(a).
(h) It is unlawful to use unattended gill nets with a mesh length less than five inches in a com
mercial fishing operation
from May 1 through October 31 in the internal coastal and joint waters of the state designated in 15A NCAC 03R
.0112(b).
(i) It is unlawful to use more than 3,000 yards of gill net with a mesh length 5 1/2 inches or greater per vessel in internal
waters regardless of the num
ber of individuals involved.
History Note: Authority G.S. 113-134; 113-173; 113-182; 113-221; 143B-289.52;
Eff. January 1, 1991;
Amended Eff. August 1, 1998; March 1, 1996; March 1, 1994; July 1, 1993; September 1, 1991;
Temporary Amendment Eff. October 2, 1999; July 1, 1999; October 22, 1998;
Amended Eff. April 1, 2001;
Temporary Amendment Eff. May 1, 2001;
Amended Eff. September 1, 2005; August 1, 2004; August 1, 2002.
13
SUBCHAPTER 3R - DESCRIPTIVE BOUNDARIES
.0100 - DESCRIPTIVE BOUNDARIES
.0112 ATTENDED GILL NET AREAS
(a) The attended gill net areas referenced in 15A NCAC 03J .0103 (g) are delineated in the following areas:
(1) Pamlico River, west of a line beginning at a
point 35° 27.5768' N - 76° 54.3612' W on Ragged Point;
running southwesterly to a point 35° 26.9176' N - 76° 55.5253' W on Mauls Point;
(2) Within 200 yards of any shoreline in Pamlico River and its tributaries east of the line beginning at a
point 35° 27.
5768' N - 76° 54.3612' W on Ragged Point; running southwesterly to a point 35° 26.9176'
N - 76° 55.5253' W on Mauls Point; and west of a line beginning at a point 35° 22.3622' N - 76°
28.2032' W on Roos Point; running southerly to a point at 35° 18.5906' N - 76° 28.9530' W on
Pamlico Point;
(3) Pungo River, east of the northern portion of the Pantego
Creek breakwater and a line beginning at a
point 35° 31.7198' N - 76° 36.9195' W on the northern side of the breakwater near Tooleys Point;
running southeasterly to a point 35° 30.5312' N - 76°35.1594' W on Durants Point;
(4) Within 200 yards of any shoreline in Pungo River an
d its tributaries west of the northern portion of the
Pantego Creek breakwater and a line beginning at a point 35° 31.7198' N - 76° 36.9195' W on the
northern side of the breakwater near Tooleys Point; running southeasterly to a point 35° 30.5312' N -
76° 35.1594' W on Durants Point; and west of a line beginning at a point 35° 22.3622' N - 76°
28.2032' W on Roos Point; running southerly to a point at 35° 18.5906' N - 76° 28.9530' W on
Pamlico Point;
(5) Neuse River and its tributaries northwest of
the Highway 17 highrise bridge;
(6) Trent River and its tributaries;
(7) Within 200 yards of any shoreline in Neuse River and its tributaries east of the Highway 17 highrise
bridge
and west of a line beginning at a point 34° 57.9116' N - 76° 48.2240' W on Wilkinson Point;
running southerly to a point 34° 56.3658' N - 76° 48.7110' W on Cherry Point.
(b) The attended gill net areas referenced in 15A NCAC 03J .0103 (h) are delineated in the following coastal
and joint
waters of the state south of a line beginning on Roanoke Marshes Point at a point 35° 48.3693' N - 75° 43.7232' W;
running southeasterly to a point 35° 44.1710' N - 75° 31.0520' W on Eagles Nest Bay to the South Carolina State line:
(1) All primary nursery areas described in 15A NCAC 03R .0103, all perm
anent secondary nursery areas
described in 15A NCAC 03R .0104, and no trawl areas described in 15A NCAC 03R .0106 (2),(4),(5),
and (6);
(2) In the area along the Outer Banks, beginning at a point 35° 44.1710'
N - 75° 31.0520' W on Eagles
Nest Bay; running northwesterly to a point 35° 45.1833' N - 75° 34.1000' W west of Pea Island;
running southerly to a point 35° 40.0000' N - 75° 32.8666' W west of Beach Slough; running
southeasterly and passing near Beacon "2" in Chicamicomico Channel to a point 35° 35.0000' N - 75°
29.8833' W west of the Rodanthe Pier; running southwesterly to a point 35° 32.6000' N - 75° 31.8500'
W west of Salvo; running southerly to a point 35° 28.4500' N - 75° 31.3500' W on Gull Island;
running southerly to a point 35° 22.3000' N - 75° 33.2000' W near Beacon "2" in Avon Channel ;
running southwesterly to a point 35° 19.0333' N - 75° 36.3166' W near Beacon "2" in Cape Channel;
running southwesterly to a point 35° 15.5000' N - 75° 43.4000' W near Beacon "36" in Rollinson
Channel; running southwesterly to a point 35° 11.4833' N - 75° 51.0833' W on Legged Lump; running
southeasterly to a point 35° 10.9666' N - 75° 49.7166' W south of Legged Lump; running
southwesterly to a point 35° 09.3000' N - 75° 54.8166' W near the west end of Clarks Reef; running
westerly to a point 35° 08.4333' N - 76° 02.5000' W near Nine Foot Shoal Channel; running southerly
to a point 35° 06.4000' N - 76° 04.3333' W near North Rock; running southwesterly to a point
35°01.5833' N – 76° 11.4500' W near Beacon "HL"; running southerly to a point 35° 00.2666' N - 76°
12.2000' W; running southerly to a point 34° 59.4664' N - 76° 12.4859' W on Wainwright Island;
running easterly to a point 34° 58.7853' N - 76° 09.8922' W on Core Banks; running northerly along
the shoreline and across the inlets following the Colregs Demarcation line to the point of beginning.
14
(3) In Core and Back sounds, beginning at a point 34° 58.7853' N - 76° 09.8922' W on Core Banks;
running northwesterly to a point 34° 59.4664' N - 76° 12.4859' W on Wainwright Island; running
southerly to a point 34° 58.8000' N - 76° 12.5166' W; running southeasterly to a point 34° 58.1833' N -
76° 12.3000' W; running southwesterly to a point 34° 56.4833' N - 76° 13.2833' W; running westerly
to a point 34° 56.5500' N - 76°13.6166' W; running southwesterly to a point 34° 53.5500' N - 76°
16.4166' W; running northwesterly to a point 34° 53.9166' N - 76° 17.1166' W; running southerly to a
point 34° 53.4166' N - 76° 17.3500' W; running southwesterly to a point 34° 51.0617' N – 76°
21.0449' W; running southwesterly to a point 34° 48.3137' N - 76° 24.3717' W; running southwesterly
to a point 34° 46.3739' N – 76° 26.1526' W; running southwesterly to a point 34° 44.5795' N – 76°
27.5136' W; running southwesterly to a point 34° 43.4895' N – 76° 28.9411' W near Beacon "37A";
running southwesterly to a point 34° 40.4500' N – 76° 30.6833' W; running westerly to a point 34°
40.7061' N – 76° 31.5893' W near Beacon "35" in Back Sound; running westerly to a point 34°
41.3178' N -76° 33.8092' W near Buoy "3"; running southwesterly to a point 34° 39.6601' N – 76°
34.4078' W on Shackleford Banks; running easterly and northeasterly along the shoreline and across
the inlets following the COLREGS Demarcation lines to the point of beginning;
(4) Within 200 yards of any shoreline, except from
October 1 through October 31, south and east of
Highway 12 in Carteret County and south of a line from a point 34° 59.7942' N - 76° 14.6514' W on
Camp Point; running easterly to a point at 34° 58.7853' N - 76° 09.8922' W on Core Banks; to the
South Carolina State Line.
History Note: Authority G.S. 113-134; 113-173; 113-182; 113-221; 143B-289.52;
Eff. August 1, 2004.
15
5. GENERAL LIFE HISTORY
5.1 Description and Distribution
The red drum is one of twenty-two members of the drum family (Sciaenidae) that
includes many of North Carolina’s most important inshore commercial and recreational species.
Species in this family are typically known as the drums, and other common drum species landed
in North Carolina include weakfish, Atlantic croaker, spot, spotted seatrout, kingfishes (sea
mullet), and black drum. Red drum and many others in this family produce drumming sounds by
vibrating their swim bladders with special muscles. Other common names for red drum include
channel bass, redfish, spottail bass, and puppy drum. Red drum are common along the Atlantic
coast over a wide range of habitats from Chesapeake Bay to Key West, Florida. Historically,
landings reached as far north as Massachusetts and there was a moderate commercial fishery off
the coast of New Jersey in the 1930’s. There are few reports of landings from areas north of
Chesapeake Bay since the 1950’s suggesting a decline in red drum distribution along the Atlantic
coast.
5.2 Reproduction and Development
Red drum spawning has long been accepted to occur at night in high salinity areas in or
around the major estuarine passes and inlets (Pearson, 1929; Johnson, 1978). There is now
evidence that substantial spawning activity may take place inside the estuaries. Red drum have
been collected in spawning condition inside Hatteras and Ocracoke Inlets and near the mouths of
bays and rivers on the western side of Pamlico Sound (Ross et al., 1995). Researchers using
hydrophones to detect spawning sounds documented spawning activity of red drum near
Ocracoke Inlet and on the western side of Pamlico Sound near Bay River (Figure 1). Eggs
captured during this survey were identified as red drum eggs and provide further evidence of
spawning activity within the estuary (Luczkovich et al., 1999). In 2003 and 2004, additional
hydrophone surveys were conducted in the lower Neuse River estuary. Results for these years
found spawning aggregations of red drum occurring in the lower Neuse River in an area ranging
from Oriental to the river mouth (Barrios 2004).
Laboratory tests show optimal conditions for spawning are salinities ranging from 25-35
ppt and temperatures between 22-30 °C (Holt et al., 1981). Documented spawning activity in
Pamlico Sound during 2003 and 2004 occurred in salinities ranging from 20 to 25 ppt (Barrios
2004). The buoyant eggs are small (approximately 1 mm in diameter) and hatch within 24 to 36
hours of fertilization. Larvae, while found over a wide range of salinities (0-33 ppt) in North
Carolina (Ross and Stevens, 1992), have been shown in laboratory experiments to have optimum
growth and survival at salinity levels between 5-10 ppt (Neill, 1987). Larvae are distributed
throughout the estuary by tidal and wind driven currents. The majority are transported to the
upper reaches of the estuary where they settle out in shallow, low-salinity nursery areas with
16

Figure 1. Red drum spawning sites identified in the Bay River and Ocracoke Inlet areas through
acoustic sampling (Luczkovich et al., 1999).
17
abundant food supplies, such as coastal creeks, protected bays with sandy or muddy bottoms, and
grass beds (Mercer, 1984; Daniel; 1988; Wenner et al., 1990; Ross et al., 1992).
Red drum are eurythermal and have been collected over a wide range of temperatures
ranging from 2° C to 33° C (Simmons and Breuer, 1962). During extreme cold conditions in the
winter, small juvenile red drum leave the shallow water habitats for channels and other deep
water areas and then return to shallow water areas the following spring as water temperatures
rise (Wenner et al., 1990). The distribution of larvae and juveniles in the estuary varies
seasonally as the fish grow and disperse. In North Carolina, juvenile red drum are found year-
round over a wide range of salinity and habitats, although they generally prefer the shallow
shorelines of the various bays and rivers, and the shallow grass flats behind the barrier islands
(Ross and Stevens, 1992).
Red drum grow rapidly during their first year, reaching 9-10 inches TL by early summer
when they leave the shallow nursery grounds, and 12 to 14 inches TL by their first birthday in
September. The legal size limit of 18 inches TL is reached when they are around 20 months old
during the late fall and early spring (Daniel, 1988; Wenner et al., 1990; Ross et al., 1995), and
most grow beyond the maximum size limit of 27 inches TL during their second full year of life.
Red drum mature 1-2 years later at 3 to 4 years old and 30 to 36 inches TL (Ross et al., 1995).
Once mature, red drum tend to spend more time in the ocean but are still estuarine dependent as
they come inshore to feed, develop, and spawn. The oldest red drum aged was captured in North
Carolina waters and was 62 years of age (Ross et al., 1995).
5.3 Diet and Food Habits
The diet of red drum during various stages of development has been studied by Daniel
(1988), Music and Pafford (1984), and reported in SAFMC (1990). Stomach content analysis
shows that dominant food sources coincide with habitat changes. Early juveniles 0.2-0.6 inches
TL preyed on copepods, while mysids, small benthic shrimp common in salt marsh, were the
dominant food source for juveniles 0.6-1.2 inches TL. The diet preference shifts to fish for red
drum between 3.0-6.0 inches TL, coinciding with movement out of shallow marshes and into
deeper creeks in the winter. Decapod crustaceans, predominantly mud crabs and fiddler crabs,
comprise 96% of the diet of red drum between 7.9-11.8 inches TL. Red drum over 11.8 inches
TL depend on a more diverse food base, although they remain a predominately benthic feeder.
Overall, crustaceans comprised 72% of their prey, fish comprised 17% and plant matter
comprised 11%. Fiddler crab and mud crab were the overall predominant prey. Diet work
specific to red drum in North Carolina is currently lacking and any future life history studies
should attempt to fill this void.
18
5.4 Migration Patterns
The movements of juvenile and adult red drum were summarized by Mercer (1984) and
described from tagging studies conducted by NCDMF from 1986 through 1995 (Ross and
Stevens, 1992; Marks and DiDomenico, 1996; Burdick et al., 2007). Tagging studies in North
Carolina, consist of two segments: tagging of one-year old sub-adult red drum by Division staff,
and tagging of adult red drum by anglers participating in a state-sponsored volunteer tagging
program. More than 45,000 red drum have been tagged since the mid-1980’s with an overall
recapture rate of 11%. Recapture rates decrease with increasing fish size and are 18% for sub-
legal size fish (<18 inches), 13% for legal size (18-27 inches) and 2% for red drum over the slot
limit of 27 inches (Burdick et al. 2007).
Most of the DMF tagging effort has been concentrated from June through October in the
Pamlico and Neuse rivers and over grass flats behind the barrier islands of Pamlico Sound, while
tagging efforts by the volunteer participants have occurred year round throughout state coastal
waters. Late age 0 and age 1 red drum show limited movement for most of the year although
movement tends to increase in the fall. During 1991-1995, over 65% of tagged red drum under
18 inches were recaptured within 10 km of the release site. Late age 0 and age 1 red drum are
common throughout the shallow portions of North Carolina’s estuaries and are particularly
abundant along the shorelines of rivers and bays, in creeks, and over grass flats and shoals
common in many of the sounds. Tag returns indicate that in the fall a portion of the sub-adult
fish residing in the rivers move toward higher salinity areas such as the grass flats and shoals of
the barrier islands and inlets and the surf. Sub-adults residing near coastal inlets and barrier
islands during the summer likely enter the surf in the fall. Tag return rates are low during winter,
with most returns coming from sub-adults recaptured in the estuaries and a few taken in the surf
and inlets. During spring and summer, recaptures are common along the barrier islands, near
coastal inlets, and in the surf zone, with a large number of the sub-adults continuing to be
recaptured in the rivers. Red drum of age 2 to 3 have generally left the coastal rivers and are
recaptured along the barrier islands, the shallow water areas around the outer bars and shoals of
the surf, and in coastal inlets, over inshore grass flats, creeks or bays.
Movements of adult red drum have been documented through recreational and
commercial landings records and through the state-sponsored volunteer tagging program.
During the spring adult red drum occur along the beaches and inlets for one to two months as
they move from offshore wintering grounds and appear in recreational catches of surf fishermen
primarily from Cape Lookout to Cape Hatteras. Large aggregations have been observed around
Ocracoke, Hatteras, and Oregon inlets. A large portion of the population moves inside Pamlico
Sound during the summer months, while other schools of fish are reported to continue moving
north to the Chesapeake Bay and the Virginia barrier islands. Schools of adult fish are common
in coastal inlets and in Pamlico Sound, particularly in the mouth of the Pamlico and Neuse
rivers, during the spawning season in August and September. By late September most adult
drum are found around the coastal inlets and along the beaches where they remain through
November before moving offshore for winter. Mercer (1984) documented schools of large red
drum moving south from Virginia waters and along the coastal beaches of the Outer Banks
during the fall. Anglers have reported catches of large red drum during December around the
shoals and outer bars of the barrier islands and around submerged structures up to a couple of
19
kilometers offshore. By late December, most large red drum have moved offshore where they
are no longer available to near-shore fishing activity.
6. STATUS OF STOCKS
The most recent stock assessment indicates that the red drum stock in North Carolina is
no longer experiencing overfishing and that the current escapement level of juvenile fish to the
adult stock is near the target of 40% (Takade and Paramore 2007; see Appendix 2). Information
necessary to estimate abundance at age for adult red drum and calculate spawning stock biomass
(SSB) are lacking because slot limits restrict the age classes that may be harvested and fishery-
independent survey data are not available for the adult fish. Therefore, the primary benchmarks
used in determining the status of red drum are spawning potential ratio (SPR) and escapement or
survivability to age 4. It is important to note that due to the lack of information on the adult fish,
SPR values reported are not a reflection of the current spawning stock, but an estimate of the
SPR that would result if all sources of mortality (fishing and natural) present during the
assessment period continue to be static.
Although early assessments evaluated the Atlantic Coastal red drum population as a
single stock, recent assessments are divided into Northern (NC to MD) and Southern (SC to FL)
components to better account for the limited migration of the species (Vaughan 1996). Northern
region assessment results are largely representative of the North Carolina stock, since North
Carolina accounts for virtually all the commercial landings, the majority of the recreational
landings, and the only fishery-independent data that are available for the region.
The northern red drum stock was assessed using commercial, recreational, and
independent data from 1986 to 2005. Results were broken into three regulatory periods with
relatively uniform regulations [early: 1986-1991, mid: 1992-1998, and late: 1999-2005 (Table
1)]. A major assumption in this assessment was assigning an accurate length distribution to
released fish from the recreational fishery. While several assumptions on the length distribution
of recreational releases were calculated, the preferred matrix (Tagging) used length frequencies
estimated from modeling of North Carolina Division of Marine Fisheries (NCDMF) tag returns.
Late period age-3 selectivity was estimated to be 0.48 of fully selected fish (age-2), and was
estimated from modeling of NCDMF tag returns (Burdick et al. 2007). Two models were used: a
backward calculating virtual population analysis (VPA) and a forward calculating spreadsheet
catch-at-age model. Both models were updated from the Vaughan and Carmichael (2000)
assessment. Fishing mortality (F) estimated from FADAPT ranged from 0.50 to 0.49, with
escapement ranging from 40.6% to 41.0% and static spawning potential ratio (SPR) ranging
from 40.4% to 40.8%. The spreadsheet catch-at-age model F estimates ranged from 0.66 to 0.63,
with escapement estimated at 32.8% and static SPR estimated at 32.3%. All estimated runs
using the TAGGING matrix from both models were above the threshold of 30% static SPR and
the FADAPT estimates were above the target of 40% static SPR. All runs showed
improvements in escapement and SPR from the previous regulation period (1992-1998).
20

Table 1. Primary harvest limits for recreational and commercial fisheries within each of
the regulation periods
Regulation period Recreational regulations Commercial regulations
1987-1991 14 in TL minimum size limit
Only 2 fish over 32 in TL
14 in TL minimum size limit
1992-1998 18-27 in TL window limit
5 fish bag limit
1 fish >27 in TL allowed
250,000 lb commercial cap
18-27 in TL window limit
1 fish >27 in TL allowed (no sale)
1999-2005 18-27 in TL window limit
1 fish bag limit
18-27 in TL window limit
daily trip limit (7 fish since 2001)
The red drum stock in North Carolina has responded to increased regulations since the
early 1990’s (Figure 2). The current red drum assessment indicates that F has decreased and
escapement and static SPR have increased for the red drum northern stocks since the current
(1999 - 2005) management was implemented. Current estimates are all above 30% static SPR
and therefore, indicate that overfishing is not occurring. In contrast, during the earliest
assessment period of 1987 to 1991, SPR was estimated at only 1.2%. This low estimate was
primarily attributed to excessive fishing mortality on age-1 red drum. During the mid-period
(1992 – 1998) SPR estimates were 18%, an improvement, although, still well below the
overfishing definition of 30% SPR.
0
0.2
0.4
0.6
0.8
1
1.2
1.4
1.6
Early Mid Late
Period
F rate
0
5
10
15
20
25
30
35
40
45
Escapement
SPR
F rate
SPR
Figure 2. Summary of the stock status for the northern region red drum stocks during the early
(1987 – 1991), mid (1992 – 1998) and late (1999 – 2005) regulatory periods.
21
In addition to traditional stock assessment techniques, the DMF has tagged red drum in
estuarine waters since 1983 to determine both migration patterns and estimate mortality of the
exploited age classes. Recent analysis and modeling by Bacheler et al. (2008) was conducted to
determine both the selectivity and fishing mortality at age from tagging data for red drum in each
of the regulatory periods. Results indicate that the increase in minimum size and reduction in the
recreational bag limit put into place after 1991 acted to lower the selectivity and substantially
reduce the fishing mortality rate on age-1 fish. Further harvest restrictions in 1998 acted to
further decrease selectivity and fishing mortality on age-1 fish. A significant drop in fully
recruited age-2 fish was not evident in this analysis. However, there was a reduction in the
overall fishing mortality for fish moving through the slot limit. Results of the tagging data were
consistent with the results of the 2007 North Carolina red drum stock assessment, indicating an
increase in escapement and spawning potential ratio from the mid to late regulation period.
It appears that the condition of the northern red drum stock has improved and that the
more restrictive management measures implemented during the late period (1999-2005) have
aided in that improvement. Quantitative assessment results, tag-based survival estimates, and
survey data all indicate that the conditions that led to overfishing during the prior management
periods of 1987 to 1998 are no longer occurring. The current stock status indicates that SPR and
escapement estimates have responded to regulatory changes and that the current level of fishing
mortality is sufficiently low to sustain the fishery. It is critical to note however, that reaching the
target is only the first step in maintaining this fishery. In order for the red drum stock to be
considered healthy and viable, the 40% SPR target must be maintained continuously over time.
Increases in the harvest rates (relaxation of current regulations) of red drum should only be
allowed if those increases are not anticipated to lower the SPR values below the overfishing
definition.
7. DESCRIPTION OF FISHERIES
7.1 Commercial Fishery
A directed red drum fishery does not exist in North Carolina today and historically red
drum made up only a small portion of North Carolina’s total commercial landings. Along the
Atlantic coast however, North Carolina’s red drum landings are highest for all states accounting
for 96% of red drum commercially harvested from 1999 to 2005 (Table 2). Commercial
landings of red drum
in North Carolina fluctuated annually from 1972 to 2005, averaging
161,433 pounds (lb) and ranging from 19,637 lb in 1977 to 372,942 lb in 1999 (Figure 3).
The first commercial fishery regulations were implemented in 1976 and included a
minimum size limit of 14 inches (in) total length (TL) and imposed a possession limit of two fish
greater than 32 in TL. Prior to this limit on adult fish, Outer Banks fishermen occasionally
targeted large red drum with long haul seines in Pamlico Sound (SAFMC 1990). Management
remained unchanged until the 1990’s. In 1990, a 300,000 lb commercial cap was established and
no more than one fish greater than 32 in TL could be harvested. The commercial cap was
originally implemented to prevent North Carolina’s commercial red drum fishery from
22
expanding beyond historical harvest levels. At the time, southern red drum markets (i.e. Florida)
were prohibiting the sale of red drum, increasing the demand from other areas. A stock
assessment conducted for the period of 1987-1991 indicated that overfishing was occurring. As
a result, North Carolina implemented an 18 – 27 in TL slot limit, with an allowance for
possession but no sale of one fish over 27 in TL and further reduced the annual commercial cap
to 250,000 lb. An updated assessment evaluated these changes and used data for the period of
1992-1998. Results indicated that, while showing marked improvement, the red drum fishery
continued to be overfished. In the fall of 1998 North Carolina began development of a state
FMP. The first action taken in the plan was to reduce harvest and divert overfishing. In October
of 1998 new management measures were put into place by the NCMFC. Daily trip limits were
established and possession of red drum over 27 in TL was prohibited. Daily trip limits originally
set at 100 pounds per day were later reduced due to annual cap overages and the current seven
fish per day limit has been in place since 2001. Additionally, targeting of red drum was
prohibited by requiring that the total weight of red drum make up no more than 50% of the total
marketable catch (excluding menhaden) for each trip. As a result of these regulatory changes,
North Carolina’s regulatory history can easily be summarized into three distinct management
periods from which data are available for assessments: 1987-1991, 1992-1998, and 1999-2005
(see Table 1 in Section 6).
With the changes in regulations over the years, the size structure of the commercial
harvest has also shif
ted towards larger fish (Figure 4). During the initial management period of
1987-1991 most red drum harvested were ~14 in TL and one year in age. Very few fish were
harvested at the upper end of the slot limit. When the size restrictions changed (18 – 27 in TL)
in 1992, the modal length for red drum harvested shifted to 19 in TL and two years in age. As a
result of decreasing the available sizes that can be retained within the slot limit, landings were
now primarily from a single year class of fish and dependent upon year class strength from a
single cohort. While the regulatory changes in 1999 did not change the legal size limits, the
reductions in harvest resulting from the daily trip limit did correspond with a shift in the modal
length of harvested fish from 19 to 23 in TL. In addition, fish at the upper end of the slot limit
that were once rare in the landings are now commonly encountered.
23

Table 2. Annual commercial landings (lb) of red drum by state along the mid-Atlantic coast.
Year RI NY NJ DE MD VA NC SC GA FL* Total
1972 -----5,900 42,919 1,200 3,400 128,400 181,819
1973 - - - 900 - 6,200 70,264 600 3,700 166,500 248,164
1974 -----15,700 142,437 2,300 3,100 137,300 300,837
1975 - - - 200 - 19,600 214,236 12,400 10,000 83,300 339,736
1976 -----18,600 168,259 2,600 7,300 106,000 302,759
1977 - - - 200 - 300 19,637 800 5,000 103,500 129,437
1978 - - - 300 - 2,100 21,774 4,325 328 104,696 133,523
1979 - - - - 100 1,900 126,517 1,767 935 92,684 223,903
1980 -----400 243,223 4,107 1,493 191,222 440,445
1981 -----200 93,420 - 261 258,374 352,255
1982 -----1,700 52,561 2,228 251 139,170 195,910
1983 - - - - 100 41,700 219,871 2,274 1,126 105,164 370,235
1984 -----2,600 283,020 3,950 1,961 130,885 422,416
1985 -----1,100 152,676 3,512 3,541 88,929 249,758
1986 - - - - 1,000 5,400 249,076 12,429 2,939 77,070 347,914
1987 -----2,600 249,657 14,689 4,565 42,993 314,504
1988 - - - - 8,100 4,000 220,271 -3,281 284 235,936
1989 - - - - 1,000 8,200 274,356 165 3,963 287,684
1990 ----29 1,481 183,216 -2,763 187,489
1991 - - - - 7,533 24,771 96,045 - 1,637 129,986
1992 - - - - 1,087 2,352 128,497 -1,759 133,695
1993 ----55 8,637 238,099 -2,533 249,324
1994 5,094 ---859 4,080 142,119 -2,141 154,293
1995 - 668 - - 6 2,992 248,122 -2,578 254,366
1996 - 8 - - 215 2,073 113,338 -2,271 117,905
1997 43 - - - 22 4,049 52,502 - 1,395 58,011
1998 165 57 311 - 336 6,436 294,366 -672 302,343
1999 - 47 241 6 504 12,368 372,942 -1,115 387,223
2000 - 1,215 --843 11,457 270,953 -707 285,175
2001 - 58 14 - 727 5,318 149,616 -- 155,7
2002 - 116 - - 1,161 7,752 81,364 - - 90,393
2003 - 43 - - 631 2,716 90,525 - - 93,915
2004 ----12 638 54,086 - - 54,736
2005 ----37 656 128,770 -- 129,4
Total 5,302 2,212 566 1,606 24,357 235,976 5,488,734 69,346 76,715 1,956,471 7,861,285
*Florida landings are for the East coast of Florida only.
33
6
3
24

0
50,000
100,000
150,000
200,000
250,000
300,000
350,000
400,000
1972
1974
1976
1978
1980
1982
1984
1986
1988
1990
1992
1994
1996
1998
2000
2002
2004
Year
Commercial Landings (lbs)
Figure 3. Annual commercial landings of red drum in North Carolina.
0
5
10
15
20
25
30
35
40
7 9 11 13 15 17 19 21 23 25 27 29 31 33 35 37 39 41 43 45 47 49 51 55
Total Length (in)
Percent Frequency
1987-1991
1992-1998
1999-2005
Figure 4. Length frequency of red drum sampled from the North Carolina commercial harvest
(all gears combined) for the periods 1987-1991, 1992-1998, and 1999-2005.
Red drum have been harvested over the years using a variety of commercial gears.
Throughout the 1970’s long haul seines and common haul seines were generally the most
productive gears, while gill nets, pound nets and trawls were also commonly used (ASMFC
25

2002). Since the 1980’s, gill nets have become the dominant gear. In the years leading up to the
implementation of daily trip limits in 1999, nearly one-half of the total annual commercial
harvest of red drum was harvested by a small number of trips with high landings. Nearly half of
all red drum landings (48.5%) from 1994 to 1998 occurred in only 1.1% of the total number of
trips that harvested red drum. Runaround gill nets became a significant contributor to the red
drum commercial harvest during this time (Figure 5). The runaround gill net and long haul seine
fisheries typically had the largest individual trips of red drum
landings during this time because
of their effectiveness in encircling large schools of red drum. Participation in the runaround gill
net fishery increased in the mid-1990’s as fishermen actively pursued schools of red drum. The
largest landings occurred in the estuarine waters from Oregon Inlet to Ocracoke (Table 3).
During this time there were a few exceptional long haul seine catches of up to 10,000 lb. A
typical catch for a runaround gill net trip ranged from 100 to 1,000 lb per trip with several
catches up to 5,000 lb. Now that regulations prohibit targeting, red drum are most commonly
encountered as bycatch in the southern flounder estuarine gill net fishery but are also still
common bycatch in many of the gears in which they were traditionally captured.
0
10
20
30
40
50
60
70
80
90
100
Anchored
Gill Net
Runaround
Gill Net
Pound Net Long Haul
Seine
Beach
Seine
Shrimp
Trawl
Fish Trawl Other
Gears
Gear
Percent of Total Catch
1987-1991
1992-1998
1999-2005
Figure 5. Percent landings of red drum by gear type for each harvest period.
26

Table 3. Percentage of commercial landings of red drum in North Carolina by major
water bodies.
Year
Total
1972 0.70 40.39 20.07 0.23 34.32 4.04 0.24 - 100
1973 0.24 46.69 31.79 0.31 19.41 1.21 0.35 - 100
1974 0.65 24.87 29.06 5.61 36.57 2.22 1.02 - 100
1975 6.17 50.97 10.58 2.54 25.12 4.23 0.39 - 100
1976 18.22 16.56 3.01 2.46 32.57 26.28 0.89 - 100
1977 - 31.84 20.81 0.96 33.13 12.54 0.72 - 100
1978 - 71.69 8.97 - 14.97 4.37 - - 100
1979 0.08 21.06 39.47 0.40 27.86 10.87 0.27 - 100
1980 - 29.26 27.12 0.06 36.44 6.78 0.34 - 100
1981 - 29.85 12.97 - 53.39 3.41 0.39 - 100
1982 0.33 58.57 17.32 0.21 14.43 5.61 3.54 - 100
1983 0.82 31.54 26.87 0.53 24.27 3.33 12.65 - 100
1984 0.25 58.39 19.68 0.85 7.16 2.60 11.08 - 100
1985 0.03 47.78 21.47 0.02 9.45 0.76 20.48 - 100
1986 1.68 27.81 20.78 0.23 24.65 11.19 13.66 - 100
1987 13.03 16.78 19.51 2.17 28.85 8.26 11.41 - 100
1988 5.02 23.19 26.03 0.60 24.96 9.12 11.08 - 100
1989 3.57 19.31 23.02 1.50 35.68 7.14 9.77 - 100
1990 0.43 26.04 21.79 1.16 35.34 1.88 13.37 - 100
1991 5.56 13.95 22.44 1.03 36.94 1.57 18.51 - 100
1992 9.37 10.75 13.32 3.19 47.02 1.99 14.34 - 100
1993 19.07 15.08 6.65 5.75 41.23 2.54 9.68 - 100
1994 6.74 24.39 4.76 0.71 51.75 4.02 7.63 - 100
1995 1.75 10.73 8.51 1.33 63.39 6.73 7.56 - 100
1996 1.26 15.20 12.71 0.46 42.75 7.33 20.28 <0.01 100
1997 0.70 13.39 22.77 2.73 40.02 6.83 13.56 - 100
1998 6.94 2.27 3.39 5.29 76.40 2.84 2.87 - 100
1999 19.64 1.90 6.17 11.42 50.06 7.16 3.66 - 100
2000 9.38 10.40 5.92 15.73 46.14 7.65 4.77 - 100
2001 7.82 4.83 9.01 20.65 43.00 9.53 5.15 - 100
2002 9.68 2.68 10.28 14.09 32.02 20.01 11.24 - 100
2003 6.31 3.62 8.88 16.63 33.86 15.13 15.55 - 100
2004 3.09 5.73 10.48 12.71 47.16 6.35 14.47 - 100
2005 6.11 2.37 14.71 5.33 40.05 18.55 12.87 - 100
Pamlico
Sound
Pamlico/
Neuse
River
Bogue
Sound
south Unknown
Albermarle
Sound
Atlantic
Ocean
Core
Sound
Croatan
and
Roanoke
Sounds
27
7.2 Recreational Fishery
Red drum are targeted by recreational anglers year-round throughout the sounds, rivers,
and beaches of North Carolina. Angling methods used to catch red drum, include conventional,
spinning, and fly tackle; using live, dead, and artificial bait. Red drum are consistently reported
as one of the top target species by shore-based recreational anglers, and were the number one or
two target species in 1993, 1995, 1996 and every year from 1999 to 2003 (National Marine
Fisheries Service, Fisheries Statistics Division, personal com
munication).
Recreational fishermen must adhere to the same slot limit (18 to 27 in TL) as commercial
fishermen and are allowed to harvest one fish per person per day. From 1992 to 1998 when there
was a five fish creel limit, recreational landings averaged 286,548 lb and accounted for
approximately 60% of the total red drum harvested in North Carolina. After the creel limit was
reduced to one fish per day, annual landings dropped to an average of 204,725 lb for the period
of 1999 to 2005, accounting for 56% of total red drum landed in North Carolina.
Similar to the commercial fishery, recreational landings vary annually in response to
changes in year-class abundance. For example, landings increased from 39,077 lb in 1997 to
591,428 lb in 1998 (Table 4). Unlike the commercial landings, North Carolina does not
dominate harvest of red drum in the recreational fishery along the Atlantic coast (Table 5).
North Carolina landings only accounted for 14% of the recreational harvest by weight for the
Atlantic Coast from 1999 to 2005. South Carolina (16%) and Georgia (14%) had a similar
average, while the east coast of Florida dominated with 50% of the catch, averaging 718,498 lb
per year.
Compliance with the 18 in minimum size limit varies by year, but has improved on
average in recent years. Undersized red drum accounted for 19% of the recreational harvest
from 1994 to 1998, ranging from 1% in 1998 to 35% in 1997. Undersized red drum accounted
for only 3.4% of the harvest from 1999 to 2005, ranging from a low of 0% in both 2003 and
2005 to a high of 5.5% in 1999.
Prior to the prohibition of red drum greater than 27 inches TL in 1999, North Carolina
offered award citations for red drum captured weighing 45 lb or greater. A citation could also be
received for the release of a captured red drum greater than 40 in TL. As of 1999, all award
citations are for the releases only. The NCDMF citation data show an increasing trend in the
number of release citations issued prior to 1999 indicating an increasing tendency by anglers to
practice catch and release ethics (Table 6). In addition, release citations have increased
substantially in 1999 and appear to be trending upward. While this trend appears encouraging, it
is difficult to ascertain if this trend is due to increases in availability of large fish, increases in
fishing effort or due to increased popularity of the citation program.
28

Table 4. Red drum catches for recreational anglers (MRFSS), for 1989 - 2005. All
weights are in pounds. Commercial weights are included as a reference with
combined weights reported.
Definitions of recreational catch type:
Recreational
Numbers
Weight (lb)
A + B1* B2*
A + B1 Commercial Total
Year # Landed # Released
Weight (lb) Weight (lb)
1989 62,359 7,566 214,849 274,356 489,205
1990 33,149 12,452 302,994 183,216 486,210
1991 38,658 121,178 108,268 96,045 204,313
1992 23,593 60,230 109,134 128,497 237,631
1993 49,493 182,301 266,459 238,099 504,558
1994 28,953 107,662 192,060 142,119 334,179
1995 88,593 164,520 405,620 248,122 653,742
1996 36,746 35,752 204,556 113,338 317,894
1997 8,749 259,570 39,077 52,502 91,579
1998 114,638 199,701 591,428 294,366 885,794
1999
64,739 247,146
326,303
372,942
699,245
2000
61,618 203,967
316,029
270,953
586,982
2001
23,142 238,552
132,578
149,616
282,194
2002
42,541 640,857
182,226
81,364
263,590
2003
25,481 75,561
118,808
90,525
209,333
2004
30,165 191,593
114,434
54,086
168,520
2005
53,268 319,322
242,078
128,770
370,848
*A = fish brought ashore in whole form which can be identified, enumerated, weighed, and
measured by interviewers.
*B = fish not brought ashore that can be separated into: B1 = fish caught used as bait, filleted, or
discarded & B2 = those released alive.
29

Table 5. Recreational harvest (pounds of A + B1 fish) of red drum along the Atlantic coast, 1981-
2005 (NMFS, Office of Science & Technology).
Year
DE
MD
VA NC SC GA
FLEC
Total
1981
4,370
347,939 31,519 50,230 9,442
317,963 761,463
1982
37,511 340,686 52,150
480,676 911,023
1983
3,018
51,299 109,540 222,691 67,298
675,924 1,129,770
1984
1,285 1,160,539 183,282 294,583
976,971 2,616,660
1985
70,677 1,532,316 185,887
414,176 2,203,056
1986
754,161
145,517 31,594 498,586 173,837
360,725 1,964,420
1987
44,332 200,729 913,639 250,795
227,222 1,636,717
1988
9,030 451,974 1,050,049 385,860
12,507 1,909,420
1989
2,348
27,236 214,849 396,771 127,245
146,064 914,513
1990
2,679
302,994 631,819 161,712
258,569 1,357,773
1991
5,635
30,582 108,268 284,290 337,207
516,999 1,282,981
1992
55,324 109,134 411,484 198,751
396,555 1,171,248
1993
45,505 266,459 282,614 328,245
290,930 1,213,753
1994
3,684 192,060 314,632 353,616
578,412 1,442,404
1995
66,270 405,620 417,595 300,337
525,231 1,715,053
1996
1,512 204,556 396,394 164,756
596,483 1,363,701
1997
1,810 39,077 296,155 129,836
345,390 812,268
1998
34,861 591,428 129,619 84,348
487,091 1,327,347
1999
92,794 326,303 103,777 166,630
540,310 1,229,814
2000
95,596 316,029 93,043 228,965
885,447 1,619,080
2001
860
51,890 132,578 188,198 155,854
853,714 1,382,234
2002
* 860
15,154
155,213 182,226 103,830 170,572
551,128 1,178,983
2003
57,214 118,808 449,399 234,865
729,445 1,589,731
2004
31,748 114,434 402,789 286,486
668,179 1,503,636
2005
7,463 242,078 310,586 190,411
754,756 1,505,294
Total
1,720
787,365
1,358,104 5,960,984 10,004,474 5,039,688
12,590,867
* Weight estimated from same number of fish (275) caught in 2001
30

Table 6. The number of award citations issued on an annual basis
for catches of red drum. Citations are awarded for releases
≥ 40 in and weigh-ins* ≥ 45 lb.
Year # Citations # Released % Released
1987 215 150 70
1988 324 266 82
1989 335 275 82
1990 419 374 89
1991 335 308 92
1992 451 427 95
1993 644 627 97
1994 876 868 99
1995 622 607 98
1996 685 655 96
1997 737 704 96
1998 515 483 94
1999 1073 1073 100
2000 1200 1200 100
2001 1156 1156 100
2002 1330 1330 100
2003 1030 1030 100
2004 1337 1337 100
2005 1520 1520 100
*Due to regulations all citations since 1999 are for release only.
31

8. DESCRIPTION OF THE SOCIOECONOMIC
CHARACTERISTICS OF THE FISHERY
8.1 Economic Aspects of the Fishery
8.1.1 Ex-Vessel Value and Price
Red drum is currently a commercial bycatch fishery in North Carolina; as such,
its overall value is low relative to other species, though the price of red drum
is higher
than many targeted species. In terms of value, the fishery clearly had a high point in the
late-nineties, with landings sometimes nearing or exceeding $400,000. Landings for
2005 were less than half of that, and recent years have been even smaller (Figure 6).
$0
$50,000
$100,000
$150,000
$200,000
$250,000
$300,000
$350,000
$400,000
$450,000
1972 1975 1978 1981 1984 1987 1990 1993 1996 1999 2002 2005
Year
Value
Inflated Value
CPI Deflated Value
Figure 6. Value of red drum landings in North Carolina, 1972 – 2005. DMF Trip Ticket
Program
.
The price fetched for red drum has steadily increased in recent years, even
accounting for inflation. Fisherm
en are now receiving the highest price on record ($1.34
per pound in 2005), probably because of the constricted supply of commercially available
red drum due to the ban on the sale of red drum in South Carolina, Florida, Louisiana,
Alabama, and Texas (Figure 7). The states of Mississippi, Georgia, Virginia, and North
Carolina are the only sources of m
arketable red drum along the entire Atlantic and Gulf
coasts. Rising prices have restored some of the value of the red drum fishery, though it is
still smaller than its all-time highs (see Table 7, Figure 7).
1
As a bycatch fishery with a
strict trip limit, the steadily rising price of red drum should have a minimal impact on
fishermen’s behavior.
1 The consumer prices index (CPI) is a standard tool of adjusting value to account for
inflation over tim
e. Ex-vessel value of landings are inflation-adjusted to 1972 because
that is the first year that DMF began to have data for all state-managed species.
32

33
Table 7. Detail values of red drum landed, total value, deflated value, price per pound,
and percent change from
year to year for red drum landed in North Carolina,
1972—2005. DMF Trip Ticket Program.
Year
Inflated
Value Conversion
CPI
Deflated
Val
ue
%
Change
Value
Inflated
Price per
Pound
CPI Price
per Pound
%
Change
per
Pound
1972 $5,228 1.0000 $5,228 --- $0.12 $0.12 ---
1973 $7,775 0.9414 $7,320 40% $0.11 $0.10 -14%
1974 $15,781 0.8479 $13,380 83% $0.11 $0.09 -10%
1975 $21,537 0.7770 $16,733 25% $0.10 $0.08 -17%
1976 $21,700 0.7346 $15,941 -5% $0.13 $0.09 21%
1977 $2,673 0.6898 $1,844 -88% $0.14 $0.09 -1%
1978 $2,480 0.6411 $1,590 -14% $0.11 $0.07 -22%
1979 $21,728 0.5758 $12,510 687% $0.17 $0.10 35%
1980 $47,133 0.5073 $23,910 91% $0.19 $0.10 -1%
1981 $18,817 0.4598 $8,653 -64% $0.20 $0.09 -6%
1982 $12,273 0.4332 $5,316 -39% $0.23 $0.10 9%
1983 $51,958 0.4197 $21,806 310% $0.24 $0.10 -2%
1984 $82,458 0.4023 $33,174 52% $0.29 $0.12 18%
1985 $50,384 0.3885 $19,573 -41% $0.33 $0.13 9%
1986 $106,808 0.3814 $40,735 108% $0.43 $0.16 28%
1987 $148,205 0.3680 $54,533 34% $0.59 $0.22 34%
1988 $125,289 0.3533 $44,269 -19% $0.57 $0.20 -8%
1989 $173,755 0.3371 $58,572 32% $0.63 $0.21 6%
1990 $106,450 0.3198 $34,044 -42% $0.58 $0.19 -13%
1991 $56,989 0.3069 $17,490 -49% $0.59 $0.18 -2%
1992 $86,859 0.2979 $25,878 48% $0.68 $0.20 11%
1993 $203,955 0.2893 $58,999 128% $0.86 $0.25 23%
1994 $102,326 0.2821 $28,861 -51% $0.72 $0.20 -18%
1995 $223,310 0.2743 $61,249 112% $0.90 $0.25 22%
1996 $112,881 0.2664 $30,073 -51% $1.00 $0.27 7%
1997 $56,939 0.2604 $14,829 -51% $1.08 $0.28 6%
1998 $288,397 0.2564 $73,957 399% $0.98 $0.25 -11%
1999 $398,282 0.2509 $99,929 35% $1.07 $0.27 7%
2000 $294,871 0.2427 $71,577 -28% $1.09 $0.26 -1%
2001 $170,548 0.2360 $40,253 -44% $1.14 $0.27 2%
2002 $89,192 0.2324 $20,724 -49% $1.10 $0.25 -5%
2003 $105,671 0.2272 $24,006 16% $1.17 $0.27 4%
2004 $69,753 0.2213 $15,435 -36% $1.29 $0.29 8%
2005 $173,040 0.2140 $37,036 140% $1.34 $0.29 1%

$0.00
$0.20
$0.40
$0.60
$0.80
$1.00
$1.20
$1.40
$1.60
1972 1975 1978 1981 1984 1987 1990 1993 1996 1999 2002 2005
Year
Price Per Poun
d
Inflated
CPI
Figure 7. Average price per pound of red drum landings in North Carolina, 1972 - 2005.
DMF Trip Ticket Program
.
8.1.2 Participants and Trips
The Division of Marine Fisheries keeps rigorous track of the commercial catch
levels of
all fishermen in the state. Information is captured at the point at which catch is
sold to the commercial dealer for every trip. This information can be broken down and
categorized for a closer look at the patterns of behavior of fishermen in any particular
fishery.
Table 8 shows the number of fishermen involved with the fishery since 1999,
broken down by the num
ber of individual trips that resulted in catching red drum in each
year. Notice that these trips are still relatively rare - less than a third of the fishermen
landed drum more than ten times in recent years. Red drum are generally landed as a
bycatch of the flounder and striped mullet estuarine gill net fisheries.
Table 9 breaks down participants in this fishery by annual income from drum.
The num
bers are relatively small, reflecting the bycatch nature of the fishery. From
2001-2005, an average of 6,881 trips per year included a red drum landing, with an
average value of $17.63 per landings. Those same trips averaged $148 in flounder
landings.
34

35
Table 8. Number of participants and the number of trips taken that
landed red drum in North Carolina, 1999 - 2005 (DMF Trip
Ticket Program).
Year
1999 2000 2001 2002 2003 2004 2005
1 Trip 247 274 205 190 183 165 157
% within Year 27% 28% 26% 26% 27% 32% 23%
2 - 10 Trips 425 452 360 357 315 262 304
% within Year 47% 46% 46% 49% 46% 51% 44%
11 - 20 Trips 105 107 90 104 90 46 117
% within Year 12% 11% 12% 14% 13% 9% 17%
21 - 50 Trips 94 114 86 62 68 30 83
% within Year 10% 12% 11% 8% 10% 6% 12%
51 - 100 Trips 33 24 31 22 24 9 29
% within Year 4% 2% 4% 3% 4% 2% 4%
More than 100 Trips 5 5 7 1 2 0 5
% within Year 1% 1% 1% 0% 0% 0% 1%
Total 909 976 779 736 682 512 691
Table 9. Number of participants in the red drum fishery by value of
landings and year in North Carolina, 1999—2005. DMF
Trip Ticket Program
.
Year
1999 2000 2001 2002 2003 2004 2005
$1 - $50 398 455 363 405 348 301 286
% within YEAR 44% 46% 47% 55% 51% 59% 41%
$51 - $100 110 131 113 125 108 75 102
% within Year 12% 13% 14% 17% 16% 15% 15%
$101 - $200 116 101 105 85 100 58 92
% within YEAR 13% 10% 13% 12% 15% 11% 13%
> $200 286 292 199 122 126 78 216
% within YEAR 31% 30% 26% 17% 18% 15% 31%
Total 910 979 780 737 682 512 696
As with any commercial fishery in the state, fishermen who land red drum may
only sell their catch to licensed dealers. The num
ber of dealers who handled red drum
has remained stable for the past decade, fluctuating between 134 and 168 dealers in any
single year (Figure 8.4). The dealers with the highest volume are in the areas that define
Pamlico Sound.

0
20
40
60
80
100
120
140
160
180
1994 1995 1996 1997 1998 1999 2000 2001 2002 2003 2004 2005
Year
Number of Dealer
s
Figure 8. Number of dealers who purchased red drum from 1994—2005. DMF Trip
Ticket Program.
8.1.3 Economic Impact of Commercial Fishery
Table 10 shows the economic impact of the red drum harvest to North Carolina’s
economy over the past six years. These impacts were calculated using IMPLAN, an
economic modeling software. Trip ticket data includes crew sizes (on average between
1.2 and 1.4 for drum-landing trips), so the number of fishermen actually involved is
slightly larger than the “participants” number the DMF uses to indicate the licensed
commercial fishermen who sell fish to dealers. As the fishermen spend their earnings,
these models project that additional economic impact until it leaves the state’s borders,
although the full impact is underestimated since there is no specific data available to
track the flow of dollars between different commercial fishing business, nor a way to
track the economic impact of business taxes for a particular species harvested. Since
trips than land red drum are mostly comprised of other fish, the red drum harvest is
essentially a “bump” that increases the value of other fisheries, and not a larger generator
of money by itself.
In 2005, sales of red drum accounted for roughly one quarter of one percent of the
total value of seafood landed com
mercially in North Carolina, which is not out of line
with historical landings; red drum sales have never exceeded .4% of the state’s total
seafood production.
36

37
Table 10. Economic impact of the commercial red drum fishery in North
Carolina, 2000—2005. DMF Trip Ticket Program
, IMPLAN.
Year Ex-Vessel
Val
ue
Fishermen
(w/crew)
Total Statewide
Impact
Additional Job
s
Created
2000 $294,871 1234 $491,728 2.5
2001 $170,548 965 $284,333 1.5
2002 $89,192 964 $148,857 0.8
2003 $105,671 875 $175,617 0.9
2004 $69,753 664 $122,583 0.5
2005 $173,040 904 $307,347 1.3
8.1.4 Recreational Fishery Economics
The DMF collects data about recreational fishing in conjunction with the federal
governm
ent’s Marine Recreational Fisheries Statistics Survey (MRFSS). MRFSS
estimates for red drum-targeting and red drum-landing recreational trips are in Table 11.
Table 11. Estimated number of red drum-related
recreational fishing trips. MRFSS Program
.
Year Trips
2000 322,873
2001 190,192
2002 361,688
2003 170,633
2004 251,184
2005 289,773
2006 495,430
MRFSS occasionally includes a socioeconomic add-on to generate spending estimates.
The m
ost recent data available is from 2004. The average and total estimated
expenditures per red drum-targeting and red drum-landing recreational trips in 2006 are
shown in Table 12. It should be noted that expenditures in the recreational fishery are
not com
parable to the unexpanded ex-vessel value reported for the commercial fishery.
Data necessary to determine the total economic impact of the red drum landings in the
commercial fishery are currently not available.
Table 12. Estimated expenditures of drum-related recreational fishing
trips. MRFSS Program
.
Trip Type Total Trips Mean expenditures Total Expenditures
Charter 17,908 $ 577.94 $ 10,349,709.06
Shore 132,445 $ 89.82 $ 11,895,856.52
Private 345,077 $ 80.45 $ 27,763,011.17
TOTAL
EXPENDITURES $ 50,008,576.75

38
Drum are also occasionally caught by holders of the Recreational Commercial Gear
License (RCG
L). RCGL fishermen use commercial gear (primarily gill nets and trawls)
to catch fish and shrimp, but cannot sell their catch. A 2004 survey revealed the average
expenditure for a drum-landing (but not necessarily drum-directed) RCGL trip to be
$87.35. There were 5,003 RCGL trips that year that caught red drum, which would
indicate $437,012.05 was spent overall, though most of that would have to be attributed
to other species (primarily flounder) caught in those same nets.
8.2 Social Aspects of the Fishery
8.2.1 Commercial Fishermen
The socioeconomic program at the DMF has been conducting a series of in-depth
interview-style surveys with com
mercial fishermen along the coast since 2001. Data
from these interviews is added to a growing database and used for fishery management
plans, among other uses. A total of 432 of the fishermen in the database have had
commercial landings of red drum according to the trip ticket program. That group is used
to provide a snapshot of North Carolina fishermen who catch red drum.
8.2.1.1 Demographic Characteristics of Commercial Fishermen
Table 13 shows the demographic characteristics of the red drum-reporting
fisherm
en surveyed by the Socioeconomic Program over the past five years. Nearly all
were white males, with an average age of 50 and over 27 years of commercial fishing
experience. Two thirds of them had a high school diploma and 23% had at least some
college education. Half had $30,000 or less in household income when surveyed, with
24% bringing in $50,000 or more. Only 9% had less than $15,000 in annual household
income (Table 13).
2
Fishing accounted for 70% of the household income from these fishermen, and
48% reported that fishing was their sole source of income. They are least likely to fish
December through April, which is the slowest time of the year for most fishermen. They
own an average of 1.7 registered commercial fishing vessels.
8.2.1.2 Historical Importance of the Commercial Fishery
A historical overview of the red drum fishery can be found in Section 7.0,
Description of the Fisheries. The socioeconom
ic interviewers asked fishermen how
important commercial fishing has historically been in their communities. Almost all of
them felt it had been vital, giving it a 9.4 on a 10-point scale. Perceptions of current
community support were lower, at 7.1. The statement “fishing is important economically
in my community” drew an 8.5.
2 The refusal rate on the household income question was 4%.

39
Table 13. Demographic characteristics of red drum commercial
fisherm
en. DMF Socioeconomic Program.
Variable n = 432 Average or %
Years Fishing 27.3
Age 50.2
Gender Male 97%
Female 3%
Race White 98%
Black 1%
othe
r
1%
Education Level Less than HS 32%
HS Grad 45%
Some College 17%
College Graduate 6%
Marital Status Married 78%
Divorced 10%
Widowed 3%
Never Married 1%
Separated 8%
Total Household Income Less than $15,000 9%
$15,001 - $30,000 41%
$30,001 - $50,000 24%
$50,001 - $75,000 17%
More than $75,000 7%
8.2.1.3 Community Reliance on the Commercial Fishery
Given its status as a bycatch fishery, no commercial fishermen in North Carolina
rely prim
arily on red drum to make a living; drum fishermen are instead mostly flounder
and striped mullet fishermen who land the occasional red drum in their nets, and target
other species as well such as blue crabs, clams, and shrimp (Table 14)
Table 14. Prevalent species targeted by red drum commercial
fisherm
en. DMF Socioeconomic Program.
Species % who land
Flounder 59.5%
Blue crabs 36.8%
Clams 25.2%
Shrimp 24.3%
Striped Mullet 23.1%
Perch 22.0%
Spot 18.9%
Sea Mullet 15.1%
Striped Bass 14.8%
Shad 14.8%

8.2.1.4 Perceived Conflicts
Fishermen were asked about conflicts in the previous year with recreational users
and with other com
mercial fishermen. Conflicts with other users of a public resource are
to be expected, and part of the job of the DMF is to balance the needs of different user
groups. Less than a third of fishermen reported conflicts with other commercial
fishermen. A slightly larger percentage reported having had conflicts with recreational
fishermen, with two-thirds reporting no conflict in the previous year (see Figure 9).
Perceptions of conflicts with federal regulations were stronger, with a quarter
m
entioning 20+ conflicts over the previous year, though the overall numbers were still
relatively low. Reported conflicts with state regulations are quite different: more than a
third reported “daily” conflicts with the state, and more than half had 20+ conflicts.
Figure 9. Reported conflicts of Commercial Fishermen (DMF Socioeconomic Progam).
8.2.1.5 Perception of Important Issues
The fishermen were also asked to rate the seriousness of a number of issues
facing them
selves and their businesses. State regulations were the most important issue,
followed by the related issues of imported seafood and low prices (Table 15).
Table 15. Fishing related issues considered most important to fishermen
who landed drum
. DMF Socioeconomic Program.
Ranking Issue
1 State Regulations
2 Imported seafood
3 Low prices for seafood
4 Keeping up with regulations
5 Size limits
6 Federal regulations
7 Costs of doing business
8 Gear restrictions
40

41
8.3.1 Recreational Fishery
The DMF has no information about hook-and-line red drum fishermen, or the
issues that they find m
ost important, though presumably regulations would be important
to them as well. The survey of RCGL holders did reveal some demographic and
attitudinal statistics comparable to those of the commercial fishermen; in age and sex, the
RCGL holders are nearly identical to SCFL holders, but the RCGL holders have
generally higher education and household incomes (see Table 16).
Table 16. Demographic characteristics of red drum RCGL
fisherm
en. DMF RCGL Program.
Variable n = 91 Average or %
Age 75% over 40
Gender
Male 96%
Female 4%
Race
White 96%
Black 4%
Education Level
Less than HS 8%
HS Grad 27%
Some College 30%
College Graduate 35%
Marital Status
Married 78%
Divorced 9%
Widowed 2%
Never Married 10%
Separated 1%
Total Household Income
Less than $15,000 12%
$15,001 - $30,000 11%
$30,001 - $50,000 22%
$50,001 - $75,000 22%
More than $75,000 33%
RCGL holders were also surveyed on conflicts with other fishermen and asked their
opinions about the am
ount of gear in the water. Those results are shown below in Figure
10.

Figure 10. Perceptions of Recreational Com
mercial Gear License Holders. (DMF RCGL
Program).
8.4 Research Recommendations
The most pressing socioeconomic research issue is for data about the hook-and-
line recreational red drum
fishery. Unlike commercial fishermen, recreational anglers
can and do target red drum, and it is a popular fish for catch-and-release fishermen.
Annual surveys of recreational anglers, modeled on the already-proven commercial
fishermen survey, would be the best approach for gathering the necessary social and
economic data.
8.5 Definitions and Acronyms
CPI (Consumer Price Index)
– The CPI measures the price paid by consumers for a fixed
group of goods and services. Changes in the CPI over time constitute a common measure
of inflation.
Deflated (Inflation-adjusted) price and value
– Inflation is a general upward price
movement of goods and services in an economy, usually as measured by the Consumer
Price Index (CPI). Ex-vessel prices and values can be adjusted (deflated) according to
the CPI to remove the effects of inflation so that the value of a dollar remains the same
across years. Inflation adjusted values allow for easier understanding and analysis of
changes in values. Some products allow for a Producer Price Index (PPI). The PPI
measures inflation in wholesale goods. It is considered a more reliable indicator than
CPI because it is related to a specific product or group of products. The PPI is related to
the CPI in that PPI is considered a precursor to CPI because fluctuations in production
costs are usually associated with general measures of inflation.
42
43
9. ENVIRONMENTAL FACTORS
9.1 Habitat
As described in the life history section of the plan, red drum utilize a variety of
estuarine and oceanic habitats throughout their life cycle. Each habitat provides
ecological services that aid in m
aintaining and enhancing the red drum population, and
also influences the functioning of the ecosystem overall. Protecting the integrity of the
entire system is therefore necessary to manage this species. The South Atlantic Fishery
Management Council recognizes several habitats as Essential Fish Habitat (EFH) for red
drum from Virginia to Florida. In North Carolina, these natural communities include
tidal freshwater, estuarine emergent vegetated wetlands (flooded salt marsh, brackish
marsh, and tidal creeks), submerged rooted vascular plants (sea grass), oyster reefs and
shell banks, unconsolidated bottom (soft sediment), ocean high salinity surf zones, and
artificial reefs (SAFMC, 1998).
Of the designated EFH, Habitat Areas of Particular Concern (HAPC) have been
recognized for red drum
by the SAFMC. Areas which meet the criteria for HAPC in
North Carolina include all coastal inlets, all state-designated nursery habitats of particular
importance to red drum, documented sites of spawning aggregations, other spawning
areas identified in the future, and areas supporting submerged aquatic vegetation (SAV)
(SAFMC, 1998). These HAPC include the most important habitats required during the
life cycle of the species, including spawning areas and nursery grounds. Other areas of
concern are barrier islands, since these geological formations are vital to maintain
estuarine conditions needed for larval and juvenile stages. Information on the ecological
value of each of these habitats to red drum and their current condition is provided below.
9.1.1. Water column
Red drum depend on the water column throughout their life history for spawning,
larval transport, feeding, and m
igration. In North Carolina, large concentrations of red
drum occur around Ocracoke, Hatteras, and Oregon Inlets and along adjacent beaches
and shoals in the spring prior to entering Pamlico Sound for the summer (Ross and
Stevens 1992; Luczkovich et al. 1999). In August adult drum will concentrate around
inlets and the mouths of some rivers to spawn and remain in the vicinity through October.
Gravid and spent adults have been documented by DMF in the vicinity of Hatteras,
Ocracoke, and Drum inlets, as well as in the mouth of the Pamlico, Neuse, and Bay
rivers, and other bays in that vicinity, indicating spawning activity in those areas (Ross
and Stevens, 1992). Luczkovich et al. (1999) confirmed that spawning occurred in these
areas using hydrophone surveys to detect characteristic spawning knocks and
ichthyoplankton surveys to locate sciaenid eggs. Red drum spawning was detected on
the east (Ocracoke and Hatteras Inlet areas) and west (Bay River) sides of Pamlico Sound
in August, September, and October, with the greatest amount of activity occurring in
September. Luczkovich et al. (1999) concluded that areas near the mouth of Bay River
appear the most critical for spawning red drum within their study area.
44
In 2003 and 2004, hydrophone surveys were conducted in the lower Neuse River
estuary, to locate and assess the significance of spawning aggregations in that area
(Barrios 2004). The surveys found that red drum
spawning aggregations occurred in the
lower Neuse River estuary from approximately Oriental to the mouth of the river, and
were most concentrated in August and September. The location of spawning activity was
positively related to water depth (> 4.5 m), oxygen levels (> 2.5 mg/l) and proximity to
river mouth (salinity approx. 20-25 ppt). Spawning occurred over mud bottom and
subtidal shell bottom. By spawning closer to the nursery grounds, the probability of
successfully reaching the nursery grounds and surviving could be greater than for eggs
spawned at ocean inlets.
Currently, a large hook and line recreational fishery exists at some of these known
spawning aggregations in Pam
lico Sound. There is concern that the act of capturing and
releasing these large gravid fish could potentially have a negative impact on spawning
success due to stress or post-release mortality. Catch and release mortality studies in this
fishery have found that J-hooks result in significantly greater incidence of deep hooking
and as a result, have release mortality rates that are higher than for fish captured using
circle hooks. Requiring the use of circle hooks in Pamlico Sound during the spawning
season could alleviate some of the impacts of this fishery. This issue is further addressed
in Section 10.2.2 Recreational Targeting of Adult Red Drum.
In areas south of Pamlico Sound, collection of gravid adults, larvae, and early
post-settlement juveniles has indicated localized spawning activity. Red drum larvae
have been documented in low numbers in the vicinity of Beaufort and Barden inlets
(Hettler and Chester 1990; Powell and Robbins 1998). Aggregations of ripe adult
females near New River and Cape Fear River inlets and the presence of larvae and post
settlement juveniles in adjacent estuaries indicated spawning in those areas. (DMF
unpub. data; Stewart 2006). The extent that other inlets in North Carolina are utilized for
spawning has not been documented.
Fertilized eggs and larvae are transported through the water column from the
spawning sites to shallow bays and estuaries (W
einstein 1980; Holt et al. 1989; Peters et
al. 1995). Larval transport studies in North Carolina have found that ocean and inlet
spawned larvae are dependent on the appropriate wind and current conditions to occur so
that larvae can pass into and be retained in the estuary (Hare et al.1999). Because of this,
recruitment success of red drum in North Carolina, Texas, and Florida appears to be
highly influenced by local nearshore wind-driven currents, tidal flow patterns, as well as
estuarine flush rates (Peters and McMichael 1987; Scharf 2000; Brown et al. 2005;
Stewart 2006). In the Neuse River estuary and other western Pamlico Sound tributaries,
northeast winds will enhance recruitment into adjacent shallow tributaries (Barrios 2004).
In a study conducted in estuaries further south, the greater relative abundance of juvenile
red drum in the New River estuary compared to the Cape Fear River system was
attributed to hydrologic differences that result in greater retention of larvae in the New
River system (Stewart 2006). While the New River is shallow, broad, and has reduced
tidal exchange, the Cape Fear River is deep, connects directly to the ocean, and has a
shorter flush time.
In addition to its role in spawning and larval transport, the water column provides
food and oxygen critical for survival and growth of red drum
populations. Inlets are also
very important for their role in mixing of sea water and fresh water, which is critical for
45
maintaining salinity and current regimes, dispersing nutrients and pollutants, and
providing m
igratory corridors for juvenile and adult fish and invertebrates. There are
currently 20 inlets in North Carolina that connect estuarine waters to the sea. Unnatural
or human-induced changes that reduce or increase flow into estuaries may result in
environmental stress in organisms (SAFMC, 1998).
Red drum populations are affected by water quality conditions wherever they
occur in the system
. In North Carolina and other areas, year class strength of red drum is
variable and highly dependent on large-scale processes and environmental conditions that
effect recruitment success, such as temperature, salinity, currents, predation, and growth
rates (Scharf 2000). Predation and growth rates are affected by habitat as well as water
column conditions. More information on water quality is in Section 9.2. The use of
various habitats by red drum and their status are described below.
9.1.2. Wetlands
Wetlands are one of several important nursery habitats for red drum. Tidal marsh
wetlands generally occur along the edge of estuaries and sounds in polyhaline and
m
esohaline waters. The combination of shallow water and thick vegetation provides
excellent nursery and foraging habitat for red drum and many other fish species (Graff
and Middleton 2003). Shallow wetlands also provide refuge from large fish predators
and provide a safe corridor for migration to other habitats within the system (Mitsch and
Gosselink 1993; Rozas and Odum 1997). It is estimated that over 95% of commercially
harvested finfish and invertebrates in the United States are wetland dependent, a strong
indication of their high habitat value (Feierabend and Zelanzy 1987). Riparian wetlands
are also highly effective and well recognized for their ability to trap and filter pollutants
from upland runoff, and store, spread, and slow stormwater runoff prior to entering
surface waters (Mitsch and Gosselink 1993).
Juvenile red drum have been primarily collected in tidal creeks and embayments
adjacent to tidal m
arsh wetlands in both high and low salinity waters. Studies have
shown that juvenile red drum in vegetated areas suffer significantly less predation
mortality than those in unvegetated areas (Rooker et al., 1998). Also, laboratory
experiments found that red drum grew significantly faster in marsh and seagrass habitats
compared to shell and nonvegetated bottom (Stunz et al 2002). However field
experiments comparing growth rates of red drum from the same habitats did not find
significant differences in growth, perhaps a reflection of movement among and use of
multiple habitats within the estuary.
Coastal wetlands were mapped by NC Division of Coastal Management (DCM)
in 1994 and are shown in Figure 11. There are estimated to be approximately 254,000
acres of fresh, brackish, and salt m
arsh in North Carolina (Sutter, 1999). Pamlico, Core,
and Bogue sounds, and estuaries south of Bogue Sound, have the highest percentages of
estuarine wetlands. The largest acreage of salt/brackish marsh is in the Pamlico Sound
region (Street et al. 2005).

Figure 11. Location of esturarine and riverine wetlands in coastal North Carolina,
based on 1994 DCM mapping data (Street et al. 2005).
9.1.3. Submerged Aquatic Vegetation
Submerged aquatic vegetation is another habitat utilized by red drum as a nursery
area. SA
V habitat is defined in the Coastal Habitat Protection Plan (CHPP) as “bottom
recurrently vegetated by living structures of submerged, rooted vascular plants (roots,
rhizomes, leaves, stems, or propagules), as well as temporarily unvegetated areas
between vegetated patches” (Street et al. 2005). Submerged aquatic vegetation occurs in
both subtidal and intertidal zones and may be colonized by estuarine species, such as
eelgrass (
Zostera marina), shoalgrass (Halodule wrightii), or widgeon grass (Ruppia
maritima) or freshwater species, such as wild celery (Vallisneria americana) and sago
pondweed (
Potamogeton pectinatus).
Over 150 species of fish and invertebrates have been documented by DMF in
seagrass beds in eastern Pam
lico and Core sounds, including red drum (DMF 1990). The
three-dimensional structure provides a surface for small plants and animals to attach to
and provides a safe refuge and foraging area for a large number of juvenile fish and
invertebrates (SAFMC 1998). The structure of SAV grass blades provides an excellent
46
47
nursery area and enhances a safe corridor between habitats, reducing predation (Micheli
and Peterson 1999).
Eggs, larvae, postlarvae, young-of-year and sub-adult red drum have been
documented in mesohaline and polyhaline SAV beds (Mercer 1984; Thayer et al. 1984;
Reagan 1985). In North Carolina, SAV is utilized as a nursery area where it is available,
and also as a foraging area for subadult red drum. Data collected by DMF through the
seine survey and tagging studies indicate high abundance of late age-0 red drum in
shallow, high-salinity grass beds behind the Outer Banks. SAV is also particularly
important as foraging grounds for one and two-year-old fish (Ross and Stevens, 1992;
DMF unpub. data). Juveniles appear to be more abundant in ecotonal areas with patchy
grass coverage than in homogeneously vegetated sites (Mercer 1984; Reagan 1985; Ross
and Stevens 1992).
SAV also enhances the entire ecosystem by stabilizing and trapping sediment,
reducing wave energy and cycling nutrients within the system
(Thayer et al. 1984). Beds
of SAV also produce large quantities of organic matter, which supports a complex food
base for numerous fish and other organisms (Thayer et al. 1984).
The amount of SAV in North Carolina was estimated to be between 134,000 and
200,000 acres around 1990 (Ferguson and W
ood 1994; Carraway and Priddy 1983). The
majority of SAV occurred in eastern Pamlico Sound and Core Sound in high salinity
waters (Figure 12). SAV was also documented to occur in a narrow band along a portion
of the western Pam
lico Sound shoreline and the Pamlico and Neuse rivers and tributaries,
although its distribution and abundance in this area was underestimated due to reduced
water clarity. However, Davis and Brinson (1990) qualitatively described the location of
SAV in this area. Areas south of Bogue Sound have not been mapped. Because light is
the primary limiting factor affecting its distribution, SAV is restricted to relatively
shallow waters, usually less than two meters in depth. The amount of SAV fluctuates
seasonally and inter-annually, depending on the species and salinity regime.

Figure 12. Distribution of known submerged aquatic vegetation habitat in North
Carolina (Street et al. 2005).
9.1.4. Soft bottom
Red drum also utilize shallow estuarine soft bottom as a nursery and foraging
area. This habitat consists of unconsolidated, unvegetated sedim
ent that occurs in
freshwater, estuarine, and marine systems. Wetlands, SAV and shell bottom often occur
adjacent to shallow soft bottom. Sediment composition varies from sand to fine muds
due to geomorphology and location within the system and may be a factor in juvenile red
drum distribution. Courser sandy sediments are concentrated along eroding or high
energy shorelines and shallower perimeter of waterbodies, while finer mud sediments are
located along low energy shorelines or deeper water (Riggs 1996). Soft bottom is
valuable as a foraging area for demersal fish and shallow portions are utilized as nursery
areas. The sediment type and energy regime will affect the primary and secondary
productivity of the bottom, and therefore the food available to red drum. Benthic
mircoalgae growing on the surface of the sediment provide a food base for the
invertebrates on which red drum forage (Peterson and Peterson 1979). The dominant diet
of juvenile red drum (16-30 mm in length) consists of benthic invertebrates typically
found in soft bottom, such as copepods, mysid shrimp, amphipods, and polychaetes
48
49
(Daniel 1988; Llanso et al 1998). As red drum grow, the dominant prey shifts to grass
shrim
p (when approx. 60-90 mm in length). At around 100 mm, dominant diet consists
of crabs, penaeid shrimp, and juvenile fish (Mercer 1984). Red drum larger than 300
mm, feed on a mix of blue crab and other portunid crabs, penaeid shrimp, small pelagic
fish (anchovy, menhaden, silversides) and some demersal fish (flounder, pinfish) (Scharf
and Schlicht 2000). Although there is little benthic structure associated with soft bottom,
shallow bottom can provide refuge and a migratory corridor that large predators cannot
access (Peterson and Peterson 1979).
Subadult and adult red drum forage in the surf zone and shoals in the nearshore
ocean and inlet system
s. In addition to providing fishery functions for juvenile and adult
red drum, soft bottom plays a very important role in the ecology of estuarine ecosystems
by storing and cycling nutrients, chemicals and microbes. Intense biogeochemical
processing and recycling establishes a means to trap and reprocess natural and human-
induced nutrients and toxic substances.
9.1.5. Shell bottom
Red drum use shell bottom as nursery and foraging areas to some extent. Shell
bottom
habitat is estuarine intertidal or subtidal bottom having concentrations of shell,
including living or dead oysters (
Crassostrea virginica), hard clams (Mercenaria
mercenaria), and other shellfish. Common terms used to describe shell bottom habitats
in North Carolina are “oyster beds,” “oyster rocks,” “oyster reefs,” “oyster bars,” and
“shell hash.” Shell hash is a mixture of sand or mud with gravel and/or unconsolidated
broken shell (clam, oyster, scallop, and/or other shellfish). Intertidal oyster reefs in the
central and southern estuarine systems are usually only a few oysters thick. However,
subtidal oyster mounds in Pamlico Sound can be several meters tall (DMF 2001). In
North Carolina, oysters attach to and accumulate on existing oyster beds, other shell, hard
structures and exposed
Spartina roots (DMF 2001). Intertidal oyster reefs in North
Carolina may occur along the adjacent to salt marsh and SAV, or as isolated reef features,
away from other structure (Grabowski et al. 2000). Oyster distribution and abundance
are limited by salinity, high temperature (Funderburk et al. 1991) and predators like
oyster drills and boring sponges (Bahr and Lanier 1981). In North Carolina, intertidal
oyster beds occur extensively throughout the central and southern coast where salinity
ranges from 14 to 30 ppt. Subtidal oyster reefs also occur in the New, Newport and White
Oak rivers. In the Albemarle-Pamlico system, oysters are concentrated in the lower
portion of Pamlico Sound tributaries, along the western shore of Pamlico Sounds and to a
lesser extent behind the Outer Banks (Street et al. 2005).
The complex three-dimensional structure provides protective cover for juvenile
and sub-adult red drum
, while the small invertebrates living on and among oyster shells
provide a food source (Meyer et al. 1996; ASMFC 2007). Fringing shell bottom or shell
hash may serve as a nearshore corridor between habitats such as salt marsh and SAV,
which red drum utilize (ASMFC 2007; Micheli and Peterson 1999). Juvenile red drum
have been documented in shell bottom habitat in South Carolina (Daniel 1988; Coen et
al. 1999), Virginia (Luckenbach and Ross 2003), Texas (Stunz et al. 2001), and North
Carolina (Grabowski et al. 2002). Barrios (2004) documented spawning aggregations of
red drum over subtidal shell bottom (3-5 m water depth) in the lower Neuse River
50
estuary. The bathymetric relief provided by the shell structure was thought to attract
adults and enhance foraging during the spawning season. Peterson et al. (2003), in
reviewing studies exam
ining fish use of shell bottom habitat, found that red drum were
documented utilizing shell bottom in two out of five past studies. However it was
inconclusive whether the presence of oyster beds enhanced red drum abundance.
Shell bottom also provides many important functions that enhance the health of
the entire ecosystem
for fishery and non-fishery species. Oysters filter sediment and
pollutants from the water column, enhancing water quality and improving conditions for
SAV growth. The hard multi-faceted shell structure aids in reducing wave energy,
stabilizing sediment, and reducing shoreline erosion. Oysters, like SAV and benthic
microalgae, facilitate storage and cycling of nutrients (ASMFC 2007).
9.1.6. Nursery habitat preference
Habitat preference by juvenile red drum varies somewhat regionally. In Gulf
coast estuaries, studies indicated that SAV was the preferred nursery habitat for red
drum
, (Stunz et al. 2002; Rooker et al. 1999). However, where SAV was sparse or not
present, the highest densities of newly recruited red drum were found at the
Spartina
marsh edge interface and within 1 m inside of the marsh edge. Red drum were not found
at 5 or 10 m inside of the marsh edge or at 30 m waterward of the marsh edge. Relatively
low densities of red drum were found on soft bottom and no red drum occurred in shell
bottom. In contrast, in South Carolina, post-larvae and juveniles settle out in meso-
euryhaline estuaries (10-25 ppt) on mud and sand bottom with oysters and shell hash as
well as shallow tidal marsh creeks (Daniel 1988).
In North Carolina, juvenile red drum habitat includes detritus or mud bottom
wetland creeks in western Pam
lico Sound and Pamlico and Neuse rivers, grass beds
behind the Outer Banks, and mud or sand bottom in shallow water in other areas (Ross
and Stevens, 1992). The most common habitat characteristics among DMF sampling
sites is shallow water depth (<5 feet) and relatively wind-protected water bodies. Results
from directed red drum seine surveys and fishery independent sampling have documented
juveniles from the Cape Fear River, north through Buzzard Bay in Dare County (Ross
and Stevens, 1992). Juveniles were most consistently abundant at the stations located
near the mouths of the Pamlico and Neuse rivers and the bays and rivers between these
two large rivers. In the Cape Fear and New rivers, juvenile red drum utilize the shallow
upper reaches of polyhaline and mesohaline tidal creeks and tidal marsh fringe along the
rivers (Weinstein 1979; Stewart 2006). Shell hash is found on the bottom of some of the
tidal creeks where red drum occur. More information is needed on red drum utilization
of shell hash and oyster reefs.
Powers and Gaskill (2004) conducted seine surveys in low (10-20 ppt) and high
(28-35 ppt) salinity estuaries in N
orth Carolina to assess recruitment and abundance in
various habitats. They found juvenile red drum were more common in the lower salinity
estuaries (Adams Creek, Slocum Creek, and other upper Neuse tributaries) then in the
higher salinity areas, such as Core, Bogue and Back sounds and the mouth of the Neuse
River, regardless of habitat type. Powers and Gaskill (2004) concluded that higher
abundance of mid-level predators in the lower estuary (higher salinity sites) in the fall

51
might be limiting recruitment success of red drum in those areas. Habitat use in the low
salinity areas included tidal creeks, m
arsh edge, and sandy beach habitat, although drum
were most abundant along sandy beaches. In higher salinity estuaries, red drum occured
in the same habitats, as well as seagrass beds, but at lower overall abundance levels than
habitats in upstream sites. When habitat use by juvenile red drum was assessed in
mesocosm experiments, results indicated that juvenile red drum occupied sand bottom
the most, followed by oysters and then artificial SAV (Powers and Gaskill 2004). More
field research along North Carolina’s coast is needed to determine juvenile habitat
preference and examine if recruitment is habitat limited.
9.1.7. Habitat condition
Because red drum utilize multiple habitats, protecting the integrity of the entire
system
is necessary to manage this species. Protection and enhancement of spawning
and nursery areas may be particularly important to enhance growth and survival of
juvenile red drum. In North Carolina, there have been reported losses of wetlands, SAV,
and shell bottom habitat. Since studies indicate that use of SAV and marsh edge by
juvenile red drum reduce predation rates and increase growth rates (Rooker et al. 1998;
Stunz and Minello 2001; Stunz et al. 2002), an increase in habitat coverage could
potentially improve recruitment success. Levin and Stunz (2005), assuming red drum
populations were not recruitment limited, estimated through modeling of a hypothetical
red drum population, that restoring marsh edge and SAV habitat in Galveston Bay to
their near original amounts could increase average post-settlement survival in Galveston
Bay by 24%, sufficiently abating the rate of population decline.
Wetlands
It is estimated that as much as 34-50% of North Carolina’s original wetland
coverage w
as lost, primarily due to ditching, channelization, and filling for agriculture
and development (Dahl 1990; DWQ 2000a). According to the Division of Water Quality
(DWQ 2000a), approximately 88% of salt/brackish marsh, 81-88% of riverine forested
wetlands, and 48% of pocosins remain. According to DCM, 29,560 acres (11.6%) of
existing salt, brackish, and freshwater marsh appear to be physically altered. From the
early 1800s to the early 1900s, ditching and draining for agriculture accounted for the
majority of wetland losses (Heath 1975). From about 1950 to the 1990s, conversion to
managed forest and agriculture accounted for 53% and 42%, respectively, with
development associated activities responsible for the remaining 5% (Bales and Newcomb
1996). Since 1990, there have been greatly reduced losses from agriculture and forestry
and increasing losses from development. However, between 1998 and 2000, due to a
change in federal wetland regulations (repeal of Tulloch Rule), approximately 12,000
acres of wetlands were ditched and drained, primarily in the southern portion of the coast.
Changes in state regulations are now in place to prevent such activity. Except for this
period, there have been no new large-scale wetland drainage projects since the mid-
1970s.
The primary threats to wetland habitat today are filling, dredging, and
hydrological alterations associated with residential and com
mercial development. The
Coastal Resource Commission (CRC) regulates development activities in Areas of

Environmental Concern, which include coastal wetlands (15A NCAC 7H .0205).
Generally, no development is allowed in coastal wetlands except water dependent
activities, such as docks. The Environmental Management Commission (EMC) manages
wetlands through the 401/404 Certification Program, under the federal Clean Water Act.
This program focuses on avoiding and minimizing filling of wetlands and streams
through review of all Environmental Assessments, Coastal Area Management Act
(CAMA) Major, and US Army Corps of Engineers (COE) permit applications.
Although the rate of wetland loss from dredging and filling activities has slowed,
sm
aller losses continue to occur, which may still result in cumulative impacts. From
2001 to 2006, in the five river basins where red drum occur, a total of 904 acres of
wetlands were permitted by DWQ, to allow impacts from dredging or filling (Table 17).
The greatest wetland im
pacts occurred in the Cape Fear, followed by the Neuse. The
total acres impacted by year ranged from 80 in FY 2003/2004 to 228 in FY 2005/2006.
Compensatory mitigation for permitted losses and voluntary restoration efforts have
partially offset some of these losses. However, the type of wetland gained is often not
equivalent to what was lost. In addition, not all impacts require mitigation.
Table 17. DWQ 401 permitted wetland impacts (acres) in coastal river basins
inhabited by red drum
, 2001-2006 (DWQ, unpubl. data, R. Ridings, 2007).
River Basin 2001/2002 2002/2003 2003/2004 2004/2005 2005/2006 Total
Cape Fear
152.04 52.98 38.93 32.90 138.36 415.21
Neuse
30.22 91.55 15.25 88.38 40.72 266.12
Pasquotank
16.53 25.66 9.28 22.71 9.33 83.51
White Oak
7.22 12.79 7.84 37.45 5.97 71.27
Tar-Pamlico
7.39 5.07 9.36 13.16 33.72 68.70
Total
213.40 188.05 80.66 194.60 228.10 904.81
.
In 2003 the Ecosystem Enhancement Program (EEP) was established through a
cooperative agreem
ent with the Department of Transportation (DOT), Department of
Environment and Natural Resources (DENR), and COE. The program was developed to
provide environmental mitigation to offset unavoidable impacts associated with
transportation and other development, with the goal of restoring, enhancing, preserving,
and protecting wetlands, streams, and riparian area functions (EEP 2006). EEP oversees
mitigation programs for wetland impacts related to 1) transportation, 2) statewide stream
and wetland 401 permits, 3) removal of riparian buffers, and 4) nutrient offset impacts.
The program has been increasing the amount of wetland and stream mitigation completed
annually. In FY 2005-2006, wetland and stream credits for state wetland in-lieu fee
impacts exceeded the wetland mitigation requirements (generally at least a 2:1 ratio with
acres impacted). The riparian buffer and nutrient offset programs have also resulted in a
net positive gain. Since 2003, more than $2 billion in approved and pending
transportation projects are moving forward because required compensatory mitigation
was met. In FY 2005-2006, 310,000 ft of stream and 589 acres of wetland mitigation
52
53
projects were begun. Work involves a mix of restoration, enhancement, and high quality
preservation (EEP 2006).
Shoreline stabilization results in direct and gradual loss of wetlands but is not
accounted for through the 401 perm
it process. Hard stabilization along estuarine
shorelines can result in a cumulative loss of wetlands since a hardened structure 1)
prevents landward migration of wetlands over time, 2) results in loss of marsh vegetation
waterward of the structure, which can not reestablish due to increased wave energy and
scour against the vertical structure (Garbisch et al. 1973; Knutson 1977), and 3) reduces
or eliminates the intertidal habitat due to shoreline deepening. Several studies have
found that abundance of juvenile fish adjacent to bulkheaded shorelines was much less
than what occurred adjacent to unaltered naturally vegetated shorelines (80-300% less)
(Mock 1966; Peterson et al. 2000; Waters and Thomas 2001). The difference was
attributed to lower abundance of organic detritus and small benthic invertebrates, deeper
water, and less intertidal vegetation. Ocean shoreline stabilization and prevention of
barrier island processes, such as overwash and inlet migration, suppresses development
of new tidal marsh behind barrier islands and is another deterrent to wetland expansion.
According to permit records, DCM issued perm
its between 1984 and 2000 to
stabilize approximately 457 miles of shoreline (11.7% of the estimated 3,900 miles of
estuarine shoreline). During this time period, the amount of shoreline stabilization
permitted annually along the coast has ranged from eight to 91 miles. These numbers
must be considered with caution since the numbers include CAMA permits include
repairs, replacements, or projects that may not have been done or completed, and there
could be data entry errors. Beaufort, Dare, Carteret, and Currituck counties have the
greatest total lengths of permitted bulkheads. In these counties, the percent of hardened
shoreline along major waterbodies ranges from roughly 8% to 32%. Because shoreline
stabilization contributes to wetland loss which would impact nursery habitat, there is a
need to more accurately assess where and how much of the estuarine shoreline is
hardened.
As part of CHPP implementation actions, the CRC is currently in the process
of revising estuarine shoreline management rules using recommendations from the
Estuarine Shoreline Biological and Physical Processes Work Group to minimize impacts
to natural shoreline and nearshore fish habitat functions. These rule changes will try to
encourage use of the most environmentally sensitive stabilization structure that is also
effective for each specific location.
Ongoing initiatives such as wetland restoration, land acquisition and preservation,
and agricultural cost-share BMPs need to be enhanced to offset continued losses. There
should also be additional initiatives implemented to protect and enhance wetland habitat.
The many fishery and water quality functions provided by wetlands make their
preservation and restoration along North Carolina’s coast a high priority for protection of
all coastal fish habitats.

54
SAV
The current spatial distribution and acreage of SAV is unknown since some areas
that historically supported SAV were not m
apped, western Pamlico sound tributaries
were not accurately quantified, and changes may have occurred since the original
mapping. While there are reports of large-scale losses of SAV in North Carolina’s low
salinity tributaries on the mainland side of Pamlico Sound, (North Carolina Sea Grant
1997; J. Hawkins, DMF, pers. com, 2003), the high salinity grass beds behind the barrier
islands appear relatively stable (Ferguson and Wood 1994). Efforts are currently
underway to quantitatively map high and low salinity SAV habitat in 2007 through an
interagency effort coordinated by Albemarle Pamlico National Estuary Program. The
Division is a partner in this effort. This will provide baseline information on distribution
of SAV in some areas, and allow trend analysis in distribution and abundance of SAV in
eastern Pamlico, Core and Bogue sounds. Additional field monitoring of existing SAV
beds is needed to identify environmental conditions necessary to support SAV, and
model where SAV could potentially occur in shallow water.
The greatest threat to SAV is large-scale nutrient enrichment and sediment
loading, which increases turbidity, reduces light penetration, and subsequently im
pacts
SAV growth, survival, and productivity (Goldsborough and Kemp 1988; Kenworthy and
Haunert 1991; Funderburk et al. 1991; Stevenson et al. 1993). Catastrophic losses of
seagrass beds have been correlated with these water quality problems in other states in
the past (Twilley et al. 1985; Orth et al. 1986; Durako 1994). Nutrient enrichment and/or
increased sediment loads impact SAV growth, survival, and productivity by increasing
chronic turbidity in the water column from suspended sediment or phytoplankton
associated with algal blooms. In North Carolina, most of the low salinity areas that have
experienced large reductions in SAV coverage (Tar-Pamlico River and Neuse River
basins) have nutrient loading issues and are designated Nutrient Sensitive Waters. Once
SAV is lost, increased turbidity and sediment destabilization can result in accelerated
shoreline erosion and make recolonization more difficult (Durako 1994; Fonseca 1996).
Therefore, prevention of any additional SAV loss through water quality maintenance and
improvement is a high priority for red drum management.
Increased sediment and nutrient loading in the water column can enter coastal
waters from
point source discharges, nonpoint source stormwater runoff, or resuspension
of bottom sediments. Specific sources that contribute to increased sediment loading
include construction activities, unpaved roads, road construction, golf courses,
uncontrolled urban runoff, mining, silviculture, row crop agriculture, and livestock
operations (DWQ 2000b). Specific sources that contribute to increased nutrient loading
include agricultural and urban runoff, wastewater treatment plants, forestry activities, and
atmospheric deposition. Nutrients in point source discharges are from human waste, food
residues, cleaning agents, and industrial processes. The primary contributors of nutrients
from nonpoint sources are fertilizer and animal wastes (DWQ 2000b).
In North Carolina, there are water quality standards for light associated
param
eters including turbidity, total suspended solids (TSS), and chlorophyll
a.
Modifications to regulatory water quality standards may be needed to improve their
effectiveness for SAV protection. A review of current chlorophyll, TSS, and turbidity

55
standards should be conducted to determine if they are appropriate for the protection of
SA
V in North Carolina waters or if a new standard for protecting water clarity for SAV is
needed.
Dredging for navigational channels, marinas, or other infrastructure can
physically dam
age or remove SAV, while shading from docks over grass beds can lead to
gradual loss of SAV beneath the structures (Loflin 1995; Shafer 1999). As additional
docks and marinas are constructed along the coast, the potential for boating-related
impacts increases. Results from Connell and Murphey (2004) indicate that current dock
designs over SAV beds in North Carolina result in a reduction in SAV coverage and
density. Regulations by CRC state that activities which will directly impact SAV, such
as dredging or construction of docking facilities, should be avoided (15A NCAC 7H
.0208(a)(5). Dock criteria are currently being evaluated by CRC, with support from
DMF, to determine how existing dock siting requirements could be modified to reduce
impacts to SAV and other fish habitats.
Use of bottom disturbing gear can damage SAV beds, but MFC regulations
restrict gears that cause the m
ost damage over SAV habitat, including oyster dredges,
crab dredges, and hydraulic clam dredges. Bay scallop dredges, which are smaller and
have no teeth, cause less severe damage to SAV than oyster and crab dredges, and are
allowed over SAV habitat. Hand gear, such as bull rakes and large oyster tongs, can
uproot and damage SAV, but to much smaller areas than mechanical gears (Thayer et al.
1984). Current MFC rules prohibit use of rakes more than twelve inches wide or
weighing more than six pounds in SAV. Clam kicking can also severely impact SAV
habitat since substrate is displaced by propeller backwash (Guthrie and Lewis 1982;
Peterson and Howarth 1987). Because of the severe disturbance to the bottom, clam
kicking is restricted to sandy bottom, in waters more than 10 ft deep, in Core and Pamlico
sounds, and Newport, North, New, and White Oak rivers. The fishery is managed
intensively, with strong enforcement to prevent clam kicking in the restricted areas.
Shrimp and crab trawls can shear or cut the blades of SAV, or uproot plants
without m
ajor disruption of the sediment (ASMFC 2000). While shearing of grass blades
does not kill a seagrass plant, shoot density is reduced, decreasing productivity and
structural complexity. Where the trawl doors dig into the sediment, SAV plants can be
uprooted and killed. The impact of the doors depends on gear configuration, vessel speed
and other factors. High turbidity and sedimentation from use of bottom-disturbing
fishing gear can reduce water clarity, affecting SAV growth, productivity, and in some
cases, survival (ASMFC 2000). The boundaries of No Trawl Areas in Core Sound were
modified in the Peneaid Shrimp Fishery Management Plan (DMF 2006) to avoid
additional grass beds. Additional law enforcement may be needed to enforce buffers
around closed areas supporting SAV, such as No Trawl Areas and Mechanical Clam
Harvest Areas. If other areas are identified where bottom disturbing gears are impacting
SAV, boundary changes should be evaluated.
Shell bottom
The current distribution of shell bottom is much less than what historically
occurred (Newell 1988). Mechanical harvesting of oysters was the prim
ary and initial
cause of habitat loss (DMF 2001). Most shell bottom losses have been to subtidal beds in
Pamlico Sound, where DMF has also found declines in oyster recruitment. Although

56
mechanical harvesting of oysters has been greatly restricted, reefs have not recovered,
possibly due to stress f
rom water quality degradation and increased occurrence of disease
(Dermo, MSX) (DMF 2001). Oyster dredging removes oysters and reduces the vertical
profile of oyster rocks, increasing the susceptibility of remaining shell bottom at that
location to low dissolved oxygen (DO) and possible mortality (Lenihan and Peterson
1998). Other causes of shell bottom losses include dredging for navigation channels or
marinas. These activities can physically remove or damage existing shell bottom or
result in turbidity that clogs oyster gills or covers sediment completely. Hydrologic
modifications also impact oyster habitat by altering salinity regimes. While drainage for
agriculture has changed little in recent years, drainage for urban/suburban development is
increasing steadily.
In designated oyster management areas and other designated habitat areas,
trawling and m
echanical harvest of oysters is prohibited, including portions of Core and
Pamlico sounds. Through the DMF Oyster Fishery Management Plan (2001), oyster
dredging was restricted from additional shallow areas in western Pamlico Sound
tributaries. Hand harvest methods for oysters and clams can also be destructive, but on a
much smaller scale. Completion of mapping of North Carolina shellfish beds by DMF
would enhance the ability to enforce existing regulations and make it possible to quantify
changes to this habitat relative to changes in land use, water quality, and regulatory
measures. Restoration of subtidal oyster reefs in the lower Neuse River and other
western Pamlico Sound estuaries could enhance spawning conditions for red drum.
Soft bottom
Activities that lead to the deepening, loss, or chemical contamination of shallow
and intertidal habitat are the greatest threat to this habitat. D
redging associated with
construction of marina and dock facilities alters the shoreline configuration, circulation
patterns, and changes in bottom sediment characteristics (Wendt et al. 1990). Light
availability on the bottom of dredged marinas is lowered, reducing productivity from
benthic algae (Ianuzzi et al. 1996). Operation of a marina can also affect productivity of
the soft bottom community due to introduction of heavy metals, hydrocarbons, and
bacteria (Chmura and Ross 1978; Marcus and Stokes 1985; Voudrias and Smith 1986).
Heavy metals and hydrocarbons are toxic to many soft bottom dwelling invertebrates and
benthic feeding fish (Weis and Weis 1989). Additionally, DO may become depleted or
below biotic thresholds in dredged marina basins and channels. A North Carolina marina
study found significantly lower DO concentrations (less than 5.0 mg/l) inside some
marinas compared to outside marinas (DEHNR 1990). Estuarine shoreline stabilization
can also degrade soft bottom habitat utilized by red drum by reducing or eliminating the
intertidal zone, deepening shallow soft bottom habitat, or contaminating sediment from
leaching of toxic preservatives from wood structures (Weis et al. 1998).
The extent of sediment contamination in North Carolina coastal waters is not well
known. Sedim
ent sampling is not routinely conducted by the DWQ since there are no
sediment standards in the state. Studies examining sediment contamination at sites in
North Carolina soft bottom have found various levels of contamination (Riggs et al.
1989; 1991; Hackney et al. 1998). Highest contamination levels tended to occur in low
salinity areas with low flushing and high river discharge. In the Neuse River, surface
sediments were found to contain elevated levels of several heavy metals, including zinc,
copper, lead, and arsenic, primarily between New Bern and the mouth of the river. The
57
contaminated sites were primarily attributed to permitted municipal and industrial
treatm
ent plant discharges. Marinas were also found to contribute substantial amounts of
copper and variable amounts of zinc and lead. Nonpoint sources were more difficult to
evaluate. In the Pamlico River, heavy metal contamination was less severe, although
arsenic, cobalt, and titanium exceeded the levels found in the Neuse River. These studies
suggest that sediment contamination in some estuarine areas, especially those where both
organic rich mud and waste water discharges are present, may be significant and could
affect fish populations and the base of their food chain. To better determine if
contaminated sediment is a significant threat to coastal fish habitat, the distribution and
concentration of heavy metals and other toxic contaminants in freshwater and estuarine
sediments needs to be adequately assessed and areas of greatest concern need to be
identified.
Bottom disturbing gear can potentially impact soft bottom habitat, but because of
the lim
ited structure and dynamic nature of this habitat, has historically been considered
the most appropriate location for such gear. Of the bottom disturbing gears, trawling is
more commonly used than dredges on soft bottom habitat in both estuarine and coastal
ocean waters. Trawling can potentially impact soft bottom habitat by removing or
damaging epifauna, and burrow-forming infauna, reducing diversity and abundance of
benthic community, smoothing sediment features, and increasing exposure to predators
(Auster and Langton 1999; Collie et al. 1997). Sediment resuspension can increase
turbidity, reducing light dependent benthic productivity, which in turn affects the benthic
food web. While several studies have shown negative effects of trawling, other studies
have found no negative impacts (Van Dolah et al 1991; Currie and Parry 1996; Cahoon et
al. 2002). No studies have specifically looked at the effect of trawling on the bottom
habitat of Pamlico or other large sounds in North Carolina.
Use of trawl nets, long haul seines, swipe nets, dredges, and mechanical harvest
of shellfish is prohibited over productive shallow soft bottom
habitat designated as a
Primary and Secondary Nursery Area by the MFC (15A NCAC 3N .0104). There are
approximately 147,000 acres of designated Primary Nursery Areas (PNA) and Secondary
Nursery Areas (SNA) (15A NCAC 3N .0101 - .0105) in North Carolina (
Figure 13).
They are generally located in the upper portions of tidal creeks and rivers and usually
include wetlands, soft bottom
, and in some areas shell bottom. These nursery areas
include some but not all of red drum nursery areas. Dredging for navigational purposes is
also not allowed in PNAs by CRC regulations.

Figure 13. MFC designated fishery nursery areas.
Beach nourishment can threaten the quality of intertidal and shallow subtidal
ocean bottom
habitat, which is important nursery and foraging grounds for subadult and
adult red drum. When sand is put on the intertidal beach, the existing benthos is buried,
killing the prey available for red drum and other benthic feeding fish (Hackney et al.
1996). Because red drum are mobile, they can move to another area. However there may
be cumulative impacts if multiple beaches within a region are nourished at the same time.
The reported recovery time of the benthic community generally ranges from one month
to one year, although longer in some cases (Reilly and Bellis 1983; Rackocinski et al.
1993; Donoghue 1999; Jutte et al. 1999; Lindquist and Manning 2001). Factors that
affect the recovery time include compatibility of deposited material with native sand,
volume, depth, and length of filled area, time of year of project, frequency of
renourishment events, and specific site conditions. In addition to reduction in available
food, beach renourishment can affect red drum and other fish species by altering
preferred topographic features such as ebb tide deltas and nearshore muddy sloughs or
reducing visibility (Street et al. 2005).
Studies examining the effect of beach nourishment on fish abundance found that
large inter-annual fluctuations in surf zone fish populations m
ade detection of change
very difficult (COE 2001; COE 2003). More detailed studies are needed to assess the
effect of large-scale beach nourishment on red drum diet and behavior
. As of 2005, the
miles of beach authorized for storm damage reduction projects increased from 16 to 35
58
59
mi with an additional 104 mi at some stage of requesting authorization. As the number of
beach nourishm
ent projects increase, adequate monitoring of the effects of beach
nourishment on the soft bottom community and associated surf fish populations is
increasingly important and should be required for all large-scale or long-term
nourishment projects. The MFC adopted a beach nourishment policy in 2000 to guide
the permitting process to more fully consider fish habitat impacts. All beach nourishment
projects should adhere to the guidelines provided in that policy. The policy is a tool for
the MFC to use, should they decide to comment on a project. As part of CHPP
implementation, DCM has begun preparing a coastwide comprehensive beach
management plan to provide guidelines to minimize long-term impacts, benefiting red
drum and other surf zone species.
9.2 Water Quality
Good water quality is essential for maintaining the chemical properties of the
water column needed to support the various life stages of red drum, as well as sustain
other habitats which red drum utilize, such as SAV, shell bottom and soft bottom.
Although red drum have a wide tolerance range for environmental conditions, there are
optimal temperature, salinity, and pH thresholds which enhance survival and growth for
different life stages of the species. Optimum temperatures for spawning are between 22
and 30
o
C and at lunar spring tides (SAFMC, 1998). Eggs and larvae require salinity of
25 – 35 ppt for proper buoyancy while planktonic. Elevated pH levels and low water
temperatures can reduce survival of red drum larvae (Lyon and Fisher, 1998). Several
studies indicate that mortality during early post-settlement is substantial and that survival
through this stage is critical to recruitment success (Rooker et al., 1998; Baltz et al.,
1998). In mesocosm experiments, Rooker et al. (1998) found a 3–9% decrease in
mortality per millimeter increase in length of fish. Consequently, faster growth rates
associated with high water temperatures increase recruitment success. Because red drum
remain within one estuarine system for several years, they can be vulnerable to water
quality problems within a watershed.
Human activities that alter the preferred salinity or temperature conditions of the
species, elevate toxins, nutrients, or turbidity, or lower DO levels can degrade water
quality and im
pact growth and survival of red drum. These pollutants may be derived
from both point and nonpoint sources. Point sources include direct discharges of treated
domestic or industrial wastewater or untreated stormwater. Point source discharges are
regulated by DWQ and the US Environmental Protection Agency (EPA). In estuarine
waters, there are numerous wastewater discharges. EMC requires a NPDES permit for
point source discharges, which specifies limits of various pollutants in treated discharge
waters, based on the water quality classification of the receiving stream. Areas classified
as Nutrient Sensitive Waters have more stringent limits on nutrients. Leaks or ruptures
of sewage pipes and failing lift stations can also lead to untreated sewage entering into
coastal waters. In ocean waters, wastewater discharges are not permitted, because this
activity has been found to cause significant beach pollution in other states (Moore 1992).
Dumping of sewage sludge and industrial wastes has also caused adverse impacts to the
fishing industry (Cross et al. 1985). Ocean outfalls should continue to be prohibited in
North Carolina to minimize water quality degradation to the water column.
60
Nonpoint stormwater runoff can originate from numerous activities, including
urban developm
ent, roadways, marinas, concentrated animal operations, and land
disturbance from agriculture and forestry. Stormwater runoff can carry nutrients,
sediment, bacteria, and toxic chemicals into coastal waters. In some instances,
stormwater is directly discharged into ocean or estuarine waters. Beach communities
appear to be increasingly using “temporary” pumping of storm water to the beach as a
solution to stormwater runoff. The runoff during heavy rain events flood the streets, in
part due to improper siting of structures in flood zones, excessive impervious surface,
and lack of upland stormwater retention areas. Precautionary swimming advisories at
Hanby Beach, Carolina Beach, Emerald Isle, and Kill Devil Hills have been posted
because of potential contamination from stormwater discharge onto the beach or water
(JD Potts, DEH, pers. comm.). As coastal areas continue to develop and flooding
problems increase, managing stormwater should be a high priority for protecting habitat
and water quality. Because red drum are demersal bottom feeders and relatively long-
lived, they could be particularly susceptible to low DO and toxins that accumulate in
bottom sediment.
9.2.1 Water quality status
Red drum in North Carolina occur in several coastal river basins, including the
Tar-Pamlico, Neuse, Pasquotank, White Oak, Cape Fear and Lumber river basins (Figure
14). DWQ evaluates water quality in river basins on 5-year cycles, for six different Use
Support categories. Aquatic life and shellfish harvest are the m
ost ecologically pertinent
categories. The aquatic life use support category is an indicator of whether aquatic
invertebrates and fish can adequately live in the waters. Benthic invertebrate and fish
community data, ambient water quality, and NPDES data are considered in the
assessment. The shellfish harvest use support category is determined by elevated fecal
coliform bacteria levels and is a general indication that stormwater runoff is entering
surface waters.
Table 18 summarizes the most recent Aquatic Life and Shellfish Harvest Use
Support for the coastal river basins where red drum
occur. From the Use Support data,
the Pasquotank river basin, that includes the Albemarle region and northern Pamlico
Sound, has relatively low amounts of impaired fresh and estuarine waters and a low
amount of shellfish closures. In the Tar-Pamlico, which includes many of the estuarine
tributaries of western Pamlico Sound and the southern portion of Pamlico Sound from
Hatteras to Ocracoke inlets, aquatic life impairment of freshwater streams is relatively
high (7.9%). However in the lower portion of the river basin, impairment of aquatic life
use support in estuarine waters and impairment of shellfish harvest use support is low.
All of the impaired estuarine waters for the aquatic life use support category were located
in the lower Pamlico River and tributaries (subbasin 03-03-07, between Washington and
Roos Point). The Neuse river basin has the highest amount of impaired freshwater
streams. The Cape Fear, followed by the Neuse river basin, has the most impaired
estuarine waters for aquatic life use support. Estuarine waters are those that are most
likely used by juvenile red drum. In the Cape Fear river basin, impaired estuarine waters
for aquatic life were primarily located in subbasin 03-06-17 in the main stem of the river,
between Toomer’s Creek (north of Wilmington) and Snow’s Cut. In the Neuse river
basin, impaired estuarine waters for aquatic life were primarily located in subbasin 03-
04-10, between New Bern and Tonney Hill Point (mouth of Neuse River, northern
shore). Impaired waters for shellfish harvest is greatest in the southern river basins -

Lumber, Cape Fear, and White Oak. This coincides with population density,
development, and increased impervious surfaces. Water quality stressors attributed to
aquatic life use support impairment in fresh water streams and estuaries include habitat
degradation (reduced biodiversity due to sedimentation and channelization), low
dissolved oxygen, fecal coliform contamination, and elevated turbidity (DWQ 2005).
The specific source of the stressors is in most cases unknown.
Figure 14. Location of North Carolina river basins
(http://h2o.enr.state.nc.us/basinwide)
Table 18. Impaired water ratings for Aquatic Life and Shellfish Harvest Use Support
categories in six coastal river basins (DW
Q 2002a,b, 2003, 2004, 2005, 2007)
River Basin
(year
1
)
Impaired
stream
miles
% impaired
of monitored
streams
Total %
monitored
Impaired
estuarine acres
% impaired of
monitored
waters
Total %
monitored
Impaired
(acres)
%
impaired
Total %
monitored
Pasquotank
(2002)
0.0 0.0 29 0 0 69 5,033 1.3 100
Tar-Pamlico
(2004)
64.1 7.6 33 6,071 1 92 7,516 1.3 100
Neuse
(2002)
278.0 22.3 36 31,763 9.1 91 3,710 1.1 100
White Oak
(2007)
0.0 n/a n/a 7,942 n/a n/a 37,582 31.8 n/a
Cape Fear
(2005)
425.4 6.9 n/a 6,527.40 20.6 n/a 6,500.70 41.0 n/a
Lumber
(2003)
0.0 0.0 32 0 0 50 3,606.90 84.0 100
1
Year of most recent DWQ River Basin plan, from which data was derived
Shellfish harvestAquatic life - estuarineAquatic life - streams
There is sparse data available on nearshore ocean water quality trends since DWQ
does not m
onitor ambient water quality in nearshore ocean waters. The Shellfish
Sanitation Office, Division of Environmental Health, has been recording
Enterococcus
bacteria levels for safe swimming along ocean beaches and some estuarine areas since
1997. Since 2002, a public advisory or alert has been issued for the ocean for 288 days in
38 sampling areas (0 in 2002, 12 in 2003, 19 in 2004, 7 in 2005), with advisories most
61

62
frequently occurring in Dare and Carteret counties. Although these bacteria will not hurt
red drum
, it is an indicator that other pollutants associated with upland activity, such as
nutrients or toxins, are present.
An additonal source of water quality data in North Carolina is the National
Coastal Assessm
ent Program conducted by the EPA. Approximately 33 stations have
been sampled in the summer since 2002. Information is collected to determine sediment,
benthic, and habitat indices, as well as fish tissue condition, in areas where red drum
occur and where DWQ data is sparse (Pamlico, Core, and Bogue sounds). The
assessment rated the Carolinian province as being in fair to good condition.
9.2.2 Water quality stressors
Water quality stressors attributed to water quality impairment in coastal waters
are often associated with increased development. There has been a significant increase in
population over the past 20 years in coastal river basins. Increased population has been
directly correlated with increased impervious surfaces and hydrological alterations,
which in turn results in increased stormwater runoff (Mallin et al. 2000). Increased
population results in the need for additional septic tanks, increased wastewater treatment
capacity, road infrastructure, and marinas, which can increase pollutant loading into
coastal waters. Hydromodifications due to ditching and drainage of uplands and wetlands
accelerates the quantity and rate at which pollutants enter estuarine waters, decreases the
amount of filtering that occurs prior to pollutants entering the waters, and may alter the
salinity regime in the upper estuary (DWQ 2000b). Loading and movement of sediment,
nutrients, and toxins are often greater in channelized sections than natural streams, and
can negatively impact the fish community and benthic habitats (White 1996; EPA 2001).
Several studies have found that the size, number, and species diversity of fish in
channelized streams are reduced and the fisheries associated with them are less
productive than those associated with unchannelized reaches of streams (Tarplee et al.
1971; Hawkins 1980; Schoof 1980). Pate and Jones (1981) found that productivity of
several species of juvenile fish was significantly less in PNAs that received moderate to
high levels of drainage from ditched uplands. They attributed this to the unstable salinity
conditions that occurred in areas adjacent to channelized systems following moderate to
heavy rainfall (>1 inch/24 hr). Therefore, hydromodification of the system can be the
driver of other subsequent water quality stressors, such as hypoxia, eutrophication, and
toxic contamination.
Hypoxia and eutrophication
Adequate supply of DO is critical to survival of benthic invertebrates and fish.
Most dem
ersal fishes experience mortality in waters having 1-2 mg/l O
2
, impaired larval
growth where oxygen levels are < 4.7 mg/l, and altered metabolism where oxygen levels
are < 4 mg/l (Miller et al. 1995; Gray et al 2002). Some estuarine species are capable of
detecting and avoiding low oxygen waters and will generally move to shallower
oxygenated waters, but there are species-specific differences in tolerance thresholds
(Wannamaker and Rice 2000). There are no reported oxygen tolerances for red drum.
Low-oxygen conditions can occur naturally in a system from flushing of swamp
w
aters, which characteristically have low DO, or from stratification of the water column
due to wind, temperature, and salinity conditions. However, low-oxygen conditions can
also be fueled by increased stormwater runoff carrying nutrients and oxygen-consuming
63
wastes, which result in excessive oxygen demand in the water column or sediment. Algal
bloom
s deplete the water column of DO due to respiration and organic decomposition
(DWQ 2000b). Dissolved oxygen depletion in the water column occurs most often in
summer. Warm surface waters, calm winds, and reduced freshwater inflow reduce
mixing of water. The stratified bottom layer of water is prevented from receiving
oxygenated surface waters and rapidly becomes depleted of oxygen. Shallow water
estuaries with less frequent flushing often develop persistent stratification and bottom-
water hypoxia that can last for weeks to months (Tenore 1972). Several studies have
indicated that the frequency, duration, and spatial extent of low oxygen events have
increased over the years due to increasing eutrophication of coastal waters from human
and animal waste discharges, greater fertilizer use, loss of wetlands, and increased
atmospheric nitrogen deposition (Cooper and Brush 1991; Dyer and Orth 1994; Paerl et
al. 1995; Buzelli et al. 2002).
In the Neuse River, past estimates suggest that up to 30-50% of the estuary during
sum
mer is unsuitable bottom habitat due to hypoxia (Eby et al. 2000). Since relatively
deeper oxygenated waters of the Neuse River estuary are important spawning areas for
red drum (Barrios 2004), stratification and hypoxia in the Neuse River estuary could
reduce the suitable habitat available for spawning and lower survival rates of eggs and
larvae. Lower salinity, which may co-occur under summer stratification conditions,
decreases egg buoyancy, causing eggs to sink and be more susceptible to hypoxic
conditions, rather than being carried in surface waters to suitable nursery grounds
(Barrios 2004).
Fish kills are often attributed to low oxygen events. Over the past ten years in
coastal river basins supporting red drum
, the number of reported fish kills peaked in 2001
and has decreased and remained relatively low in the past three years (Table 19, Figure
15). Approximately 10 estuarine species were reported in fish kills over the years.
Atlantic m
enhaden, flounder, and spot were the most frequently reported estuarine
species. Only one red drum in 2001 and one red drum in 2004, have been reported in fish
kill events, indicating that red drum are not directly impacted by low DO and fish kills.
However fish kills are an indicator of poor water quality conditions that may affect red
drum indirectly. Overall, fish kills were most frequent in the Neuse river basin, followed
by the Cape Fear, and Tar-Pamlico (DWQ 2006). Kill activity in the Neuse and Tar-
Pamlico rivers was most frequent in the lower estuary, below New Bern and Washington,
respectively. In this mixing zone, low DO, high temperatures, and fluctuating salinity are
stressful to fish life. In 2006, low DO was cited as a factor in 30% of the fish kills,
followed by toxic spills and algal blooms. Both of the latter can also deplete oxygen
from the water column. Real-time monitoring sensors in the Neuse and Tar-Pamlico
rivers located close to fish kill events verified that fish kills occurred following
significant decreases in oxygen levels to hypoxic conditions (< 1.0 mg/l) the previous
evening or early morning for several hours. Overall, DO depletion, coupled with
unfavorable environmental conditions, is the most common cause of fish kills in estuarine
waters. It is unknown if the apparent decline in fish kills in the past few years was due to
favorable natural weather conditions or improved water quality conditions.

Table 19. Reported fish kills in coastal river basins supporting red drum, 1996-2006
(DWQ 2006).
64
5
0
2
0
2
0
River Basin 1996 1997 1998 1999 2000 2001 2002 2003 2004 2005 2006
Ca
pe Fear
211623141258312
Neuse
1412 8162337 921 8 91
Lumber
4350200211
Pasquotank
10282016202
Tar/Pamlico
3651114238621
White Oak
3313333001
Yearly total
55 42 50 46 54 69 34 34 12 16 19
0
10
20
30
40
50
60
70
80
1996 1997 1998 1999 2000 2001 2002 2003 2004 2005 2006
Year
No. reported fish kills
Figure 15. Reported annual fish kill events in coastal river basins supporting red
drum
, 1996-2006. Includes Pasquotank, Tar-Pamlico, Neuse, White Oak,
Cape Fear, and Lumber river basins.
Low oxygen events can also impact red drum by altering the benthic community
upon which it feeds (Luettich et al. 1999). Following a period of anoxia, initial food
available to red drum
could be greatly reduced. As the benthos recolonizes, small
organisms typical of early successional communities provide a source of food for small
juvenile benthic feeders, but larger organisms needed to support older red drum and other
benthic feeding adult fish are lacking or inadequate (Luettich et al. 1999). More
information is needed to understand the consequences on the estuarine food web and to
what extent anoxia is impacting the soft bottom community. Efforts are needed to reduce

65
anthropogenic nutrient loading, particularly in system
s that have a history of hypoxia and
anoxia.
Toxins
Toxins in sediments or the water column can inhibit or alter reproduction or
grow
th of aquatic organisms, or cause mortality in some situations (Weis and Weis
1989). Early life stages are most vulnerable to toxins (Funderburk et al. 1991). Toxicity
testing indicated that juvenile red drum were significantly more sensitive to
organophosphorus pesticides than mummichogs (Van Dolah et al., 1997). While the
survival of some aquatic organisms is affected by toxins, other organisms survive and
bioaccumulate the chemicals to toxic levels, passing them along in the food chain.
Multiple studies have shown clear connections between concentrations of toxins in
sediments and those in benthic feeding fish and invertebrates (Kirby et al. 2001;
Marburger et al. 2002).
Toxic chemicals tend to accumulate in fine-grained sediments to several orders of
greater m
agnitude than overlying waters, but can be resuspended in the water column by
storm events or human activities such as dredging and trawling. Sediment toxicity can
reduce the abundance of benthic prey available to red drum, reducing the quality of the
habitat. Because macroinvertebrate diversity declines with increasing sediment
contamination, food resources for benthic feeders, like red drum, may be limited in
highly contaminated areas (Weis et al. 1998; Brown et al. 2000; Dauer et al. 2000).
Toxic chemicals come from localized point sources as well as diffuse nonpoint
sources. Point sources include industrial and m
unicipal waste discharges. Nonpoint
sources of toxins include household and yard chemicals from urban runoff, petroleum
and other chemicals from roads, parking lots, marinas, docks, and boating activity, runoff
from agriculture and forestry, industrial emissions, and chemical spills (Wilbur and
Pentony 1999).
Because low concentrations of heavy metals in the water column can be easily
incorporated into fine-grained sedim
ent, chemicals can accumulate in the sediment to
toxic levels and be resuspended into the water column (Riggs et al. 1991). Studies have
shown that fine-grained sediments are the primary reservoir for heavy metals, particularly
organic rich muds (Riggs et al. 1991). Since organic rich muds occur extensively in
North Carolina’s estuaries and primary nursery areas, resuspension of contaminated
organic rich muds is of particular concern. Refer to the section on soft bottom condition
for more information on the known extent of sediment contamination in North Carolina.
Weather events
Hurricanes and other weather events can have a large influence on water quality
in Pam
lico Sound and other areas of North Carolina’s coast. Hurricanes are considered
an important natural perturbation that is necessary for the long-term maintenance of
estuarine systems (Meeder and Meeder, 1989). With increasing loss of wetlands and
hydrological modifications, however, the effect of flooding and storm damage is
intensified, and the resulting runoff is more severely contaminated. In 1996, Hurricanes
Bertha and Fran resulted in severe flooding of coastal waters, anoxia, and multiple fish
kills in both Neuse and Pamlico rivers and Pamlico Sound. Shortly after the passage of
Hurricane Floyd in September 1999, some anoxic conditions were documented in

66
Pamlico Sound (DWQ, DMF, unpub. data). However, subsequent storms and strong
winds prevented prolonged stratification of the water colum
n and increased oxygen
concentrations, minimizing fish kills in the sound. Large inputs of nutrients and toxic
chemicals were introduced into the system from flooded and failing hog lagoons and
wastewater treatment plants, and from organic matter displaced from swamps and upland
sources. The high number of fish kills in the Neuse and Tar-Pamlico river basins in 2001
may be a delayed ecological response to these nutrient inputs. In 2003, Hurricane Isabel
breached a new inlet through Hatteras Island, which could have enhanced flushing in
Pamlico Sound. However, DOT refilled the inlet to restore traditional transportation.
Prevention of natural barrier island processes will have a long-term effect on water
quality in adjacent estuarine waters.
Global warming and sea level rise could have a significant impact on future
estuarine conditions and consequently red drum
. As sea level continues rising, portions
of barrier islands are expected to be inundated, increasing ocean influence and salinity in
Pamlico Sound and tributaries (Pearsall and Poulter, in press). On a global scale, 30% of
global wetlands are expected to be lost due to the combination of sea level rise and
development along the shoreline, which deters landward migration of wetlands (IPPC
2002). In the Albemarle-Pamlico system, where elevations are low and landscape slope
is minimal, there is concern that the rate of vertical accretion of marsh peat (currently
estimated at 2.4-3.6 mm/yr - Craft et al. 1993) will not be able to keep up with sea level
rise and prevent submergence of wetlands (Moore et al. 2006; Pearsall and Poulter, in
press). While the current rate of sea level rise in the Albemarle region is 4.3 mm/yr
(Pearsall and Poulter, in press), the rate of sea level rise is expected to double or triple
over the next 50-100 years (IPCC 2002). The effect of these changes to red drum is
unknown, but will most likely influence spawning aggregation patterns, and suitability of
nursery habitats. Wetland loss will result in less filtering of stormwater runoff and less
available nursery areas. Efforts are needed to plan for and attempt to offset the impacts
of sea level rise on North Carolina’s estuarine system. Restoration strategies include
selectively plugging some ditches and installing tide gates on others to reduce impacts of
salt intrusion and peat soil erosion, and planting flood and brackish tolerant plants on
cleared lands.
9.3 Habitat and Water Quality Protection
MFC Authority
Presently, the MFC has authority for managing, restoring, developing, cultivating,
conserving, protecting, and regulating m
arine and estuarine resources. Marine and
estuarine resources are defined as “All fish [including marine mammals, shellfish, and
crustaceans], except inland game fish, found in the Atlantic Ocean and in coastal fishing
waters; all fisheries based upon such fish; all uncultivated or undomesticated plant and
animal life, other than wildlife resources, inhabiting or dependent upon coastal fishing
waters; and the entire ecology supporting such fish, fisheries, and plant and animal life.”
(G.S. 113-129)
Although the MFC’s primary responsibilities are management of fisheries
(season, size and bag lim
its, licensing, etc.), the MFC has the authority to comment on

67
State permit applications that may have an effect on marine and estuarine resources or
water quality, regulate the placem
ent of fishing gear, develop and improve mariculture,
and regulate location and utilization of artificial reefs. Authority for the MFC is found at
G.S. 143B-289.51 and 52.
Authority of Other Agencies
The North Carolina Department of Environment and Natural Resources have
several divisions responsible for providing technical and financial assistance, planning,
perm
itting, certification, monitoring, and regulatory activities, which impact the coastal
water quality or habitat. The DCM is responsible for development permits along the
estuarine shoreline in 20 coastal counties. Wetland development activity throughout
North Carolina is permitted through the United States Army Corps of Engineers (COE)
and DWQ (DWQ; 401-certification program). The DWQ has established a water quality
classification and standards program for “best usage” to promote protection of unique
and special pristine waters with outstanding resource values. The High Quality Waters
(HQW), Outstanding Resource Waters (ORW), Nutrient Sensitive Waters (NSW), and
Water Supply (WS) classifications have outlined management strategies to control point
and nonpoint source pollution. The Neuse River Basin and Tar-Pamlico River Basin
were designated as Nutrient Sensitive Waters by EMC in 1988 and 1989, respectively,
due to increases in algal blooms and fish kills in the upper estuary. The blooms were
linked to excessive nutrient levels. Regulations and water quality standards were
developed to reduce loading of non-point sources of nutrient runoff. These changes in
effluent and development standards are intended to reduce eutrophication of waters.
Phase II stormwater regulations will be effective beginning July 2007 in designated
areas. In coastal waters, this includes Brunswick, New Hanover, and Onslow counties, as
well as the municipalities of Wilmington, Jacksonville, and Greenville. These new
regulations will require more stringent control of stormwater runoff, identification and
correction of point source discharges of stormwater, and lower amounts of maximum
built upon area, when using the low-density development option.
Various federal and state environmental and resource agencies, including
DMF, evaluate projects proposed for perm
itting and provide comments and
recommendations to the DCM, DWQ, and COE on potential habitat and resource
impacts. Waters that have been designated as PNAs by MFC or have a special EMC
water quality classification, such as HWQ and ORW, are given additional consideration
of impacts by DCM and DWQ prior to issuing a permit. Habitat protection relies on
enforcement, the efforts of commenting agencies to evaluate impacts, and the
incorporation of recommendations into permitting decisions. Habitats are also protected
through the acquisition and management of natural areas as parks, refuges, reserves, or
protected lands by public agencies and/or private groups.
Coastal Habitat Protection Plan (CHPP)
The Fisheries Reform Act (FRA) of 1997 mandated the DENR to prepare Coastal
Habitat Protection Plan (CHPP -- G. S. 143B-279.8). The legislative goal for the CHPP is
long-term
enhancement of the coastal fisheries associated with coastal habitats. The
CHPP provides a framework for management actions to protect and restore habitats
68
critical to North Carolina’s coastal fishery resources and involves mandatory
participation by the three com
missions that have regulatory jurisdiction over the coastal
resources (Coastal Resource Commission), water (Environmental Management
Commission), and marine fishery resources (Marine Fisheries Commission), as well as
the Department. The CHPP was completed in December 2004 and implementation plans
for each Division and the Department were approved in July 2005. The plan is to be
reviewed every five years. Actions taken by all three commissions pertaining to the
coastal area, including rule making, are to comply, “to the maximum extent practicable”
with the plans. The CHPP helps to ensure consistent actions among these three
commissions as well as their supporting DENR agencies.
The CHPP describes and documents the use of habitats by species supporting
coastal f
isheries, status of these habitats, and the impacts of human activities and natural
events on those habitats. Fish habitat is defined as freshwater, estuarine, and marine
areas that support juvenile and adult populations of economically important fish,
shellfish, and crustacean species (commercial and recreational), as well as forage species
important in the food chain (Street et al. 2005). Habitats are categorized as wetlands,
submerged aquatic vegetation (SAV), soft bottom, shell bottom, ocean hard bottom, and
water column. The plan explains the environmental requirements, ecological value,
status, and threats of the six fish habitats and includes management recommendations to
protect and enhance the entire coastal ecosystem.
The CHPP recommends that some areas of fish habitat be designated as “Strategic
Habitat Areas” (SHAs). SHAs are defined as specif
ic locations of individual fish habitat
or systems of habitat that have been identified to provide critical habitat functions or that
are particularly at risk due to imminent threats, vulnerability, or rarity. While all fish
habitats are necessary for sustaining viable fish populations, some areas may be
especially important to fish viability and productivity. Protection of these areas would
therefore be a high priority (Street et al. 2005). The process of identifying and
designating SHAs began in 2005.
This fishery management plan describes habitat conditions or needs for the
various life stages of the red drum
. The FRA gives precedent to the CHPP and stipulates
that habitat and water quality considerations in the fishery management plan be
consistent with CHPP. Management actions recommended in this plan that are under
MFC authority will be acted upon directly, while those management actions under other
DENR authorities will be considered and acted upon through the CHPP implementation
process and the appropriate agencies.
Since the original red drum fishery management plan was completed in 2001,
habitat and water quality conditions appear to be the sam
e or in some cases, somewhat
better. SAV appears to be increasing in estuaries south of New River and in the lower
salinity estuaries of the Neuse and Tar-Pamlico. The latter increase could be related to
nutrient reduction efforts in those river basins. However, additional loading from
increasing urbanization of the watersheds, as well as airborne deposition may offset net
reductions in nutrient loading from the Tar-Pam and Neuse Nutrient Sensitive Waters
Management Program. Wetland acreage continues to decline from permitted losses,
although mitigation efforts by EEP may be preventing a net loss. Efforts have increased
to restore more shell bottom habitat through additional funding and positions to the
oyster restoration and recycling programs, and partnerships with other non-profit

69
organizations. Water quality, in terms of aquatic life use support impairment, is greatest
in stream
s in the Neuse river basin and estuaries in the Cape Fear river basin. Fish kill
events have declined but can be locally problematic.
Status of 2001 red drum habitat recommendations
In reviewing the past habitat and water quality management recommendations,
m
any have been implemented or are underway. The following management actions are
underway or completed. Many of these are components of the CHPP implementation
plan.
• Coastwide mapping of SAV habitat has been funded and is underway, through an
APNEP interagency cooperative mapping project.
• Critical SAV areas will be designated for additional protection through the SHA
process, which is underway.
• Dredging of SAV habitat is avoided through DMF’s permit review process.
• CRC is in the process of revising dock siting rules, which will consider minimum
water depths, to avoid boating related impacts to SAV.
• Additional bottom disturbing gear restrictions have been implemented through the
bay scallop, shrimp, and oyster fishery management plans to avoid damage to SAV
and oysters.
• Research has been conducted examining red drum spawning activity in the Neuse
River estuary.
• DMF continues to comment on beach nourishment projects to minimize impacts to
spawning activities and larval transport.
• Additional funding of positions and equipment has been obtained to accelerate
completion of shell bottom mapping and restoration of this habitat.
• DMF staff continues to comment on projects to prevent dredging through oyster reefs
and prevent habitat degradation.
• The CRC is in the process of revising shoreline stabilization rules to discourage and
reduce the use of bulkheads. However, there have been no efforts to require removal
of bulkheads, as was recommended in the 2001 fishery management plan.
• EEP is in the process of evaluating mitigation requirements for wetland, oyster, and
SAV impacts, and improving the mitigation process.
• Neuse and Tar-Pamlico NSW nutrient reduction measures have successfully reduced
nutrient loading by more than their 30% reduction goals.
• Phase II regulations will also help reduce nutrient, sediment, and toxin inputs from
stormwater runoff. EMC is currently developing coastal stormwater rules to provide
stormwater protection to all coastal counties. However, additional efforts will
continue to be needed as population increases.
Several of the approved CHPP recommendations will benefit habitat utilized by
red drum
. Implementation plans have been developed by the responsible agencies to
address the recommendations. CHPP recommendations or actions that will benefit red
drum and should continue to be implemented include:

70
• Identify and designate Strategic Habitat Areas (SHAs) using ecologically based
criteria, analyze existing rules and enact measures needed to protect SHAs, and
improve programs for conservation and acquisition of areas supporting SHAs.
• Complete and continue mapping of SAV to assess distribution and change over
time.
• Conduct cooperative DMF/NOAA research to assess environmental conditions
needed to support SAV, and model potential SAV habitat.
• Work with CRC and EMC to enhance enforcement and compliance with CRC,
EMC, and MFC rules and permit conditions, particularly regarding dredging,
dock construction, and wetland filling).
• Work with CRC to develop and implement a comprehensive coastal marina and
dock management plan and adequate dock siting criteria for the protection of
SAV, shell bottom, and shellfish harvesting.
• Work with CRC and EMC to implement measures to adequately reduce nutrient
and sediment loading by:
- Reducing point source pollution from wastewater by increasing inspections
of
facilities and infrastructure and providing incentives for upgrading all types
of wastewater treatment systems.
-Improving land-based strategies throughout riverbasins to reduce non-point
pollution and m
inimize cumulative losses to wetlands and streams through
voluntary actions and rule making.
• Complete shell bottom mapping throughout the coast.
• Continue to restore oyster reef no-take sanctuaries.
• Work with CRC to revise shoreline stabilization rules to adequately protect
riparian wetlands and shallow water habitat and significantly reduce the rate of
shoreline hardening.
• Initiate DO and other continuous water quality monitoring in the Pamlico Sound
system to track water quality changes over time and effect on fishery species.
• Work with EMC to develop and implement a mandatory coastal stormwater
management program that is equally or more protective than the Phase II
stormwater program.
• Assess the distribution and concentration of heavy metals and other toxins in
estuarine waters and sediments, assess benthic condition, and identify the areas of
greatest concern.
Red drum habitat research needs
• Determine juvenile habitat preference and examine if recruitment is habitat
limited.
• Examine ecological use and importance of shell bottom to red drum.
71
• Identify coastal wetlands and other habitats utilized by juvenile red drum and
assess relationship between changes in recruitment success and changes in habitat
conditions.
• Assess cumulative impact of large-scale beach nourishment and inlet dredging on
red drum and other demersal fish that use the surf zone.
• Determine location and significance of spawning aggregation sites throughout the
coast.
• Determine if navigational dredging between August and October significantly
impacts spawning activity.
• Determine if designation of spawning areas by MFC is needed, and if specific
protective measures should be developed.
9.4 Recommended Management Actions
Suitable and adequate habitat is a critical element in the ecology and productivity
of estuarine system
s. Degradation or improvement in one aspect of habitat may have a
corresponding impact on water quality. Maintenance and improvement of suitable
estuarine habitat and water quality is critical to successfully managing red drum stocks.
9.4.1 Environmental Factors
Habitat and water quality protection, conservation, and restoration are essential to
accom
plish the goal and objectives of this plan. The MFC, CRC, and EMC should adopt
rules to protect critical habitats for red drum as outlined in the Coastal Habitat Protection
Plans (CHPP), The N.C. General Assembly and/or divisions of the DENR should develop
a strategy to fully support CHPP implementation with additional staff and funding. The
involvement of federal agencies and increased funding (state and federal) may be
necessary to accomplish these actions. The MFC and DMF should continue to comment
on activities that may impact aquatic habitats and work with permitting agencies to
minimize impacts and promote restoration and research.
Research is needed before any new management actions can be taken. The
recom
mended research items in this FMP should be conducted and the results used to
better manage red drum. To accomplish the research needs listed in the Environmental
Factors section, CRFL funds or other funding sources should be sought. If possibly,
additional sampling by the Division throughout the coast should be conducted, targeting
summer spawning estuarine juvenile fish at the appropriate time of year and in
appropriate locations. This information would aid in determining habitat preferences, and
the relationship between red drum, coastal fish habitats, and activities that alter those
habitats.
72
10. PRINCIPAL ISSUES AND MANAGEMENT OPTIONS
10.1 Identification of Issues
Major issues and management options developed during the FMP process are
summarized in this section. Management issues in the North Carolina red drum fishery
have been solicited from the public, Red Drum Advisory Committee, Marine Fisheries
Commission, Finfish and Regional Advisory committees, DMF, DENR, and the scientific
community.
10.1.1 Issues Addressed in this Plan
1. Adult Harvest Limits
2. Recreational Targeting of Adult Red Drum
3. Recreational Bag and Size Limits
4. Commercial Harvest Limits
5. Bycatch in the Estuarine Gill Net Fishery
10.2 Issues and Management Strategies
10.2.1 Adult Harvest Limits
Issue
The potential modification of the rule prohibiting the harvest and possession of
red drum greater than 27 in total length.
Background
Regulations on the harvest of juvenile and adult red drum have changed
significantly over the past 31 years. Restrictions on the harvest of adult red drum were
first put into place in 1976 with the allowance of two fish greater than 32 in total length
(TL). In 1990, a five fish bag limit was put into place on juvenile red drum with an
allowance of one adult fish 32 in TL or greater. In 1992 the maximum size limit was
reduced to 27 in TL with no sale of fish greater than 27 in TL. The harvest of one large,
adult red drum was allowed until October 1998. As an interim measure to the North
Carolina Red Drum FMP, required in the guidelines for FMP development, the MFC
prohibited the harvest and possession of red drum greater than 27 in TL in October 1998
(NCAC 15A 3M .0501 (c)). Amendment 2 to the ASMFC Red Drum FMP requires states
from New Jersey to Florida to achieve and maintain the necessary size and creel limit
combinations to attain a spawning potential ratio (SPR) of 40% and it required all states
to maintain or implement more restrictive commercial fishery regulations (ASMFC
2002).
73
Discussion
The rule prohibiting the possession and harvest of red drum greater than 27 in TL
was implemented to reduce mortality on the spawning stock because overfishing was
occurring (NCDMF 2001). The average SPR from 1986 to 1991 was estimated at only
1.3% (Vaughan and Carmichael 2000). The estimated SPR of the North Carolina red
drum stock increased to 18% from 1992 to 1997 but was still below the overfishing
threshold of 30% (Vaughan and Carmichael 2000). Results from the latest stock
assessment indicate that the average SPR for the northern stock of red drum (North
Carolina and Virginia) is above the 30% threshold but below the 40% target from 1999 to
2005 (Takade and Paramore 2007). The SPR estimates from the latest stock assessment
correspond with increased escapement rates into the adult population during this time.
An indication of increased escapement into the adult population is evident from
length frequency data from
the NCDMF Red Drum Volunteer Tagging Program. The
percentage of red drum tagged by volunteer tagger Norman Miller between 28 and 36 in
TL (young adult red drum) was examined over three time periods (1984-92, 1992-99,
2000-06) from Ocracoke Inlet to see how the proportion of this size class has changed
over time (Figure 16). The time periods were lagged one year because fish within the
slot lim
it on the last year of the management period would be the first cohort to recruit to
the adult tagging program in the new management period, but they would have been
subject to fishing mortality at ages 1 and 2 in the old management period. Norman tagged
virtually every adult red drum he and his customers caught, which minimized bias and
provided the most comprehensive length frequency data for the time series. The
proportion of red drum in the 28-36 in TL size class increased from 17.8% to 18.1% in
the early and middle periods, respectively, to 34.4% in the late period. A further
indication of increased escapement into the adult population can be found in the
commercial estuarine gill net length frequency data (Figure 17). The length frequency
distributions were exam
ined over three time periods (1986-91, 1992-98, 1999-04), which
covered different size and trip limit regulations (see Section 6, Status of the Commercial
Fisheries). The length frequency distribution during the early period was mostly
comprised of fish in the lower end of the slot limit (14 in TL, 1986-1990, 18 in TL 1991),
with very few fish in the upper end of the slot limit. The middle period had more fish in
the upper end of the slot limit, but the modal size (19 in TL) was at the lower end of the
slot limit. The length frequency was distributed throughout the slot limit in the late
period with the modal size (22-24 in TL) in the middle of the slot limit. The increased
escapement into the adult population and size limit regulations have resulted in red drum
throughout the slot limit available to the commercial and recreational fisheries and an
increase in the size class comprising young adult fish.

0
20
40
60
80
100
CumulativePercent
Frequency
28 30 32 34 36 38 40 42 44 46 48 50 52 54
Size Class (TL, in)
EARLY
MID
LATE
Figure 16. Cumulative percent frequency at size for adult red drum tagged in
Ocracoke Inlet from the NCDMF Red Drum Volunteer Tagging
Program during the early (1986-1991), mid (1992-1997) and late
(1999-2005) management periods.
8
10
12
14
16
18
20
22
24
26
28
30
32
34
36
38
40
0%
5%
10%
15%
20%
25%
Percent Frequency
Size Class (TL, in)
1986-91
1992-98
1999-04
Figure 17. Length frequency distributions of red drum from the commercial estuarine
gill net fishery during the early (1986-91), middle (1992-98) and late (1999-
04) management periods.
The prohibition on harvesting red drum greater than 27 in TL prevents anglers
from
applying for a potential International Game Fish Association (IGFA) all tackle
74

75
world record. Allowing a trophy fishery where an angler can keep one red drum over 55
in TL during the year if the angler obtains a
“trophy tag” is a possible solution. The State
of Florida has a tarpon tag for anglers who possess or harvest a tarpon
(http://www.myfwc.com
). A trophy tag would be available to all anglers who purchase a
coastal recreational fishing license (CRFL) at no additional cost. The NCDMF is unable
to charge a fee for a trophy tag or permit. The number of adult red drum harvested in a
year could be limited by restricting each license holder to one trophy tag per year.
Length frequency data from the NCDMF Volunteer Tagging Program indicate that not
many adult red drum caught by anglers exceed 55 in TL, so the number of adult red drum
harvested under this management option would likely be low (Figure 18). The trophy tag
would give the NCDMF inform
ation on the number of adult fish harvested but would
provide very limited biological data on the adult population. If red drum over 55 in TL
was only comprised of old adults and senescence commonly occurred in older red drum,
then the impact on the spawning stock could be minimal. An age, growth and maturity
study by Ross and Stevens (1992) only found two fish (ages 49 and 51) that were
senescent but also sampled an age 51 fish that recently spawned. Age and growth data
for adult red drum show that red drum 55 in TL and greater were age 40 and older
(Figure 19). However, the sample size was very low (n=2), which precludes making any
conclusions about the age structure of red drum
55 in TL and greater. Although the
average age generally increases with the length of the fish, the range of ages for any
given adult size class is very large, making length a poor indicator of age. Further
complicating a trophy tag system is Amendment 2 to the ASMFC Red Drum FMP, which
requires states from New Jersey to Florida to achieve and maintain the necessary size and
creel limit combinations to attain an SPR of 40% and it required all states to maintain or
implement more restrictive commercial fishery regulations (ASMFC 2002). These states
currently prohibit the harvest and possession of adult red drum (ASMFC 2006).
Therefore, any state that allows the adult harvest of red drum would be found out of
compliance with the ASMFC FMP.
A similar option is to make special permits available to anglers who wish to
harvest adult red drum
greater than 27 in TL. Like the trophy tag option, these permits
would be available to all anglers at no cost. This would likely result in more adult red
drum harvested per year than the trophy tag management option because of the broader
size range of adult fish that could be harvested. The entire age range of adult red drum
could be harvested, which would increase the impact on the spawning stock. More age
and growth data could be collected by the NCDMF under this management option, but a
very large number of adult red drum would be needed on an annual basis for an age and
growth study of the adult population because the maximum age of red drum is greater
than age 60 and because of the overlapping sizes at age. The number of adults that must
be harvested in order to get reliable age and growth information for the entire adult
population is contrary to the current management strategies for red drum and could
compromise the sustainability of the spawning stock. And this option would also be out
of compliance with Amendment 2 to the ASMFC Red Drum FMP.

0
10
20
30
40
50
60
70
80
90
100
32
3
4
36
3
8
40
42
44
46
48
50
5
2
54
5
6
58
Size Class (TL, in)
Cumlative Percent Frequency
Figure 18. Length frequency distribution of adult red drum from the NCDMF Volunteer
Tagging Program, 1984-2006.
0
10
20
30
40
50
60
70
37 38 39 40 41 42 43 44 45 46 47 48 49 50 51 52 55 56
Size Class (TL, in)
Age
Average Age Minimum Age Maximium Age
Figure 19. Average, minimum and maximum ages for adult red drum per one inch size
class, 37-56 in TL.
76
77
Another option would be to allow the harvest of adult red drum while
m
aintaining the SPR above the 30% threshold. This would provide some benefits to the
commercial and recreational fisheries in the form of some adult red drum could be
harvested and the angling all tackle world record could be broken. There is also the
potential for the NCDMF to collect age and growth data on the adult fish. Unlike the
trophy tag and special permit options, the number of adult red drum harvested per year
would be difficult to obtain, and the NCDMF would not have a reliable way to monitor
the number of adult red drum harvested. And this option would also be out of
compliance with Amendment 2 to the ASMFC Red Drum FMP.
Waiting until the SPR target of 40% is reached before allowing the harvest of
adult red drum
would be more risk averse and could avoid compliance issues with the
ASMFC FMP. The next coastwide stock assessment for red drum is scheduled for 2009,
so no new SPR information will likely be available before then. It is also uncertain
whether the next amendment to the ASMFC FMP will allow the harvest of adult red
drum if the SPR target is reached. Vaughan and Carmichael (2000) indicated that it
would likely take 15-20 years for the spawning stock of red drum to rebuild based on the
age at maturity and longevity of the species. North Carolina would be found out of
compliance if adult harvest is allowed and the next amendment to the ASMFC Red Drum
FMP does not allow adult harvest.
The Red Drum Plan Development Team (PDT) discussed the issue of the
“tradeoff” between the harvest of adult red drum
and the subsequent reduction in juvenile
red drum harvest in order to avoid overfishing. The creel and size limit analysis used to
calculate the required harvest reductions in 1998 were examined to determine if it is
possible to calculate a tradeoff between juvenile and adult fish. This is an appropriate
method to use for calculating harvest reductions but does not work well for calculating
harvest increases because the length frequency of the released fish is unknown. Using
the length frequency distribution when adult harvest was permitted (1992-98) is
problematic because the length frequency distribution has significantly changed since
then. And any reduction in juvenile harvest to offset adult harvest would result in
increased release and discard mortality of juvenile red drum.
The lack of data for the adult population continues to prevent assessing the red
drum
spawning stock. Management measures that allow the harvest of adult red drum
could provide NCDMF with data on this portion of the population, but the data would
likely be inadequate to assess the adult population. This summer the NCDMF will begin
a fisheries independent longline study in Pamlico Sound and near shore ocean waters to
develop an abundance index for adult red drum. The study will sample adult red drum to
develop information on catch per unit effort (CPUE) and length frequencies, to collect
migratory and stock identification information on adult red drum, and to evaluate the age
composition and reproductive status of red drum less than 90 cm TL (35.4 in TL).
Available age and growth data indicates that red drum less than 90 cm TL are primarily
ages 10 and less. Examination of this portion of the population can provide an indication
of whether adequate escapement is occurring in the sample area. This study will provide
North Carolina with the resources necessary to develop a fishery independent index of
abundance for adult red drum occurring in state waters that will be used in future stock
assessment work.

78
Current Authority
North Carolina Fisheries Rules for Coastal Waters (15A NCAC)
03M.0501 Red Drum (Director’s proclamation authority for red drum)
Management Options/Impacts
(+ potential positive impact of action)
(- potential negative impact of action)
1) Status quo (prohibit all possession and sale of red drum >27 in TL)
+ Protects adult spawning stock
+ Increase likelihood of good year classes (recruitment)
+ Increase stock diversity
+ Increase likelihood of reaching management targets
+ No changes for juvenile harvest regulations required
- Continued potential economic impact on recreational and commercial
fisheries
- Impact on historical use as food fish
- Limits availability of data for assessment of stock diversity
2) Trophy fishery (1 fish 55 in TL or greater) through the use of a trophy tag
+ Controlled harvest of adults with mandatory reporting
+ Potential positive impact on recreational fishery
+ Allows retention of potential state or world record red drum
+ Collect harvest data on recreational fishery
+ Provide some use as food
+ Relatively small number of adult red drum likely harvested
- Selectively harvest larger, more productive fish
- Added cost to purchase a trophy tag
- Increased administrative burden on the NCDMF
- Provide limited biological data to NCDMF
- Limits protection of adult stock
- Delays stock recovery
- Reduction in juvenile harvest to offset adult harvest
- Increased enforcement required
- Out of compliance with ASMFC Red Drum FMP
3) Special Permit to retain 1 fish > 27 in TL
+ Controlled harvest of adults with mandatory reporting
+ Potential positive impact on recreational fishery
+ Collect harvest data on recreational fishery
+ Provide some use as food fish
- Limits protection of adult stock
79
- Increased administrative burden on the NCDMF
- Provide limited biological data to NCDMF
- Delays stock recovery
- Reduction in juvenile harvest to offset adult harvest
- Increased enforcement required
- Out of compliance with ASMFC Red Drum FMP
4) Harvest of adults (>27 in TL) while maintaining a 30% SPR threshold
+ Adult harvest at threshold levels
+ Potential positive impact on recreational and commercial fisheries
+ Increases likelihood of a sustained fishery
+ Potential for some use as food fish
+ No permit required, no administrative burden on the NCDMF
- Provide limited harvest and biological data to NCDMF
- Limits protection of adult stock
- Delays stock recovery
- Allows harvest of adults before SPR target is met
- Reduction in juvenile harvest to offset adult harvest
- Out of compliance with ASMFC Red Drum FMP
5) No harvest of adults (>27 in TL) while maintaining a 40% SPR target
+ Adult harvest at target levels
+ Potential positive impact on recreational and commercial fisheries
+ Increases likelihood of a sustained fishery
+ Potential for some use as food fish
+ No permit required, no administrative burden on the NCDMF
- Provide limited harvest and biological data to NCDMF
- Limits protection of adult stock
- Requires reduction in mortality on juvenile fish to increase escapement/SPR
rates
- Reduction in juvenile harvest to offset adult harvest
- Out of compliance with ASMFC Red Drum FMP unless FMP is amended to
allow
adult harvest
80
Management Recommendations
DMF and RDAC - Status quo (no harvest over 27 inches TL)
MFC Selected Management Option
Endorses DMF and RDAC
Research Recommendations
• Design an appropriate state fishery-independent survey of adult red drum to be
implemented (NCDMF Red Drum Longline study, begun summer 2007).
• Improved catch and effort data for the adult red drum fishery, particularly the fishery
that occurs at night.
• Improved length frequency data for adult red drum in the commercial and
recreational fisheries.
• Continue tagging efforts of adult red drum through the NCDMF Volunteer Tagging
Program.
• Age, growth and maturity data for the adult red drum.
10.2.2 Recreational Targeting of Adult Red Drum
Issue
The directed recreational catch and release fishery for adult red drum and the
concerns and potential risks of this fishery.
Background
Recreational fishing for adult red drum continues to grow in popularity despite
the prohibition of possessing or harvesting red drum greater than 27 inches total length
(TL) (NCAC 15A 3M .0501 (c)). Catch and effort data for the adult red drum fishery are
lacking, but the number of release citations awarded for red drum 40 inches TL and
greater has greatly increased since the late 1990s. However, it is difficult to ascertain
how much of this trend is due to increases in availability of large fish, increases in fishing
effort or to increased popularity of the citation program.
Most of the adult red drum caught by anglers in North Carolina occurs from the
spring through the fall (Burdick et al. 2007). The m
ost common angling practice is to use
cut bait fished on the bottom, and fishing takes place during the day and at night.
Anglers generally catch adult red drum in the surf and inlets of the Outer Banks in the
spring and fall and in the western Pamlico Sound estuary in the summer (Ross et al.
1995, Beckwith and Rand 2004a, Beckwith and Rand 2004b). Red drum spawn in the
late summer and fall around the inlets and western Pamlico Sound (Ross et al. 1995,
81
Luczkovich et al. 1999, Barrios Beckwith et al. 2006). Anglers often catch red drum in
spawning condition in the western Pam
lico Sound estuary (Beckwith and Rand 2004a).
A number of guide services participate in this fishery and there are tournaments targeting
adult red drum. In addition, a number of guides and anglers participate in a volunteer
tagging program of adult red drum for the NCDMF.
There have been concerns raised regarding the targeting of adult red drum by
recreational anglers. Som
e members of the public believe that adult red drum should not
be targeted because of the prohibition on possessing or harvesting adult red drum. The
harvest of adult red drum is prohibited because the juveniles are harvested and the
spawning stock is the component of the population that requires the most protection in
order to achieve and maintain sustainable harvest. The improper handling of the fish
before they are released and the deep hooking of adult red drum can lead to release
mortality. The results from the latest stock assessment indicate the spawning potential
ratio (SPR) is above the threshold of 30% and near the target of 40% (Takade and
Paramore 2007). Under the current management strategy, SPR must be maintained at a
minimum of 40% to meet the target of both the state and ASMFC red drum FMP’s.
The 2001 North Carolina Red Drum FMP addressed the issue of recreational gear
restrictions—specifically, the use of circle hooks and the attendance of fishing rods while
fishing for red drum
to reduce the chance of deep hooking (NCDMF 2001). The
management action for this issue was to develop educational information on conservative
angling practices for red drum. This paper will revisit the issue based on research
conducted since the 2001 FMP.
Discussion
Researchers have conducted studies to estimate the release mortality of adult red
drum
, the factors leading to mortality and the differences in deep hooking events between
circle hooks and J-style hooks (Aguilar 2003, Beckwith and Rand 2004a, Beckwith and
Rand 2004b). Studies by Aguilar (2003) and Beckwith and Rand (2004a) had overall
mortality rates ranging from 3.8% to 6.7% for adult red drum that were held for up to
three days after being caught using either circle hooks or J-style hooks. All mortalities
showed evidence of internal bleeding from being deep hooked (Aguilar 2003, Beckwith
and Rand 2004a). Beckwith and Rand (2004b) found that circle hooks had a much lower
incidence of deep hooking than J-style hooks. The researchers found that a large or
intermediate sized circle hook (8/0-16/0) combined with a short leader and a fixed weight
resulted in the lowest incidence of deep hooking (4%) in the study. The investigators
also recommended using fishing tackle that shortens the time it takes to land the fish and
to minimize handling while unhooking and releasing red drum (Beckwith and Rand
2004a).
No research has been conducted on the effects of catch and release fishing on the
reproductive biology of red drum
, but it has been studied for snook in Florida (Lowerre-
Barbieri et al. 2003). A catch and release fishery exists for spawning aggregations of
snook during the summer months (June through August) at inlets and passes of the Gulf
and Atlantic coasts of the State. Histological examination of ovaries of recaptured snook

82
showed that the stress of being caught and released by anglers did not cause females to
interrupt or term
inate spawning (Lowerre-Barbieri et al. 2003). The snook were caught
during the warm summer months, and fishing for adult red drum on the spawning
grounds occurs during a similar time of year (late summer and early fall) in North
Carolina. However, the results from this research cannot be assumed to be the case for
red drum and are included as a comparison to a similar fishery under similar conditions.
Educational information provided by the NCDMF and North Carolina Sea Grant,
educational sem
inars to recreational fishing clubs, video productions, magazine articles
and hook and line mortality studies have been successful in getting anglers to adopt
conservative angling practices for adult red drum (Barrios Beckwith et al. 2006). The
NCDMF and North Carolina Sea Grant conducted a survey of anglers who target adult
red drum to characterize this fishery (unpublished data, NCDMF). Overall (Atlantic
Ocean and Pamlico Sound), 56% of the respondents always use circle hooks and another
27% occasionally use circle hooks for adult red drum. The results were similar for
anglers in Pamlico Sound, with 52% of the respondents using circle hooks and 16% using
circle and J-style hooks for adult red drum. Many other State fisheries agencies also
provide educational information on the proper release of fish and on hooks and other gear
to reduce release mortality of fish. Much information on conservative angling practices
is available to anglers, and survey results show that anglers targeting adult red drum
utilize many of these practices. However, anglers are not required to use circle hooks or
other types of gear that improve the chance of survival for released red drum.
Large circle hooks, short leaders and fixed sinkers are proven to minimize the
chance of deep hooking red drum
in the western Pamlico Sound estuary (Beckwith and
Rand 2004b). This fishery is usually prosecuted by setting fishing rods in rod holders,
which results in slack line. The fixed sinker attached close to the hook prevents the fish
from ingesting the hook past the pharyngeal teeth (Beckwith and Rand 2004b). Anglers
targeting adult red drum in the surf on the Outer Banks use either circle hooks or J-style
hooks with sliding sinkers. Both long and short leader lengths are used with short leaders
gaining popularity due to the ability to cast the rig a greater distance. Although no
studies of deep hooking red drum in the surf exist, anecdotal evidence indicates a low
incidence of deep hooking due to anglers tending their fishing rods and the fishing line
remaining tight so the anglers can feel the red drum eat the bait.
Fishing gear regulations such as requiring the use of circle hooks and other gear
types to f
ish for adult red drum would decrease the release mortality. Fishing gear
regulations are used for other recreational fisheries. The State of Florida limits the
number of fishing rods that can be used and prohibits certain gear types for tarpon fishing
in Boca Grande Pass on the west coast of Florida from April to June
(
http://www.MyFWC.com
). And the North Carolina Wildlife Resources Commission
(NCWRC) requires all anglers on the Roanoke River to use single barbless hooks from
April 1 to June 30 to reduce the release mortality of striped bass on the spawning grounds
(http://www.ncwildlife.org
). However, gear restrictions would be difficult to enforce in
the adult red drum fishery. Much of the fishing effort occurs at night and many anglers
fish from boats. Fishing for adult red drum in North Carolina covers an extensive area
whereas the tarpon fishery at Boca Grande Pass and the striped bass fishery on the
Roanoke River take place in relatively discrete locations. Anglers also fish for other
species at the same time and locations where adult red drum fishing takes place. In

83
addition, some anglers will fish for other species while they are fishing for adult red
drum
. Therefore, enforcement officers could have difficulty determining whether certain
anglers are targeting adult red drum. And requiring all anglers to use certain gear types
regardless of whether they are fishing for adult red drum could significantly limit, if not
eliminate, fishing for other species.
The survey conducted by the NCDMF and North Carolina Sea Grant showed
anglers targeting adult red drum
in Pamlico Sound used J-style hooks no smaller than
size 5/0 and circle hooks no smaller than size 7/0 (unpublished data, NCDMF). Anglers
targeting fish such as southern flounder, spotted sea trout, juvenile red drum and bluefish
use hooks much smaller than the hooks used to target adult red drum. Implementing a
maximum hook size for J-style hooks that is much smaller than what is used in the adult
red drum fishery would allow for the targeting of other species, and would require
anglers who target adult red drum in Pamlico Sound to use circle hooks. Adult red drum
are incidentally caught on small J-style hooks, but anglers targeting adult red drum are
not likely to use small J-style hooks because these hooks do not hold up to the pressure of
landing large fish. However, a maximum hook size regulation would be difficult to
enforce due to the variations in hook styles and inconsistent hook measurements among
hook manufacturers. And any fishing gear regulations for adult red drum fishing in
Pamlico Sound would likely cover a very large area due to their widespread distribution.
This regulation would require tarpon anglers in Pamlico Sound fishing with
natural bait to use circle hooks. Circle hooks are com
monly used in the Florida
recreational tarpon fisheries, but they are not widely used in the Pamlico Sound tarpon
fishery (Captain George Beckwith, Downeast Guide Service, Personal Communication).
However, this regulation implemented to reduce the release mortality of adult red drum
could also reduce the release mortality of tarpon, as well.
Closing water bodies or areas where and when adult red drum are known to
congregate would increase the protection of these fish. For adult red drum
, this could
include ocean inlets, the surf along the Outer Banks and the western Pamlico Sound
estuary. The National Marine Fisheries Service (NMFS) prohibits fishing and possession
of striped bass in the Exclusive Economic Zone (EEZ) of the Atlantic Ocean to limit the
harvest and fishing effort. Similarly, Maryland prohibits the fishing for striped bass on
the spawning grounds in the Chesapeake Bay tributaries from March 1 through May 31
(
http://www.dnr.state.md.us
). However, every Atlantic coast state from Maryland to
Florida has a recreational catch and release fishery for adult red drum without any closed
areas. Closed areas would require much enforcement and would involve the same
enforcement difficulties as requiring specific gear types. The closed areas could be large
and cover multiple water bodies. Adult red drum are found in many different locations
along the coast throughout the year (Burdick et al. 2007), and it may not be possible to
designate each one as a seasonal closed area or water body. Closed areas could be
limited only to known red drum spawning locations. Barrios Beckwith et al. (2006)
found that spawning activity was related to day of the year, year, depth and salinity in the
lower Neuse River. Factors such as salinity and dissolved oxygen can vary annually and
daily, which results in different distributions of red drum spawning aggregations. And
spawning locations in the rest of the State that are not as well documented would remain
open to fishing.

84
A number of guide services in North Carolina specialize in fishing for adult red
drum
; closed seasonal areas or water bodies would have a negative impact on their
businesses. These closed seasonal areas or water bodies would also impact some fishing
tournaments that take place in these locations. In addition, this would have a significant
impact for anglers participating in the NCDMF Red Drum Volunteer Tagging Program.
Closing water bodies or areas to adult red drum fishing would severely decrease the
number of red drum tagged and minimize the use of this data source by the NCDMF.
The incidental catch of adult red drum would still occur in these areas by anglers
targeting other species. Anglers fishing for tarpon in western Pamlico Sound employ
similar bait and tackle as anglers targeting adult red drum. The same situation occurs for
anglers fishing for striped bass, cobia and bluefish along the surf and inlets of the Outer
Banks. Fishing for a variety of others species also takes place in these areas and the gear
employed and the specific locations fished by these anglers rarely results in the incidental
catch of adult red drum. Closing areas or water bodies to all recreational fishing would
further prevent the incidental catch of adult red drum but would negatively impact
anglers who do not target and who are unlikely to catch adult red drum.
Current Authority
North Carolina Fisheries Rules for Coastal Waters (15A NCAC)
03M.0501 Red Drum (Director’s proclamation authority for red drum)
Management Options/Impacts
(+ potential positive impact of action)
(- potential negative impact of action)
1) Status quo (continued educational information on conservative angling practices for
red drum
).
+ Anglers informed about best practices to minimize release mortality of
adult red drum
+ Could improve stock recover due to reduced release mortality through
anglers adopting conservative angling practices
+ Coastal Recreational Fishing License (CRFL) identifies a known user
group to provide information
+ No negative impact on the NCDMF adult red drum volunteer tagging
program
+ No additional enforcement responsibilities
+ No additional regulations or rule changes
- The use of hooks and gear that increase release mortality still allowed
- No reduction in effort
- Fishing still occurring on spawning grounds
85
2) Require the use of circle hooks and other gear types to reduce release mortality of
adult red drum
.
+ Reduce release mortality of adult red drum
+ Provides additional protection to spawning stock
+ Could improve stock recovery due to reduced release mortality
- Difficult to enforce
- Regulations could apply to much of the State’s coastal waters
- Additional rules and regulations required
- Could affect fishing for other species
3) Implement a maximum hook size for J-style hooks that is much smaller than what is
used in the adult red drum
fishery in Pamlico Sound
+ Require the use of circle hooks in the adult red drum fishery, which would
reduce the release m
ortality
+ Provides additional protection to spawning stock
+ Could improve stock recovery due to reduced release mortality
+ Would allow fishing for other species to take place
+/- Would require the use of circle hooks in the tarpon fishery
- Difficult to enforce
- Additional rules and regulations required
- Regulated area could be very large
4) Seasonal closures of water bodies or areas to adult red drum fishing where adult red
drum
are known to congregate.
+ Provides additional protection to spawning stock
+ Could improve stock recovery due to reduced release mortality
+/- Incidental catch of adult red drum could still occur
- Additional enforcement required
- Difficult to enforce
- Additional rules and regulations required
- Affects the NCDMF Red Drum Volunteer Tagging Program
- Economic impact to guide services and tournaments that target adult red
drum
- Prohibits a popular recreational fishery
5) Seasonal closures of water bodies or areas to all recreational fishing where adult red
drum
are known to congregate.
+ Provides additional protection to spawning stock
+ Could improve stock recovery due to reduced release mortality
- Additional enforcement required
- Additional rules and regulations required
- Difficult to enforce
- Eliminates all recreational fishing in these areas or water bodies
- Affects the NCDMF Red Drum Volunteer Tagging Program
86
- Economic impact to guide services, tournaments and local communities in
these areas or water bodies
- Prohibits a popular recreational fishery
Management Recommendation
DMF and RDAC – During July through September, unlawful to use J-
hooks larger than 4/0 while fishing natural bait in Pamlico Sound and its
tributaries, excluding the Albemarle Sound Management Area (ASMA)
and the are from Core Sound south to the NC/SC state line.
Recommendation would also include status quo (continued educational
information on conservative angling practices for red drum)
MFC Selected Management Option:
It is unlawful to use any hook larger than 4/0 from July 1 through
September 30 in the internal coastal fishing waters of Pamlico Sound
and its tributaries south of the Albemarle Sound Management Area
and north of Core Sound while using natural bait from 7:00 p.m. to
7:00 a.m. unless the terminal tackle consists of:
(1) A circle hook defined as a hook with the point of the hook directed
perpendicularly back toward the shank, and with the barb either
compressed or removed.
(2) A fixed sinker not less than two ounces in weight, secured not
more than six inches from the fixed weight to the circle hook. (also
continued education on fishing methods that minimize risk to fish)
Research Recommendations
•
Improved catch and effort data for the adult red drum fishery, particularly the fishery
that occurs at night.
• Identify the spawning areas for adult red drum in North Carolina.
• Economic analysis of the adult red drum fishery.
• Conduct further studies/surveys on hooks and tackle currently used in adult red drum
fishery.
• Incorporate information on conservative angling practices for red drum into the
upcoming Angler’s Guide and make the information available on the NCDMF
website.
87
10.2.3 Recreational Bag and Size Limits
Issue
The recreational bag limit for red drum is currently 1 fish per person per day from
18 to 27 inches TL. The North Carolina fishery management plan for red drum may
consider options to modify the current bag limit and other recreational management
measures.
Background
The recreational fishery for red drum in North Carolina occurs year round with
peaks in the spring and fall. Similar to the commercial fishery, the recreational red drum
fishery varies annually and is dependent on year class strength. Available data from the
MRFSS from 1989 to 2006 indicate that:
1. Recreational landings of red drum have averaged 227,461 pounds.
2. Landings of red drum vary annually. Recreational landings increased
from
39,077 pounds in 1997 to 591,428 pounds in 1998 (Table 20).
When reductions in harvest were needed to reduce fishing mortality, major
consideration was given to making reductions equitable for both the commercial and
recreational sectors. Estimated reductions, based on the one fish recreational bag limit
and the seven fish commercial trip limit, were intended to reduce annual harvest in each
fishery by approximately 40%. Because landings vary annually dependent upon the year
class strength of fish available in the slot limit it is difficult to ascertain if the reductions
were successful over a short period of time. Comparing across each management period
should reduce annual variability allowing for some comparison. The prior management
period (1992 to 1998) was compared to the current management period (1999 to 2006).
However, the 1999 and 2000 harvest years were excluded from the analysis because
during this time a 100-pound trip limit was in place for the commercial fishery as
opposed to the current 7 fish bycatch allowance. For both periods, the recreational
fishery landed approximately 60% of the overall catch (Table 21). In addition, compared
to the prior period, average annual landings in current m
anagement period were reduced
by 35% for the recreational fishery and by 36% for the commercial fishery. Based on
this information, the current management was successful at both maintaining equitability
among the sectors and at reducing harvest.

Table 20. North Carolina red drum catches for recreational anglers (MRFSS), for
1989 – 2005 with PSE. All weights are in pounds. Com
mercial weights
are included as a reference, and combined weights are reported.
A + B1* B2*
A
+ B1 Commercial Total
Year # Landed PSE # Released PSE
Weight (lb)
PSE Weight (lb) Weight (lb)
1989 62,359 16 7,566 34 214,849 20 274,356 489,205
1990 33,149 28 12,452 38 302,994 64 183,216 486,210
1991 38,658 15 121,178 14 108,268 16 96,045 204,313
1992 23,593 19 60,230 18 109,134 20 128,497 237,631
1993 49,493 12 182,301 20 266,459 14 238,099 504,558
1994 28,953 16 107,662 14 192,060 21 142,119 334,179
1995 88,593 12 164,520 11 405,620 13 248,122 653,742
1996 36,746 15 35,752 18 204,556 16 113,338 317,894
1997 8,749 26 259,570 11 39,077 28 52,502 91,579
1998 114,638 12 199,701 11 591,428 13 294,366 885,794
1999 64,739 15 247,146 10 326,303 15 372,942 699,245
2000 61,618 13 203,967 14 316,029 13 270,953 586,982
2001 23,142 16 238,552 14 132,578 17 149,616 282,194
2002 42,541 15 640,857 11 182,226 17 81,364 263,590
2003 25,481 17 75,561 15 118,808 18 90,525 209,333
2004 30,165 19 191,593 10 114,434 19 54,086 168,520
2005 53,154 21 327,859 15 242,019 21 128,770 370,789
2006 52,383 14 463565 10 219362 15 168,489 387,851
Numbers
Recreational
Definitions of recreational catch type:
*A = fish brought ashore in whole form which can be identified, enumerated, weighed, and measured
by interviewers.
*B = fish not brought ashore that can be separated into: B1 = fish caught used as bait, filleted, or
discarded & B2 = those released alive.
Table 21. Average annual landings of red drum by fishing sector
and m
anagement period.
Average Annual Landings (percent of combined)
Period Recreational Commercial Combined
1992 to 1998 258,333 (59.8%) 173,863 (40.2%) 432,197
2001 to 2006 168,238 (60.0%) 112,142 (40.0%) 280,380
Discussion
The reduction in the recreational bag limit from 5 to 1 was intended to reduce the
recreational harvest while still allowing recreational anglers to possess a fish for personal
consumption. The reduction in overall harvest is intended to allow for the continued use
of the resource by the public, while diverting the overfishing that had been occurring in
the previous management period.
The most recent stock assessment for red drum in North Carolina indicates a
m
arked improvement in the escapement of juveniles to the adult stocks and is reflective
of the current recreational and commercial harvest controls. With a target Spawning
88

89
Potential Ratio (SPR) of 40%, and a sustainable harvest SPR threshold definition of 30%
escapem
ent, the current level of SPR is above the overfishing threshold and appears to be
near the target, although these estimates may be considered optimistic given the lack of
information on commercial discards.
Amendment 2 to the ASMFC Red Drum Fishery Management Plan does not
m
andate specific bag and size limits. The Amendment specifies that all states must
implement an appropriate bag and size limit which will attain the management goal of
40% SPR. For states in the northern region which still have a commercial harvest of red
drum, the overall harvest restrictions for commercial and recreational harvest combined
must be sufficient to attain a 40% SPR.
The following combinations of bag and size limits were conducted on data for the
period of 1992 to 1998 (Table 22)(Vaughan and Carmichael 2001). They are based on
necessary reductions in fishing m
ortality through both recreational bag and size limits
and commercial trip limits. Each combination of bag and size limit is considered to
provide conservation equivalencies that meet or exceed the 40% SPR. All combinations
assume a 40% reduction in commercial harvest over the prior management period (1992
to 1998), which was achieved by the trip limit currently in place.
Table 22. Potential bag and size limit combinations that are
projected by the bag and size lim
it analysis to
achieve the 40% SPR.
Bag Limit Slot Limit (total length)
1 18-27”
2 19-27”
3 18-26”
The bag and size limit analysis assumes that the conditions prevalent during the
1992 to 1998 period will rem
ain constant into the future. Changes in angler behavior,
angler success or increased effort and participation over time could offset any predicted
gains. For the period of 1999 to 2005, reducing the possession limit to one fish and
limiting all harvest to fish between 18 and 27 inches was effective at increasing SPR
values above the overfishing definition as predicted. Changes to this management
strategy should be carefully considered as each bag and size limit combination has
potential risks. For instance, increasing the minimum size limit has less potential
positive effect as does decreasing the maximum size. This is because harvest loss due to
increases in the minimum size can potentially be offset through delayed harvest as the
fish grow above the minimum legal size. This is particularly true for a fast growing fish
such as red drum whose growth from 18 to 19 inches will take approximately one month.
Conversely, decreasing the maximum size carries no risk of delayed harvest. Protecting
the larger fish maximizes the benefit to the SPR estimates because these fish have already
been exposed to most of the fishery effort and have an increased chance of survival to
maturity.

A bag limit of one fish was effective at reducing harvest as intended. While the
reduction from five fish to one fish was a drastic reduction in the potential harvest for a
given angler, it was not a tremendous reduction in actual overall harvest. For the period
of 1992 to 1998, very few trips landed more than two red drum. A one fish bag limit was
necessary to achieve ample reductions without a severely reducing the slot limit.
Increasing the bag limit above one, in combination with adjusting the slot limit may lead
to reduced SPR estimates due to recoupment in the fishery. Recoupment occurs when
anglers either increase effort or change their behavior to increase or maintain harvest in
response to regulatory changes. Projected gains from decreasing the slot limit can easily
be offset if the resulting increased bag limit leads to increases in effort or targeting. In
addition, angler success rates and/or fish availability can also contribute to recoupment
under more liberal bag limits. This tends to be particularly true when abundant year
classes enter the slot. Current trends in angler success rate for red drum indicate a
positive trend (Figure 20). It is well accepted that recreational effort has and will
continue to increase over tim
e (Figure 21 and Figure 22). In addition, technology
continues to im
prove, enhancing anglers potential for success. The current 1 fish bag
limit at 18 to 27 inches has less potential for recoupment in the red drum fishery and has
proven effective at increasing SPR levels. Increased bag limits with corresponding slot
limits do offer viable alternatives based on the bag and size limit analysis, but also have
risks for which the analysis cannot quantify. It should be noted that all options, including
the current regulations, could result in lower SPR values, albeit to varying degrees, if
fishing effort or participation increases.
0
0.05
0.1
0.15
0.2
0.25
0.3
0.35
1987 1989 1991 1993 1995 1997 1999 2001 2003 2005
Yea
r
Probability of Success
Prob of Success
Figure 20. Probability of success for anglers targeting red drum recreationally.
Successful trip defined as a trip that targeted and landed red drum
.
90

0
1,000,000
2,000,000
3,000,000
4,000,000
5,000,000
6,000,000
7,000,000
8,000,000
1981
1983
1
9
8
5
1987
1989
1991
1993
1
9
9
5
1997
1999
2001
2003
2
0
0
5
Year
Number of Trips for All Areas and
Modes
0
500,000
1,000,000
1,500,000
2,000,000
2,500,000
Number of Trips for Inland/All
Modes
All Areas/Modes
Inland/All Modes
Figure 21. Recreational fishing effort (number of trips) from
1981 to 2006. Source
MRFSS.
0
500,000
1,000,000
1,500,000
2,000,000
2,500,000
1981
1
98
3
1
98
5
1987
1989
19
9
1
1
99
3
199
5
1997
1999
2
00
1
2
00
3
2005
Year
Number of Participants
Figure 22. Number of participants in North Carolina recreational fishery (coastal,
non-coastal and non-resident).
Another consideration to choosing an appropriate bag and size limit option should
be to account for regional discrepancies in the availability of red drum
at a given size.
Red drum recruit throughout the estuaries as juveniles but tend to be particularly
91

abundant in the upper reaches of the estuary at smaller sizes. As they become larger,
they tend to have a net movement to higher salinity areas, such as coastal inlets.
Increasing the minimum size could reduce the availability of fish available for harvest
along the western sounds. Investigation of MRFSS length frequencies by region
indicates that areas along the western Pamlico Sound would be most adversely impacted
by the increases in the minimum size limit, while decreasing the maximum size limit
would have the largest impact on the eastern Pamlico (Figure 23; Table 23). Either
increasing or decreasing the size lim
it had a similar impact on the southern region.
Harvest of illegal size fish (non-compliance) was significant for all regions.
0
2
4
6
8
10
12
14
16
7 9 11 13 15 17 19 21 23 25 27 29 31 33 35 37 39 41 43 45
WHOLE INCHES (TOTAL LENGTHS)
PERCENT OBSERVED
DARE COUNTY AND OCRACOKE
CARTERET COUNTY AND SOUTH
WEST AND INLAND COUNTIES
Figure 23. Length frequency distribution of red drum
observed in MRFSS survey by
region from 1993 to 2006.
Table 23. Percent non-compliance (red drum harvested that were <18 or >27
inches total length) and the percent of
fish measured that would be illegal
if either a 19 inch minimum or a 26 inch maximum size limit were put
into place. Samples from MRFSS 1993 to 2006.
Dare County and
Ocracoke
Carteret
County and
south
West and
Inland
Counties
% non-compliance 16.7 19.7 9.2
19 inch minimum size* 6.3 9.8 13.9
26 inch maximum size* 9.6 8.5 3.8
* non-compliant fish were not included in this analysis.
92

93
If increasing the bag limit is a desirable option for the public then a conservative
alternative m
ay be to decrease the maximum size limit to 26 inches and implement a bag
limit of two fish. Reducing the maximum size (as opposed to increasing the minimum
size) will be more beneficial to future SPR values and the bag limit is the most
conservative step in lieu of status quo. Additionally, there would be minimal
discrepancies in regional distribution of fish, where an increase in the minimum size
would create a negative impact on the lower salinity areas where larger slot size red drum
are less common.
Current Authority
North Carolina Fisheries Rules for Coastal Waters (15A NCAC)
03M.0501 Red Drum (Director’s proclamation authority for red drum)
Management Options/Impacts
(+ potential positive impact of action)
(- potential negative impact of action)
1) Status quo (1 fish 18-27 inches TL)
+ Same size limit as commercial sector - enforcement
+ Increase likelihood of reaching management goals (SPR rates)
+ Familiarity and acceptance by fishermen
+ Greatest size range – greater opportunity to keep a fish
+ No changes before next assessment
- Limits harvest for individuals
- Potential for increased release mortality
2) Increase the bag limit and change size range
+ Increase number of fish for personal consumption
+ Potential for less discards (based on increased bag limit)
- Reduced range of sizes over which to keep a fish
- Discrepancy in recreational and commercial size limits
- Potential for recoupment and/or delayed harvest in fishery which m
ay
negatively impact SPR
- Changes before next assessment (2008)
- Regional discrepancies in availability of fish by size
94
Management Recommendations
DMF and RDAC - Status quo (1 fish 18-27 inches TL)
MFC Selected Management Option
Endorses DMF and RDAC recommendation
Research Recommendations
• Assess the size distribution of recreational discards
• Increase recreational sampling coverage
• Expand recreational sampling to include night-time intercepts
10.2.4 Commerical Harvest Limits
10.2.4.1 Commercial Trip Limit
Issue
Can the current bycatch allowance in the Red Drum FMP of 7 fish be increased?
Background
Historically, annual landings of red drum have been highly variable from year to
year. Annual landings during the 1970's averaged 83,009 lbs per year and ranged from
7,500 to 214,000 lbs (Figure 24). Annual landings from the 1980's were greater than
those from
the 1970's, averaging 203,813 lbs per year and ranging from 52,561 to
283,020 lbs. Landings during the 1990's averaged 186,932 lbs per year and ranged from
52,548 to 372,749 lbs. The majority of the landings have historically originated from
Pamlico and Core sounds and the Atlantic Ocean. During the 1970's, no commercial gear
dominated landings although long haul seines and common haul seines were generally
the most productive gears with gill nets, pound nets, and fish trawls occasionally
contributing larger catches. Anchored and run-around gill nets were the dominant gear
during the 1980's and 1990's, accounting for greater than 70% percent of annual
commercial landings. Most of these gill net fisheries are seasonal, targeting flounder,
spotted seatrout, and striped mullet along the barrier islands and mainland shorelines.
Although they catch red drum incidentally, red drum can make an important contribution
to the overall catch.
A directed fishery that developed in the mid-1990's used run-around gill nets to
encircle schools of red drum
and accounted for 31% of all red drum commercially
harvested from 1994 to1998. Prior to the implementation of trip limits in 1998, nearly
one-half of the total annual commercial harvest of red drum was accounted for by only a

few trips landing large amounts of red drum. From 1994 to 1998, a total of 1.1% of the
trips that reported landings of red drum accounted for 48.5% of the total harvest. For this
period, the largest landings of red drum primarily occured behind the 'Outer Banks' from
Oregon Inlet to Ocracoke during the spring and fall. Gears that typically had large
landings of red drum were runaround gill nets and long haul nets and these gears made up
a larger proportion of the landings by gear during this period (Figure 25). These gears
have proven to be effective in circling large schools of red drum
. Participation in the
run-around gill net fishery increased during this period as many of these fishers actively
pursued schools of red drum. While there have been a few exceptional long haul catches
of up to 10,000 pounds, a typical catch for a run-around gill net trip would range from
100 to 1000 pounds.
0
50000
100000
150000
200000
250000
300000
350000
400000
1950
1952
1954
1956
1958
1960
1962
1964
1966
1968
1970
1972
1974
1976
1978
1980
1982
1984
1986
1988
1990
1992
1994
1996
1998
2000
2002
2004
2006
Year
Commercial landings (lb)
Figure 24. Annual commercial landings of red drum from 1950 to 2006.
The 7 fish bycatch provision was developed by DMF in an effort to control the
com
mercial harvest by eliminating the targeting of red drum while still allowing a
reasonable bycatch allowance when taken incidental to other fisheries. The trip limit was
effective at shifting landings back towards gears that take red drum incidentally to other
species (Figure 25). Preparation of the red drum FMP began in 1998. Interim rules were
developed in October 1998 to reduce harvest by both recreational and com
mercial
fishermen and protect a strong year class that was entering the fishery. The bag limit for
the recreational fishery was reduced from 5 fish to 1 fish and a commercial trip limit was
established at 100 pounds while the annual harvest cap of 250,000 pounds was
maintained.
95

0
10
20
30
40
50
60
70
80
90
100
1987 1989 1991 1993 1995 1997 1999 2001 2003 2005
Year
Percent of total catch
Anchored gill net
Run-around gill net
Pound net
Long haul seine
Beach seine
Figure 25. Proportion of commercial red drum ladings by gear type from 1987 to 2006.
In 1999, the fishery was closed by proclamation on November 5, 1999 because
the cap had been exceeded. The final harvest for 1999 was 372,942 pounds, well over
the 250,00 pound cap.
The 100 pound trip limit was suspended on July 22, 2000 and replaced by a 5 fish
per day lim
it for commercial operations to ensure that the harvest limit was not exceeded.
The fishery was closed on August 19, 2000.
During 1999 and 2000, the early closures prevented the southern flounder gill net
fishery, the fishery with the greatest bycatch of red drum
, from landing any red drum.
The MFC decided in October 2000 to move forward with the provision in the FMP to
change the start of the fishing year from January 1 to September 1 to ensure that the
unavoidable bycatch of red drum occurring in the flounder fishery could be landed. As a
result, a proclamation was issued on October 11, 2000 that reinstated the 5 fish bycatch
allowance as a transition into the new commercial harvest season (September 1 - August
31). The final commercial harvest figure for 2000 was 270,953 pounds.
Proclamation FF-47-2001 was issued on September 6, 2001 to implement the
approved red drum
FMP setting the bycatch allowance at seven (7) and requiring that red
drum make up less than 50% of the total catch of all finfish (excluding menhaden) landed
daily for a commercial fishing operation. The intent was to ensure that annual harvest
remains below the cap and to allow red drum harvest only as bycatch taken incidental to
other fisheries. The annual landings of red drum have remained below the cap since this
proclamation was issued.
96
97
Fishermen and members of the MFC have requested a re-examination of the
current trip lim
it, as a result of annual landings being below the cap, in hopes of
increasing the bycatch allowance. The commercial cap was originally set as a harvest
level that would prevent a directed fishery back in 1990 when the blackened redfish craze
developed in the Gulf of Mexico.
The commercial cap was set at 300,000 pounds and
subsequently reduced to 250,000 pounds in 1991, but is not based on any population
assessment and should not be viewed as the amount of harvest that can be allowed
in a given year. If an assessment based annual commercial harvest limit were put
into place for the commercial red drum fishery in North Carolina, it would be
considerably less than 250,000 pounds. For example, from 1992 to 1998 North
Carolina’s commercial landings averaged approximately 174,000 pounds for a period
when the escapement rate was estimated to be 18%, well below the current target of 40%.
For a quota managed fishery, any reduction in harvest necessary to increase escapement
would be taken from these average landings and not from the 250,000 pound cap, a level
of landings that historically have rarely been achieved. North Carolina opted not to
reduce the commercial cap, but chose instead to reduce harvest through a daily bycatch
allowance. The current commercial trip limit has two advantages for the commercial
fishery over a quota managed fishery: 1) it allows more harvest to occur in years where a
strong year class is present than would be possible with a quota, and 2) it does not require
the commercial season to close resulting in discards after the allowable harvest is taken.
When Amendment 2 to the ASMFC Red Drum FMP was approved in 2002, it
included analysis that calculated a reduction in landings necessary to achieve a target
40% escapem
ent rate. A compliance requirement of Amendment 2 is that each state must
implement management measures in order to achieve 40% escapement. No new
regulations were necessary in North Carolina to achieve this reduction because of the 7
fish commercial bycatch allowance and the 1 fish recreational bag limit in place as a
result of the NC Red Drum FMP. Projections based on these regulations estimated North
Carolina’s escapement rate to be slightly above 40%. Results of the most recent
assessment indicate that the regulations were largely successful in achieving this goal.
An additional compliance criterion of Amendment 2 is that states must maintain current or
more restrictive commercial fishery regulations for red drum, i.e. no relaxation of current
fisheries management measures. This stipulation removed the NC Fisheries Director’s
ability to modify the commercial trip limit. The sliding trip limit set by the Director was
originally approved as part of the 2001 NC Red Drum FMP. In August 2003, North
Carolina requested that the ASMFC South Atlantic Board approve a motion to include this
authority in the framework of Amendment 2 also. If approved the NC Fisheries Director
would once again be able to raise or lower the current 7 fish commercial bycatch allowance
without going out of compliance with the ASMFC plan. The intent of the motion was to
maintain a bycatch only fishery and only to allow increases when necessary to account for
unavoidable bycatch. The motion was approved. To date, the 7 fish commercial trip limit
has remained unchanged.

Discussion
The DMF has monitored the red drum commercial harvest and conducted fishery-
dependent gill net sampling that allows an analysis of the red drum catch per trip. Based
on fishery-dependent, estuarine sampling of large and small mesh gill nets from 2004-
2006 (Trips sampled = 1,404), 80% of the trips sampled contained no red drum. The
majority of trips (67%) that did land red drum (n = 279) contained 3 red drum or less.
The data indicate that there were not many trips that caught their bycatch limit of
7 fish (Figure 26). Very few trips (3% for all trips and 13% for trips that landed red
drum
) had 7 or more red drum, indicating that most trips do not encounter 7 legal size red
drum and that waste is not a large problem.
For All Estuarine Gill Net Trips that Landed Red Drum
87%
13%
0%
10%
20%
30%
40%
50%
60%
70%
80%
90%
100%
Percent of trips with < 7 red drum Percent of trips with >= 7 red drum
For All Estuarine Gill Net Trips
97%
3%
0%
10%
20%
30%
40%
50%
60%
70%
80%
90%
100%
Percent of trips with < 7 red drum Percent of trips with >= 7 red drum
Figure 26. Percentage of estuarine gill net trips that did or did not capture the seven fish
bycatch allow
ance. Given for all trips sampled and for all trips sampled
where red drum were present.
In addition to fishery dependent sampling where commercial trips are intercepted
at the fish house, NCDMF also has observer coverage for the estuarine gill net fishery
since 2001. During this period, 1,470 large m
esh (
≥5” stretch mesh) estuarine gill net
trips have been observed. The majority of the trips occurred in eastern Pamlico Sound
with southern flounder being the most abundant species captured. Similar to the
dependent fish house data, most trips did not exceed the current 7 fish bycatch allowance.
Of all trips observed, 98% had less than the allowable limit. For trips that landed red
drum, 8% had the 7 fish bycatch allowance.
For all trips observed, 1,246 legal size red drum were captured (Table 24). Of
these, the vast m
ajority (83%) were either marketed or released alive. Unmarketable
discards accounted for 7% of legal size red drum encountered, while dead regulatory
discards accounted for 8%.
Further analysis was conducted to determine the fate of red drum when the 7 fish
bycatch allowance was encountered. This occurred on 1.8% of the 1,470 observed trips.
These 27 trips encountered 334 legal size red drum
. The fates of these fish included
harvested (59%), released alive (17%), unmarketable discards (4%) and dead regulatory
discards (19%).
98

99
Table 24. Fate of legal size red drum (n=1,246) in the large
m
esh estuarine gill net fishery. NCDMF observer
data from 2001 to 2006 (n=1,470 trips sampled)
Disposition Number Percent
Marketed 866 70%
Released Alive 166 13%
Dead Discard 98 8%
Unmarketable 89 7%
Unknown 30 2%
Total 1,246 100%
In addition to the large mesh trips that were observed, 405 small mesh gill net
trips were also observed. No m
ore than six legal size red drum were encountered on any
of these trips.
One FRG study of incidental catch and discard of red drum in large mesh gillnets
was conducted in 2002 in the Newport River and specifically addressed the issue of the 7
fish bycatch allowance (Buckel et al. 2006). Fishing 10 nets (100 yards each) a day from
June through November, the catch of red drum exceeded the daily bag limit on 23% of
the days. Of the 326 red drum retrieved from the gill nets, 32.5% were dead, but only 15
of the 106 dead red drum had to be discarded due to size limits and 6 were discarded
dead based on harvest limits. The majority of discards were released alive. The author
notes that the findings support the current regulations (7 fish limit) but also
acknowledges that the study took place during a year when red drum available in the slot
limit were at a low abundance.
An additional concern raised by fishermen has been over the requirement that red
drum
be landed as bycatch to other finfish. Both the state and ASMFC plans for red drum
allow for only the non-directed (bycatch) landings of red drum, where they are taken
incidental to other target species. Since 2001, it has been required that red drum make up
less than 50% by weight of all finfish (excluding menhaden) landed by a commercial fishing
operation. Requiring red drum to be landed as bycatch presents a problem when red drum
are encountered in a fishery prior to other ‘target’ species being encountered. NC Marine
Patrol could interpret possession of red drum on board a vessel while the commercial
operation is engaged in fishing activity as a violation if the red drum possessed exceeds the
weight of other finfish in possession at the time of inspection. Available data from the
observer program indicates that the percent of fish discarded due to this is not significant.
Options could be considered to either 1) allow red drum to be possessed up to the daily
bycatch allowance while actively fishing gear but require adequate poundage of other finfish
at time of landing, or 2) allow fishing operations to possess some red drum outside of the
bycatch provision.
Increasing the commercial trip limit has been the topic of debate among
com
mercial fishers and several MFC members for some time. An increase could allow
for some red drum in the slot limit to be harvested as opposed to being discarded dead.
100
However, all available data to date suggests that discard levels have been low to
m
oderate and that most legal size red drum encountered are either harvested or released
alive. Increasing the bycatch allowance may also entice purposeful setting of gill nets in
areas where red drum are known to occur. The current stock assessment indicates that
SPR and escapement rates are currently above the overfishing definition and approaching
the target. It must be noted that the assessment fails to account for the size and
magnitude of discards in the commercial fishery, a factor that in all likelihood makes the
current SPR and escapement rates optimistic.
A criterion for increasing harvest
outside of an excessive bycatch issue would be if the escapement rate of 40% were
being exceeded. This is not currently the case.
If bycatch levels justify an increase in the trip limit, the NCDMF Director has the
authority to increase the trip limit. Recently it was proposed at a MFC meeting to
consider allowing the first three red drum captured to be landed without the requirement
that other edible finfish be present (not as bycatch) and then to continue the current 7 fish
bycatch allowance. This would create a 10 fish daily limit provided other species were
captured to allow for red drum bycatch of 7 fish. The additional 3 fish would allow for
any red drum captured prior to other targeted species to be taken without the possibility
of being found out of compliance with the current 50% bycatch provision.
10.2.4.2 Commercial Fishing Year
Issue
Avoiding closures in the commercial red drum bycatch fishery.
Background
A September 1 to October 31 commercial fishing year was implemented as part of
the 2001 NC Red Drum FMP. This shift in the commercial fishing year was made to
ensure that there would be no closure during peak landings that typically occur in the fall
(see discussion in 12.2.4.1). Additionally, because red drum are a somewhat unavoidable
bycatch component to the southern flounder estuarine gill net fishery, it is imperative to
keep the red drum fishery open during the flounder season to avoid excessive discards
and waste.
Discussion
After exceeding the cap in 1999 and 2000, a 7 fish daily trip limit has kept
commercial landings well below the commercial cap since 2001. However, during the
current fishing year (2007/2008), atypically high winter landings have caused an early
closure for commercially harvested red drum due to the 250,000 lb cap being met and
exceeded before April. A concern in the current fishing year is that excessive discards
are now likely to occur primarily as a bycatch in the southern flounder estuarine gill net
fishery. In an effort to address the discard issue in the future, the RDAC recommended
implementing a spit in the commercial fishing year. Under the proposal, 150,000 lb of
red drum would be allotted to the period of September 1 to April 30, with the remaining
cap of 100,000 lb conserved for the second period (May 1 to August 31). Any remaining
cap from period one would be available for landing in period two. Reserving at least

101
100,000 lb of landings for period tow, during the warmer summer months, will reduce
w
aste when discard mortality is at its highest. Any potential closure under this scenario
would most likely occur during the winter when discard mortality is low.
As a result of the 2007/2008 commercial closure, the MFC took action
suspending the rule 3M .0501 which sets the com
mercial year and cap and allowed the
DMF Director to reopen the commercial season with a limited harvest of 4 fish per day
per commercial fishing operation. This action was taken due to the concern over the
potential for dead discards during the closed portion of the season that coincided with the
peak of the southern flounder estuarine gill net fishery. To ensure harvest of red drum
during this time is legitimate bycatch, red drum harvest is currently limited to
commercial fishers who are capturing southern flounder, striped mullet or spotted
seatrout. Red drum are considered a common bycatch in gill net fisheries targeting these
species. Overages during the current fishing year will be subtracted from the 2008/2009
fishing year and any closures if necessary will likely occur during the winter.
It should also be noted that any overages in the commercial cap during any
fishing year require that the am
ount of that overage (exceeding 250,000 lb) be subtracted
from the subsequent years commercial cap. This is a requirement of Amendment 2 to the
ASMFC Red Drum FMP.
Current Authority
North Carolina Fisheries Rules for Coastal Waters (15A NCAC)
03M.0501 Red Drum (Director’s proclamation authority for red drum)
Management Options/Impacts
(+ potential positive impact of action)
(- potential negative impact of action)
1) Status quo (7 fish limit with 50% bycatch provision, DMF Director m
aintains
proclamation authority to increase trip limit and adjust the bycatch provision as
needed)
+ Keeps harvest at a level to meet 40% escapement requirement
+ Increase likelihood of reaching management goals (SPR rates)
+ No regulatory changes before next assessment
+ Discards of legal size fish appear to currently be insignificant
+ NCDMF Director still has authority to increase bycatch allowance if discards
increase
- Limits harvest for individuals
- Potential for increased discards if a strong year class enters the slot limit
102
2) Increase the bycatch allowance
+ Potential for reduced discards
+ Increased harvest
- Potential for increased pressure in areas where red drum occur
- Potential negative impact on SPR
- Reduces likelihood of reaching management goals
- Data suggests discards are not currently a major issue
- NCDMF Director already has this authority to increase bycatch allowance
if discards increase
3) Allow for possession of some red drum while actively fishing gear even if
adequate finfish (excluding m
enhaden) have not yet been obtained.
+ Less discards
+ Increased harvest
- More difficult to enforce
- Potential for dead release of red drum that could have been released alive
4) Allow for the possession of some red drum without requiring that they be
bycatch
(Example would be to allow three red drum to be landed without requiring other
finfish to be present; additional landed red drum
would be subject to bycatch
provision)
+ Less discards
+ Increased landings
- Potential for targeting
- Less incentive for netters to avoid areas where red drum typically occur
5) Implement a split season on the commercial fishing year, capping the period of
Septem
ber 1 to April 30 at 150,000 lb and conserving the remaining portion of
the cap (100,000 lb) for the period of May 1 to August 31. Unused cap in Period
1 can be carried forward to Period 2.
+ Avoid closure during the summer when discard mortality is highest
+ Less likely to have Cap overages
- May result in reduced landings if fish availability changes
Management Recommendations
DMF and RDAC –
1) Status quo (7 fish trip limit with 50% bycatch provision). Director retains
authority to modify the trip limit and bycatch provisions as needed.
2) Allow for the possession of up to 3 fish while engaged in red drum without
requiring that they be subject to the 50% bycatch provision. Upon
landing/sale all red drum possessed would be subject to any bycatch
requirements.
3) Implement a split season on the commercial fishing year, capping the period
103
of September 1 to April 30 at 150,000 lb and conserving the remaining
portion of the cap (100,000 lb) for the period of May 1 to August 31. Unused
cap in period 1 can be carried forward to period 2. Any annual commercial
harvest limit that is exceeded one year will result in the poundage overage
being deducted from the subsequent year’s commercial harvest limit.
MFC Selected Management Option
Endorses DMF and RDAC recommendations.
Research Recommendations
• Continued and expanded observer coverage in the commercial fishery.
• Expand independent gill net survey to other parts of the state.
10.2.5 Red Drum Discarded Bycatch in the Estuarine Gill Net Fishery
10.2.5.1 Statewide Estuarine Gill Net Bycatch Estimates
Issue
The occurrence and magnitude of regulatory and unmarketable red drum discards in
the estuarine gill net fishery.
Background
Non-harvest loss of red drum occurring from the use of commercial fishing gear is
currently not fully known. This lack of inform
ation continues to be a major source of bias
in accurately assessing the current stock status of red drum in North Carolina. Current
fishing mortality rates for red drum stocks in North Carolina appear to allow for adequate
escapement of juvenile red drum to the adult stock. These escapement rates, however, carry
the caveat that non-harvest losses in the commercial fishery are not known. This lack of
information on discards likely results in an overly optimistic estimate of escapement and
spawning potential ratio (SPR). Assessing the magnitude of discards in the commercial
fishery is listed as high research priority in both the 2007 red drum stock assessment update
(Takade and Paramore 2007) and Amendment 2 to the Atlantic States Marine Fisheries
Commission (ASMFC) Red Drum Fishery Management Plan (FMP) (ASMFC 2002).
Bycatch is an important issue facing the North Carolina Division of Marine
Fisheries (NCDMF) and the North Carolina Marine Fisheries Com
mission (NCMFC). The
Guidelines for the North Carolina Fishery Management Plans as adopted by the NCMFC,
set a standard for FMP’s to design management measures which minimize waste of fishery
resources, including both target and bycatch species. In addition, an objective of this
fishery management plan is to promote harvest practices that minimize bycatch of
unmarketable red drum. While non-harvest losses likely occur to some extent from various
commercial gears, it has been well accepted that the primary loss is likely due to the

104
bycatch of red drum in the estuarine gill net fishery. As a result, the 2001 NC Red Drum
FMP took m
easures to reduce red drum bycatch in the estuarine gill net fishery by requiring
the seasonal attendance of small mesh gill nets (<5” stretch mesh). Gill nets of this mesh
size select for red drum less than 18” TL and are a significant source of the bycatch
mortality, particularly in months when water temperatures are high. Current North
Carolina regulations require the attendance of small mesh gill nets from May 1 through
October 31 in areas known to be critical for juvenile red drum. These include all primary
and secondary nursery areas, areas within 200 yards of any shoreline, and the extensive
area of shallow grass flats located behind the Outer Banks. An exemption to this rule lifts
the attendance requirement for the region from Core Sound to the South Carolina border in
October to allow for the fall spot fishery. A study conducted in Core Sound during 1999
indicated that catches of red drum during the October fall spot fishery were relatively low.
All observed trips conducted during the study occurred while gill netters were fishing nets
set approximately 100 yards from shore. This practice of setting nets well off the shoreline
appeared to be effective at reducing the incidence of juvenile red drum bycatch in this
fishery. During the same study, Division gill nets set less than 100 yards from shore had
substantially more red drum bycatch than did sets made at >
100 yards from shore.
During the development of the 2001 NC Red Drum FMP, several issues were tabled
by the red drum
AC and DMF due to inadequate information. To address this data
deficiency, four research recommendations from the 2001 FMP were: 1) Collect
information on gill net effort by area/season; 2) Conduct at sea samples to estimate red
drum discards from gill nets; 3) Estimate the release mortality from gill nets; 4) Collect data
on the harvest and releases of red drum captured in gill nets under the Recreational
Commercial Gear License. New data has been collected to some extent for all four of these
research recommendations. This issue paper will provide a summary of all data collected to
date and will provide management options based on this new information.
All results reported are based on anchored estuarine gill nets unless noted
otherwise. Drift and run-around gill nets were not included in the analysis. Bycatch
from other fisheries/gears are not currently available.
1) Collect information on estuarine gill net effort by area and season.
Information specific to North Carolina’s estuarine gill net fishery can be drawn
from three DMF sampling programs briefly described below:
NC Trip Ticket Program
Commercial red drum landings and the red drum commercial cap are monitored
through the North Carolina trip ticket program
. Under this program licensed fishermen can
only sell commercial catches to licensed NCDMF fish dealers. The dealer is required to
complete a trip ticket every time a licensed fishermen lands fish. Trip tickets capture data
on gears used to harvest fish, area fished, species harvested, and total weights of each
individual species. The trip ticket program began in 1994.
105
Commercial Fish House Sampling
Commercial fishing activity is monitored through fishery dependent (fish house)
sampling. Sampling occurs dockside as fish are landed. Commercial fishers are
interviewed and the catch is sampled. Data collected includes information on location,
effort and gear characteristics, as well as information used to determine the size and age
distribution of species landed. Over the past decade gill nets have been the dominant gear
used for red drum accounting for >70% of the overall harvest. In 2006, 93.5% of the red
drum harvest was taken in gill nets, followed by pound nets with 4%.
Commercial Observer Program
Starting in October of 2000, the Pamlico Sound flounder gill net fishery has been
restricted, operating under an Incidental Take Perm
it (ITP) issued by NMFS to reduce
interactions with endangered and threatened sea turtles. The restrictions on this fishery are
effective from September 15 through December 31. Stipulations of the permit include
permitted entry, restricted areas, limited yardage of gill net and mandatory scientific
observer coverage. This ITP began the available observer data available for the estuarine
gill net fishery in North Carolina. From 2001 to 2003, coverage was limited to the fall
Pamlico Sound flounder gill net fishery. From 2004 to 2006, coverage was expanded by
DMF to include other regions and estuarine gill net fisheries. Participation in this expanded
coverage by commercial gill netters was voluntary. Information gathered during observer
trips includes data on effort and mesh sizes used, as well as, data on the size and ultimate
fate of captured species.
Information gathered from these three programs was used to characterize North
Carolina’s estuarine gill net f
ishery. North Carolina has a large number of commercially
valuable species that are targeted by gill nets throughout the year with no single size gill net
(i.e. mesh size) being ideal for all species. The result is gill netters utilize specific mesh
size nets depending on the species they intend to target. While multiple species are most
often landed for a single trip, a target (key) species most often represents the majority of the
catch.
In order to characterize a specific estuarine gill net fishery the species being
targeted m
ust first be identified. This information is not readily available and must be
inferred from the catch composition. Data collected from 2001 to 2006 was analyzed to
determine the target species for each individual trip made. As noted earlier, drift and run-
around gill nets were not included in the analysis. Using trip ticket data, the species of
highest abundance in landings was considered the target species and was used to define the
trip. After initial analysis, 95% of all gill net trips fell into one of sixteen key species.
These sixteen species were then each identified as a separate fishery. For those remaining
undefined trips, a hierarchy was used where the species of second and then third highest
abundance was used to define the trip if it was represented by one of these sixteen species.
This defined an additional 4% of the remaining trips. Of the remaining trips (1%) the non-
key species of highest abundance in the catch was used to define the trip. Overall, flounder
was the primary species targeted by gill netters in estuarine waters of North Carolina (
Table
25). Overall landings across all trips for each of the key species are summarized in Table
26.

Table 25. Anchored estuarine gill net trips with the species of highest abundance landed (target
species) being used to define a trip.
Species 2001 2002 2003 2004 2005 2006 Combined (%) cum%
Flounder 19,390 17,779 16,255 16,208 14,402 16,884 100,918 (47) 47
Striped Bass 5,198 5,041 4,965 4,404 4,377 3,363 27,348 (13) 59
Spot 2,105 2,793 2,861 2,847 2,930 1,686 15,222 (7) 66
Striped Mullet 3,149 3,041 2,720 2,035 1,853 1,659 14,457 (7) 73
American Shad 1,327 1,746 1,865 1,556 1,447 1,325 9,266 (4) 77
Menhaden 1,579 1,512 1,647 1,192 1,226 1,725 8,881 (4) 81
Bluefish 1,895 991 1,484 915 1,240 1,063 7,588 (4) 85
White Perch 882 1,111 1,827 968 879 858 6,525 (3) 88
Catfish 1,040 916 831 743 776 1,112 5,418 (3) 90
Red Drum 2,347 356 556 331 599 883 5,072 (2) 93
Speckled Trout 413 820 621 486 411 948 3,699 (2) 94
Spanish Mackerel 685 668 279 308 553 396 2,889 (1) 96
Hickory Shad 801 219 199 619 550 306 2,694 (1) 97
River Herring 341 488 377 314 413 281 2,214 (1) 98
Weakfish 458 330 218 406 321 275 2,008 (1) 99
Sea Mullet 129 92 99 74 67 147 608 (0) 99
Others (37 species) 463 357 279 220 137 199 1,655 (1) 100
Combined 42,202 38,260 37,083 33,626 32,181 33,110 216,462 (100)
Table 26. Annual landings of major species in North Carolina’s anchored estuarine gill net fishery.
Species 2001 2002 2003 2004 2005 2006 Combined
Flounder 1,905,276 1,807,364 1,469,218 1,587,289 1,283,917 1,539,360 9,592,425
Menhaden 1,134,509 791,479 980,822 561,149 865,364 602,951 4,936,272
Striped Mullet 778,261 891,357 709,182 512,018 449,901 377,231 3,717,950
Spot 536,123 675,204 652,932 685,989 728,509 325,141 3,603,898
Bluefish 445,555 256,451 488,170 278,599 368,342 231,817 2,068,932
Striped Bass 226,372 226,705 339,056 295,172 235,708 184,266 1,507,279
American Shad 119,925 238,923 356,303 241,001 179,411 161,248 1,296,812
White Perch 175,525 219,077 404,865 176,027 138,723 106,859 1,221,077
Catfish 155,373 157,399 170,153 125,599 118,345 134,689 861,557
Spanish Mackerel 183,834 199,166 74,470 88,931 178,606 97,679 822,686
Hickory Shad 161,234 44,195 63,388 173,352 169,441 48,963 660,573
Red Drum 129,509 66,335 78,805 44,917 103,648 145,833 569,047
Weakfish 106,464 95,321 69,863 89,238 101,191 74,261 536,339
Speckled Trout 55,038 101,934 96,928 67,850 50,757 114,347 486,854
River Herring 86,164 71,636 82,119 75,920 74,727 36,849 427,414
Sea Mullet 45,656 40,184 38,423 28,907 25,755 54,951 233,877
Once trips were defined, each fishery was then further characterized from
available
fish house sampling and observer data from 2001 to 2006. For each of the sixteen fisheries
defined, information specific to mesh sizes used, yards of net fished, soak times and depths
fished are included (Table 27 and Table 28). Species with similar gear parameters for mesh
size are grouped together into large (>
5 inch) or small (<5 inch) stretch mesh gill net
fisheries. Available information is also separated by region. Regions include: Albemarle
Sound, Core Sound to the South Carolina border, Pamlico and Neuse River, and Pamlico
Sound.
The availability of various species in North Carolina’s estuarine gill net fishery varies
by season. Monthly landings by region for each of the sixteen key species are provided in
Figure 27 and Figure 28.
106

Table 27. Large mesh (>
5 inch) gill net fishery parameters commonly associated with the targeting of various species, 2001-2006.
FLOUNDERS
Region Source (Program)
N
mode
common range
mean min max mean min max mean min max mean min max
All Dependent 1,686 5.50
5.25 - 6.5
5.66 2.88 7.00 1,534 50 6,000 20 4 96 5 1 20
Albemarle Sound Dependent (pgm 461) 293 5.75
5.5 - 6
5.74 3.13 6.50 1,737 200 3,700 26 12 72 9 1 20
Observer (pgm 466) 66 5.50
5.25 - 6
5.59 3.25 6.50 2,109 600 3,000 22 10 48 7 1 20
Core Sound South Dependent (pgm 461) 349 5.50
5.5 - 6
5.63 3.25 7.00 1,949 200 6,000 17 7 48 3 1 12
Observer (pgm 466) 101 5.50
5.5 - 6
5.66 5.25 6.50 1,519 500 3,400 18 11 48 3 1 6
Pamlico/Neuse River Dependent (pgm 461) 543 5.50
5.25 - 5.5
5.46 3.00 7.00 1,176 50 5,333 17 4 72 4 1 18
Observer (pgm 466) 202 5.50
5.25 - 5.5
5.45 3.00 6.00 935 100 3,200 21 4 144 4 1 18
Pamlico Sound Dependent (pgm 461) 501 6.00
5.25 - 6.5
5.83 2.88 7.00 1,411 100 6,000 22 8 96 3 1 10
Observer (pgm 466) 881 6.00
5.5 - 7
5.99 3.00 8.75 1,179 100 3,000 24 2 144 3 <1 13
Gill Net Stretch Mesh Size Effort Data (yards fished) Soak Time (hours) Depth (ft)
STRIPED BASS
Region Source (Program)
N
mode
common range
mean min max mean min max mean min max mean min max
All Dependent 150 5.50
5.5 - 8
5.70 2.50 10.00 657 50 3,000 17 1 36 6 2 15
Albemarle Sound Dependent (pgm 461) 24 5.75 & 8
5.5 - 8
5.90 2.50 10.00 1,009 100 3,000 20 1 24 8 3 15
Observer (pgm 466) 7 5.50
5.50
5.50 5.50 5.50 950 400 2,000 31 24 48 11 6 18
Core Sound South Dependent (pgm 461) - -
-
- - - - - - - - - - - -
Observer (pgm 466) - -
-
- - - - - - - - - - - -
Pamlico/Neuse River Dependent (pgm 461) 111 5.50
5.5 - 7
5.70 5.50 7.00 555 50 1,800 16 12 36 6 2 12
Observer (pgm 466) 6 5.50
5.25 - 6
5.45 5.25 6.00 1,033 600 1,600 22 12 24 6 4 12
Pamlico Sound Dependent (pgm 461) 15 5.75
5.75 - 6
5.30 3.00 6.00 986 400 1,500 21 12 24 6 3 12
Observer (pgm 466) - -
-
- - - - - - - - - - - -
Gill Net Stretch Mesh Size (inches) Effort Data (yards fished) Soak Time (hours) Depth (ft)
RED DRUM
Region Source (Program)
N
mode
common range
mean min max mean min max mean min max mean min max
All Dependent 51 5.50
5.5 - 6
5.30 3.00 6.50 838 100 3,200 17 8 48 3 1 7
Albemarle Sound Dependent (pgm 461) 7 6.00
4.5 - 6
5.63 4.50 6.00 700 100 2,000 16 12 24 3 1 5
Observer (pgm 466) - -
-
- - - - - - - - - - - -
Core Sound South Dependent (pgm 461) 9 5.50
4.5 - 5.75
5.06 3.00 5.75 738 200 3,200 16 12 24 3 2 5
Observer (pgm 466) 3 5.50
5.5 - 5.75
5.56 5.50 5.75 1,033 600 1,600 16 12 24 2 2 4
Pamlico/Neuse River Dependent (pgm 461) 12 5.50
5.25 - 6
5.25 3.25 6.00 750 100 1,400 15 12 24 4 2 4
Observer (pgm 466) 1 5.50
4.5 - 5.5
5.00 4.50 5.50 800 800 800 16 16 16 4 2 7
Pamlico Sound Dependent (pgm 461) 23 6.00
5.5 - 6.25
5.43 3.25 6.50 968 300 3,000 19 8 48 3 1 7
Observer (pgm 466) 14 6.00
4.75 - 6.5
5.76 4.75 6.50 1,016 300 1,700 23 12 48 2 1 4
Gill Net Stretch Mesh Size (inches) Effort Data (yards fished) Soak Time (hours) Depth (ft)
AM SHAD
Region Source (Program)
N
mode
common range
mean min max mean min max mean min max mean min max
All Dependent 208 5.50
5 - 5.5
5.50 3.00 7.00 759 100 2,500 24 12 96 9 1 14
Albemarle Sound Dependent (pgm 461) 18 5.50
5.25 - 5.5
5.37 3.00 7.00 892 300 1,400 49 12 96 9 8 10
Observer (pgm 466) 33 5.50
5.25 - 5.5
5.25 3.00 6.00 786 231 2,400 28 12 96 10 2 21
Core Sound South Dependent (pgm 461) 2 5.25
5.25
5.25 5.25 5.25 300 300 300 18 12 24 4 4 4
Observer (pgm 466) - -
-
- - - - - - - - - - - -
Pamlico/Neuse River Dependent (pgm 461) 179 5.50
5.25 - 5.5
5.56 3.75 7.00 731 100 2,500 22 12 72 9 1 14
Observer (pgm 466) 54 5.50
5 - 6
5.55 5.00 7.00 835 198 3,000 26 12 73 6 2 14
Pamlico Sound Dependent (pgm 461) 9 5.50
5.50
5.29 3.13 6.00 1,217 200 2,000 26 12 48 5 2 6
Observer (pgm 466) - -
-
- - - - - - - - - - - -
Gill Net Stretch Mesh Size (inches) Effort Data (yards fished) Soak Time (hours) Depth (ft)
107

108
Table 27. Continued.
HICKORY SHAD*
Region Source (Program)
N
mode
common range
mean min max mean min max mean min max mean min max
All Dependent 55 5.50
3 - 5.5
4.20 3.00 6.00 1,073 231 3,000 23 12 48 7 1 13
Albemarle Sound Dependent (pgm 461) 1 5.50
2.5 - 5.5
3.67 2.50 5.50 1,150 1,150 1,150 12 12 12 5 5 5
Observer (pgm 466) 8 5.25
3 - 5.5
4.98 3.00 5.50 963 400 1,760 22 12 48 11 8 21
Core Sound South Dependent (pgm 461) 13 3.75
3.25 - 4.0
3.58 3.00 4.00 939 400 1,900 20 12 24 4 2 6
Observer (pgm 466) 2 3.50
3.25 - 3.75
3.60 3.25 5.50 1,000 500 1,500 36 24 48 5 3 6
Pamlico/Neuse River Dependent (pgm 461) 19 5.50
3.75 - 5.5
4.70 3.75 5.50 878 231 1,900 26 12 24 10 5 13
Observer (pgm 466) 9 5.50
4 - 5.5
4.93 4.00 5.50 836 231 1,770 24 12 48 7 3 15
Pamlico Sound Dependent (pgm 461) 22 4.00
3.0 - 4.0
3.96 2.88 6.00 1,365 400 3,000 23 12 48 5 1 10
Observer (pgm 466) 4 3.50
3 - 5.75
4.17 3.00 5.75 763 560 1,150 24 24 24 3 1 5
Gill Net Stretch Mesh Size (inches) Effort Data (yards fished) Soak Time (hours) Depth (ft)
CATFISH
Region Source (Program)
N
mode
common range
mean min max mean min max mean min max mean min max
Albemarle Sound Observer (pgm 466) 12 5.50
3.25 - 5.5
4.68 3.00 5.75 1,338 400 3,000 20 1 48 8 2 18
Core Sound South Observer (pgm 466) 2 5.50
3.25 - 5.5
4.30 3.25 5.50 1,100 900 1,300 36 24 48 3 2 6
Pamlico/Neuse River Observer (pgm 466) 15 5.50
3.25 - 5.5
5.50 5.00 6.00 713 132 2,400 21 10 24 6 3 11
Pamlico Sound Observer (pgm 466) - -
-
- - - - - - - - - - - -
Gill Net Stretch Mesh Size (inches) Effort Data (yards fished) Soak Time (hours) Depth (ft)
Table 28. Small mesh (< 5 inch) gill net fishery parameters commonly associated with the targeting of various species, 2001-2006.
SPOT
Region Source (Program)
N
mode
common range
mean min max mean min max mean min max mean min max
All Dependent 160 3 - 3.25
3 - 3.5
3.46 2.75 8.00 780 100 3,000 17 1 48 6 2 20
Albemarle Sound Dependent (pgm 461) 46 3.25
3.13 - 3.25
3.50 3.00 8.00 715 133 1,600 16 2 24 6 3 10
Observer (pgm 466) 13 3.25
3.0 - 3.25
3.22 3.00 3.75 815 200 1,700 11 1 24 7 2 16
Core Sound South Dependent (pgm 461) 42 3.00
3 - 3.13
3.32 2.75 5.75 544 100 2,500 12 1 24 5 3 20
Observer (pgm 466) - -
-
- - - - - - - - - - - -
Pamlico/Neuse River Dependent (pgm 461) 12 3.00
3 - 3.25
3.57 3.00 5.50 544 200 800 10 2 24 4 3 4
Observer (pgm 466) 6 3.00
2.75 - 3.25
3.50 2.75 5.50 791 400 1,025 18 12 24 4 2 6
Pamlico Sound Dependent (pgm 461) 60 3.00
3 - 3.5
3.54 2.88 6.00 1,091 200 3,000 22 7 48 6 2 13
Observer (pgm 466) 26 3.50
3 - 3.75
4.25 2.87 7.00 1,020 140 2,630 24 2 72 4 1 12
Gill Net Stretch Mesh Size (inches) Effort Data (yards fished) Soak Time (hours) Depth (ft)
STRIPED MULLET
Region Source (Program)
N
mode
common range
mean min max mean min max mean min max mean min max
All Dependent 89 3.75 - 4
3 - 4
4.10 2.88 5.75 818 200 2,600 16 1 48 5 1 17
Albemarle Sound Dependent (pgm 461) 9 3.25
3.25
4.60 3.00 5.75 1,371 500 2,600 27 10 48 8 3 17
Observer (pgm 466) 18 3.25
3 - 3.5
3.71 3.00 5.50 537 100 1,200 10 1 24 5 1 11
Core Sound South Dependent (pgm 461) 10 3.75
3.75 - 4
4.00 3.25 5.50 833 400 1,600 17 12 36 4 3 5
Observer (pgm 466) - -
-
- - - - - - - - - - - -
Pamlico/Neuse River Dependent (pgm 461) 60 4.00
3 - 4
3.70 2.88 6.50 638 200 1,800 11 1 24 4 3 7
Observer (pgm 466) 1 4.00
4
4.75 4.00 5.50 800 800 800 12 12 12 5 4 6
Pamlico Sound Dependent (pgm 461) 10 4.00
3.25 - 4
4.60 3.25 6.50 889 400 1,500 19 12 24 3 1 7
Observer (pgm 466) 44 4.00
3.50 - 4.0
4.02 3.00 6.00 901 55 1,500 26 1 72 3 1 24
Gill Net Stretch Mesh Size (inches) Effort Data (yards fished) Soak Time (hours) Depth (ft)

109
Table 28. Continued.
SPOTTED SEATROUT
Region Source (Program)
N
mode
common range
mean min max mean min max mean min max mean min max
All Dependent 70 4.00
3.5 - 4(+5.5)
4.20 3.00 5.75 1,055 100 2,300 19 3 72 4 3 8
Albemarle Sound Dependent (pgm 461) - -
-
- - - - - - - - - - - -
Observer (pgm 466) - -
-
- - - - - - - - - - - -
Core Sound South Dependent (pgm 461) 6 4.00
3.5 - 4
3.90 3.50 4.00 1,180 400 1,600 17 3 24 4 2 5
Observer (pgm 466) 4 3.75
3.25-3.75(+5.5)
4.00 3.25 5.50 1,175 800 1,500 42 24 48 4 2 6
Pamlico/Neuse River Dependent (pgm 461) 40 4.00
3.5 - 4(+5.5)
4.20 3.00 5.50 988 400 2,000 13 12 24 4 2 7
Observer (pgm 466) 3 5.50
3 - 5.5
4.28 3.00 5.50 840 331 1,400 15 1 24 3 1 5
Pamlico Sound Dependent (pgm 461) 24 4.00
3.75 - 4.75
4.30 3.25 5.76 1,083 100 2,300 27 12 72 4 2 8
Observer (pgm 466) 14 4.00
3.75 - 4.5
4.21 3.50 6.00 1,030 400 1,700 24 16 48 4 2 8
Gill Net Stretch Mesh Size (inches) Effort Data (yards fished) Soak Time (hours) Depth (ft)
BLUEFISH
Region Source (Program)
N
mode
common range
mean min max mean min max mean min max mean min max
All Dependent 161 3.25
2.88 - 3.5
3.70 2.88 6.50 1,036 100 3,900 23 2 48 6 2 17
Albemarle Sound Dependent (pgm 461) 11 3.25
3.13 - 3.25
3.23 3.12 3.25 950 500 1,200 24 12 48 5 3 10
Observer (pgm 466) 1 3.00
3.00
3.00 3.00 3.00 2,000 2,000 2,000 2 1 4 4 2 7
Core Sound South Dependent (pgm 461) 16 3.00
3 - 3.25
3.43 2.88 6.00 1,103 150 2,000 18 12 24 5 3 8
Observer (pgm 466) 1 5.50
5.50
5.50 5.50 5.50 900 900 900 24 24 24 3 3 4
Pamlico/Neuse River Dependent (pgm 461) 2 3.25
3.25
4.38 3.25 5.50 1,700 1,700 1,700 12 12 12 3 3 3
Observer (pgm 466) 3 3.25
3.25
4.25 3.25 6.00 867 200 1,400 11 4 18 5 4 6
Pamlico Sound Dependent (pgm 461) 132 3.25
2.88 - 3.5
3.76 2.88 6.50 1,026 100 3,900 23 2 48 6 2 17
Observer (pgm 466) 37 3.50
3.25 - 4
4.89 3.00 7.00 885 200 2,775 24 12 48 4 1 11
Gill Net Stretch Mesh Size (inches) Effort Data (yards fished) Soak Time (hours) Depth (ft)
WEAKFISH
Region Source (Program)
N
mode
common range
mean min max mean min max mean min max mean min max
All Dependent 36 3.00
2.88 - 3.25
3.30 2.50 6.25 1,307 200 4,000 21 1 48 8 3 14
Albemarle Sound Dependent (pgm 461) 2 3.25
3.25
3.25 2.50 3.25 800 800 800 14 14 14 7 7 7
Observer (pgm 466) 1 3.13
3.13
3.13 3.13 3.13 270 270 270 18 12 24 4 3 5
Core Sound South Dependent (pgm 461) 2 3.00
3 - 4
3.31 3.00 4.00 650 500 800 18 12 24 4 4 5
Observer (pgm 466) - -
-
- - - - - - - - - - - -
Pamlico/Neuse River Dependent (pgm 461) 1 3.00
3.00
3.00 3.00 3.00 200 200 200 12 12 12 7 7 7
Observer (pgm 466) - -
-
- - - - - - - - - - - -
Pamlico Sound Dependent (pgm 461) 31 3.00
2.88 - 3.25
3.34 2.88 6.25 1,408 250 4,000 22 1 48 8 3 14
Observer (pgm 466) 18 3.00
2.88 - 3.75
3.37 2.88 5.75 999 300 2,440 22 3 48 7 2 15
Gill Net Stretch Mesh Size (inches) Effort Data (yards fished) Soak Time (hours) Depth (ft)
MENHADEN
Region Source (Program)
N
mode
common range
mean min max mean min max mean min max mean min max
All Dependent 37 3.00
3 - 3.25
3.60 2.88 4.00 985 200 2,000 22 9 48 7 3 15
Albemarle Sound Dependent (pgm 461) 13 3.25
3.13 - 3.75
3.43 3.00 4.00 844 300 1,500 24 12 48 9 6 12
Observer (pgm 466) 37 5.25
3 - 5.5
4.68 3.00 5.50 829 210 1,965 29 12 72 10 4 22
Core Sound South Dependent (pgm 461) 2 3.13
3 - 3.13
3.06 3.00 3.12 850 200 1,500 18 12 24 5 3 6
Observer (pgm 466) - -
-
- - - - - - - - - - - -
Pamlico/Neuse River Dependent (pgm 461) 6 3.00
3 - 4
3.50 3.00 4.00 567 200 1,000 12 12 12 6 6 6
Observer (pgm 466) 28 5.50
3.25 - 5.5
4.65 3.25 8.00 758 248 1,700 20 2 48 6 2 16
Pamlico Sound Dependent (pgm 461) 16 3.00
3 - 3.25
3.75 2.88 4.00 1,170 200 2,000 23 9 48 7 3 15
Observer (pgm 466) 41 3.50
2.88 - 3.5
3.72 2.87 7.00 721 200 1,955 24 1 72 6 1 15
Gill Net Stretch Mesh Size (inches) Effort Data (yards fished) Soak Time (hours) Depth (ft)

110
Table 28. Continued.
SP MACKEREL
Region Source (Program)
N
mode
common range
mean min max mean min max mean min max mean min max
All Dependent 48 3.50
3.38 - 3.75
3.55 3.00 4.00 1,291 500 2,700 7 2 12 13 6 17
Albemarle Sound Dependent (pgm 461) - -
-
- - - - - - - - - - - -
Observer (pgm 466) - -
-
- - - - - - - - - - - -
Core Sound South Dependent (pgm 461) - -
-
- - - - - - - - - - - -
Observer (pgm 466) - -
-
- - - - - - - - - - - -
Pamlico/Neuse River Dependent (pgm 461) - -
-
- - - - - - - - - - - -
Observer (pgm 466) - -
-
- - - - - - - - - - - -
Pamlico Sound Dependent (pgm 461) 48 3.50
3.38 - 3.75
3.55 3.00 4.00 1,291 500 2,700 7 2 12 13 6 17
Observer (pgm 466) - -
-
- - - - - - - - - - - -
Gill Net Stretch Mesh Size (inches) Effort Data (yards fished) Soak Time (hours) Depth (ft)
WHITE PERCH
Region Source (Program)
N
mode
common range
mean min max mean min max mean min max mean min max
Albemarle Sound Observer (pgm 466) 17 3.25
3 - 3.25
3.77 2.33 5.50 709 100 1,400 28 2 96 10 2 2
Core Sound South Observer (pgm 466) - -
-
- - - - - - - - - - - -
Pamlico/Neuse River Observer (pgm 466) 7 3.25
3.25 - 3.5
3.29 3.25 3.50 667 300 1,050 18 12 24 4 3 6
Pamlico Sound Observer (pgm 466) 6 3.50
3 - 3.5
4.00 3.00 5.75 1,012 450 1,650 28 24 48 4 3 7
Gill Net Stretch Mesh Size (inches) Effort Data (yards fished) Soak Time (hours) Depth (ft)
RIVER HERRING
Region Source (Program)
N
mode
common range
mean min max mean min max mean min max mean min max
Albemarle Sound Observer (pgm 466) 28 3.00
3 - 3.25
3.59 3.00 5.50 694 280 1,590 32 12 72 9 2 17
Core Sound South Observer (pgm 466) - - - - - - - - - - - - - - -
Pamlico/Neuse River Observer (pgm 466) - - - - - - - - - - - - - - -
Pamlico Sound Observer (pgm 466) 5
3 - 3.5
4.04 3.00 5.50 1,390 750 1,700 24 24 24 4 1 8
Gill Net Stretch Mesh Size (inches) Effort Data (yards fished) Soak Time (hours) Depth (ft)
SEA MULLET
Region Source (Program)
N
mode
common range
mean min max mean min max mean min max mean min max
All Dependent 5 2.88 2.88 - 3.5 2.82 3.50 3.50 1,280 200 2,000 13 3 24 11 7 14
Albemarle Sound Dependent (pgm 461) - - - - - - - - - - - - - - -
Core Sound South Dependent (pgm 461) 1 3.50 3.50 3.50 3.50 3.50 200 200 200 3 3 3 7 7 7
Pamlico/Neuse River Dependent (pgm 461) - - - - - - - - - - - - - - -
Pamlico Sound Dependent (pgm 461) 4
2.62 - 3.5
3.00 2.62 3.50 1,550 1,000 2,000 15 12 24 13 12 14
Gill Net Stretch Mesh Size (inches) Effort Data (yards fished) Soak Time (hours) Depth (ft)

111
Flounder - Large Mesh
0%
5%
10%
15%
20%
25%
30%
35%
123456789101112
Month
% of annual landings
Albemarle Sound
Core Sd - South
Pamlico/Neuse River
Pamlico Sound
Red Drum - Large Mesh
0%
2%
4%
6%
8%
10%
12%
14%
16%
18%
20%
123456789101112
Month
% of annual landings
Albemarle Sound
Core Sd - South
Pamlico/Neuse River
Pamlico Sound
Striped Bass - Large Mesh
0%
10%
20%
30%
40%
50%
60%
70%
80%
123456789101112
Month
% of annual landings
Albemarle Sound
Core Sd - South
Pamlico/Neuse River
Pamlico Sound
American Shad - Large Mesh
0%
10%
20%
30%
40%
50%
60%
70%
80%
123456789101112
Month
% of annual landings
Albemarle Sound
Core Sd - South
Pamlico/Neuse River
Pamlic o Sound
Figure 27. Monthly landings by region for common species targeted in the large mesh estuarine gill net fishery.

112
Hickory Shad - Large Mesh
0%
10%
20%
30%
40%
50%
60%
70%
80%
123456789101112
Month
% of annual landings
Albemarle Sound
Core Sd - South
Pamlico/Neuse River
Pamlico Sound
Catfish - Large Mesh
0%
5%
10%
15%
20%
25%
30%
35%
40%
123456789101112
Month
% of annual landings
Albemarle Sound
Core Sd - South
Pamlico/Neuse River
Pamlic o Sound
Figure 27. Continued.
Spot - Small Mesh
0%
10%
20%
30%
40%
50%
60%
70%
123456789101112
Month
% of annual landings
Albemarle Sound
Core Sd - South
Pamlico/Neuse River
Pamlico Sound
Striped Mullet - Small Mesh
0%
5%
10%
15%
20%
25%
30%
35%
40%
123456789101112
Month
% of annual landings
Albemarle Sound
Core Sd - South
Pamlico/Neuse River
Pamlico Sound
Figure 28. Monthly landings by region for common species targeted in the small mesh estuarine gill net fishery.

113
Bluefish - Small Mesh
0%
10%
20%
30%
40%
50%
60%
123456789101112
Month
% of annual landings
Albemarle Sound
Core Sd - South
Pamlico/Neuse River
Pamlico Sound
Spotted Seatrout - Small Mesh
0%
5%
10%
15%
20%
25%
30%
35%
123456789101112
Month
% of annual landings
Albemarle Sound
Core Sd - South
Pamlico/Neuse River
Pamlico Sound
Weakfish - Small Mesh
0%
5%
10%
15%
20%
25%
30%
35%
40%
45%
123456789101112
Month
% of annual landings
Albemarle Sound
Core Sd - South
Pamlico/Neuse River
Pamlico Sound
Menhaden - Small Mesh
0%
10%
20%
30%
40%
50%
60%
123456789101112
Month
% of annual landings
Albemarle Sound
Core Sd - South
Pamlico/Neuse River
Pamlico Sound
Figure 28. Continued

114
Spanish Mackerel - Small Mesh
0%
10%
20%
30%
40%
50%
60%
123456789101112
Month
% of annual landings
Albemarle Sound
Core Sd - South
Pamlico/Neuse River
Pamlico Sound
White Perch - Small Mesh
0%
10%
20%
30%
40%
50%
60%
70%
80%
123456789101112
Month
% of annual landings
Albemarle Sound
Core Sd - South
Pamlico/Neuse River
Pamlico Sound
Sea Mullet - Small Mesh
0%
10%
20%
30%
40%
50%
60%
123456789101112
Month
% of annual landings
Albemarle Sound
Core Sd - South
Pamlico/Neuse River
Pamlico Sound
River Herring - Small Mesh
0%
10%
20%
30%
40%
50%
60%
123456789101112
Month
% of annual landings
Albemarle Sound
Pamlico/Neuse River
Pamlic o Sound
Figure 28. Continued.

2) Conduct at sea samples to estimate dead red drum discards from gill nets
North Carolina observer data were used to estimate discards of dead red drum from the
estuarine gill net f
ishery. Available observer coverage was for the period of 2001 to 2006 (Table
29). Data from 2001 to 2003 were exclusively from the Pamlico Sound gill net fishery in the fall.
Due to this lim
ited coverage, annual coast wide estimates for these years were not attempted.
Table 29. Observed estuarine gill net trips by month and year from the North Carolina observer
program
.
Month 2001 2002 2003 2004 2005 2006
January 0 0 0 5 7 22
February 0 0 0 14 34 40
March 0 0 0 36 45 45
April 0 0 0 28 35 34
May 0 0 0 48 31 26
June 0 0 0 512726
July 0 0 0 302214
August 0 0 0 253812
September 29 69 34 91 56 61
October 707352967792
November 66 32 25 58 63 30
December 14 5 7 21 6 0
Total 179 179 118 503 441 402
Available data from 2004 to 2006 were separated by region as described in the previous
section and included: Albem
arle Sound, Pamlico Sound, Pamlico/Neuse River, and Core Sound to
the South Carolina border. In addition, available data were further partitioned into seasons. Seasons
were selected based on several criteria that included: months with similar mean water temperatures,
peak landings for major fisheries, and periods where small mesh gill net attendance was required.
The seasons selected were: January through April; May through August; September through
October; and November through December.
Observed trips, in the same manner as was done for the trip ticket data, used the species of
highest abundance in the catch to define the trip. A catch per unit effort (CPUE) was then generated
for discarded dead red drum
. The CPUE was defined as the number (or weight) of dead red drum
discarded per trip. Estimates of discards were then calculated by multiplying the number of trips
taken in a particular fishery by the corresponding CPUE from the observer data. Initial analysis
attempted to generate CPUE’s by fishery, season and region; however data were not sufficient at this
level. Observed trips were then collapsed into large (>
5 inch stretch mesh) or small (<5 inch stretch
mesh) mesh gill net fishery groupings in an attempt to fill data gaps. CPUE was generated by year,
region and season where at least 10 trips were observed. Collapsing across regions by season then
filled remaining data gaps for each year. For the small mesh estimates, low sample sizes required
additional collapsing across region and season by year.
115

Estimates of dead red drum discards from 2004 to 2006 in the large mesh estuarine gill net
fishery ranged from 12,393 lbs in 2004 to 54,143 lbs in 2005 (Table 30). Dead discards from small
m
esh gill nets ranged from 3,042 lbs in 2004 to 5,570 lbs in 2006 (Table 31). Results of this
analysis should be viewed with caution as bycatch associated with various fisheries can vary
drastically. The num
ber of observed trips for each of the key fisheries was inadequate to allow for
estimates by a single fishery. After collapsing across key fisheries, samples in the large mesh
fishery were much better represented by region and season than were the samples for the small mesh
fishery. Small mesh observer trips were not adequate for analysis by region and season. Most of the
data was collapsed across both regions and seasons to provide a single CPUE by year. For this
reason, small mesh estimates in particular should be viewed with caution.
Combined estimates from the small and large mesh fishery were as follows: 15,435 lb in
2004; 58,950 lb in 2005; and 32,676 lb in 2006. These values represent 29%, 46% and 19% of the
annual com
mercial harvest in 2004, 2005 and 2006.
3) Estimate the dead red drum discards resulting from the release mortality associated
with gill nets
Estimated red drum discards from the commercial estuarine gill net fishery are based on red
drum
observed to be dead at the time the gear is fished and do not account for any mortality
associated with red drum released alive at the net. In the red drum stock assessment a 10 percent
mortality is assumed for all red drum released in the recreational fishery. This estimate is based on
hook and line studies where red drum have been captured using techniques common to the
recreational fishery and then held for a short period to determine the short-term mortality associated
with catch and release. From 1999 to 2000, the NCDMF conducted studies to determine the short-
term mortality associated with the release of red drum from estuarine gill nets. During this study,
delayed mortality estimates were conducted separately for small (<
4 ½ inch) and large (> 5 inch)
stretch mesh gill nets (Price and Gearhart 2002a; Price and Gearhart 2002b). Red drum were held
(72 hours) in pens to determine the short-term mortality. Results varied by mesh size. For small
mesh nets the overall delayed mortality averaged 3% while large mesh mortality was significantly
higher averaging 33%. Discrepancies in these values were attributed to the low sample size of red
drum captured in the large mesh nets (n = 18) relative to the small mesh nets (n = 1,236). Additional
work should be conducted in this area to provide more reliable estimates.
The magnitude of mortality associated with release from estuarine gill nets was estimated
using an interm
ediate release mortality of 10%. Estimates were calculated in the same manner as
previously used to estimate dead red drum discards occurring at the net. The one exception being
that the CPUE was defined as the number (or weight) of red drum released per trip. This number
was then multiplied by 10% to determine the total release mortality. CPUE was generated by year,
region and season where at least 10 trips were observed. Collapsing across regions for each season
then filled remaining data gaps for each year. For the small mesh estimates low sample sizes
required additional collapsing across region and season by year.
Estimated release mortalities from 2004 to 2006 in the large mesh estuarine gill net fishery
ranged from
2,613 lb in 2004 to 6,229 lb in 2005 (Table 32). For the small mesh gill net fishery,
estim
ates were lower ranging from 1,005 lb in 2004 to 2,222 lb in 2005 (Table 33).
116

Table 30. Estimated dead discards (number and weight) of red drum from the large mesh estuarine gill
net fishery.
2004
Season # trips
# trips
observed
% coverage CPUE (#) CPUE (lbs) exp_num exp_wt
Albemarle Sound Jan-Apr 5,755 30 0.5% 0.00 0.00 - -
May-Aug 2,371 41 1.7% 0.00 0.00 - -
Sep-Oct 1,838 5 0.3% 0.78 1.30 1,434 2,389
Nov-Dec 1,037 4 0.4% 0.25 0.28 259 290
Core Sound South Jan-Apr 504 0 0.0% 0.02 0.04 10 20
May-Aug 2,273 1 0.0% 0.26 0.38 591 864
Sep-Oct 1,098 27 2.5% 1.96 3.26 2,152 3,579
Nov-Dec 230 2 0.9% 0.25 0.28 58 64
Pamlico/Neuse River Jan-Apr 1,422 21 1.5% 0.05 0.10 68 142
May-Aug 1,477 67 4.5% 0.27 0.24 399 354
Sep-Oct 930 22 2.4% 0.00 0.00 - -
Nov-Dec 330 17 5.2% 0.00 0.00 - -
Pamlico Sound Jan-Apr 503 0 0.0% 0.02 0.04 10 20
May-Aug 2,220 36 1.6% 0.39 1.15 866 2,553
Sep-Oct 1,646 110 6.7% 0.69 1.18 1,136 1,942
Nov-Dec 354 27 7.6% 0.44 0.49 156 173
Combined 23,988 410 1.7% 7,138 12,393
2005
Season # trips
# trips
observed
% coverage CPUE (#) CPUE (lbs) exp_num exp_wt
Albemarle Sound Jan-Apr 4,640 11 0.2% 0.00 0.00 - -
May-Aug 1,654 7 0.4% 0.48 1.06 794 1,753
Sep-Oct 2,216 0 0.0% 1.82 6.53 4,033 14,470
Nov-Dec 1,458 0 0.0% 0.54 1.46 787 2,129
Core Sound South Jan-Apr 458 0 0.0% 0.44 0.72 202 330
May-Aug 2,008 14 0.7% 1.50 2.50 3,012 5,020
Sep-Oct 1,225 2 0.2% 1.82 6.53 2,230 7,999
Nov-Dec 226 2 0.9% 0.54 1.46 122 330
Pamlico/Neuse River Jan-Apr 1,410 41 2.9% 0.22 0.61 310 860
May-Aug 1,671 57 3.4% 0.25 0.63 418 1,053
Sep-Oct 810 2 0.2% 1.82 6.53 1,474 5,289
Nov-Dec 172 3 1.7% 0.54 1.46 93 251
Pamlico Sound Jan-Apr 483 3 0.6% 0.44 0.72 213 348
May-Aug 1,771 18 1.0% 0.61 1.73 1,080 3,064
Sep-Oct 1,721 125 7.3% 1.74 6.29 2,995 10,825
Nov-Dec 327 46 14.1% 0.50 1.29 164 422
Combined 22,250 331 1.5% 17,925 54,143
2006
Season # trips
# trips
observed
% coverage CPUE (#) CPUE (lbs) exp_num exp_wt
Albemarle Sound Jan-Apr 4,631 26 0.6% 0.23 0.22 1,065 1,019
May-Aug 2,582 0 0.0% 0.30 0.76 775 1,962
Sep-Oct 2,625 0 0.0% 0.72 2.42 1,890 6,353
Nov-Dec 1,100 0 0.0% 0.19 0.56 209 616
Core Sound South Jan-Apr 396 0 0.0% 0.12 0.12 48 48
May-Aug 2,466 27 1.1% 0.33 0.99 814 2,441
Sep-Oct 1,390 1 0.1% 0.72 2.42 1,001 3,364
Nov-Dec 156 0 0.0% 0.19 0.56 30 87
Pamlico/Neuse River Jan-Apr 1,214 24 2.0% 0.00 0.00 - -
May-Aug 1,574 23 1.5% 0.00 0.00 - -
Sep-Oct 904 0 0.0% 0.72 2.42 651 2,188
Nov-Dec 160 0 0.0% 0.19 0.56 30 90
Pamlico Sound Jan-Apr 588 2 0.3% 0.12 0.12 71 71
May-Aug 2,065 13 0.6% 0.92 1.98 1,900 4,089
Sep-Oct 1,915 144 7.5% 0.73 2.43 1,396 4,653
Nov-Dec 217 25 11.5% 0.20 0.58 43 126
Combined 23,983 285 1.2%
9,922 27,106
Collapsed across region by season where n<10
117

Table 31. Estimated dead discards (number and weight) of red drum from the small mesh estuarine
gill net fishery.
2004
Season # trips
# trips
observed
% coverage CPUE (#) CPUE (lbs) exp_num exp_wt
Albemarle Sound Jan-Apr 2,175 19 0.9% 0.00 0.00 - -
May-Aug 647 5 0.8% 0.09 0.23 58 149
Sep-Oct 288 3 1.0% 0.26 0.86 75 248
Nov-Dec 187 2 1.1% 0.13 0.18 23 34
Core Sound South Jan-Apr 418 0 0.0%
0.09 0.23 38 96
May-Aug 454 0 0.0% 0.09 0.23 41 104
Sep-Oct 962 0 0.0% 0.26 0.86 250 827
Nov-Dec 427 0 0.0% 0.13 0.18 53 77
Pamlico/Neuse River Jan-Apr 475 5 1.1%
0.09 0.23 43 109
May-Aug 185 1 0.5%
0.09 0.23 17 43
Sep-Oct 72 1 1.4% 0.26 0.86 19 62
Nov-Dec 164 2 1.2% 0.13 0.18 21 30
Pamlico Sound Jan-Apr 1,199 5 0.4% 0.09 0.23 108 276
May-Aug 797 2 0.3%
0.09 0.23 72 183
Sep-Oct 584 12 2.1% 0.35 1.15 204 672
Nov-Dec 604 20 3.3% 0.15 0.22 91 133
Combined All 9,638 77 0.8%
1,112 3,042
2005
Season # trips
# trips
observed
% coverage CPUE (#) CPUE (lbs) exp_num exp_wt
Albemarle Sound Jan-Apr 2,068 31 1.5% 0.10 0.11 207 227
May-Aug 1,013 9 0.9% 0.32 0.55 324 557
Sep-Oct 240 0 0.0% 0.22 0.32 53 77
Nov-Dec 193 1 0.5% 0.40 0.53 77 102
Core Sound South Jan-Apr 224 0 0.0% 0.14 0.20 31 44
May-Aug 306 0 0.0% 0.32 0.55 98 168
Sep-Oct 607 0 0.0%
0.22 0.32 134 194
Nov-Dec 423 1 0.2% 0.40 0.53 169 224
Pamlico/Neuse River Jan-Apr 609 18 3.0% 0.06 0.05 37 30
May-Aug 172 3 1.7% 0.32 0.55 55 95
Sep-Oct 108 0 0.0% 0.22 0.32 24 35
Nov-Dec 171 0 0.0% 0.40 0.53 68 91
Pamlico Sound Jan-Apr 1,421 16 1.1% 0.31 0.52 441 739
May-Aug 1,444 10 0.7% 0.70 1.22 1,011 1,762
Sep-Oct 327 4 1.2% 0.22 0.32 72 105
Nov-Dec 605 18 3.0% 0.44 0.59 266 357
Combined All 9,931 111 1.1% 3,066 4,807
2006
Season # trips
# trips
observed
% coverage CPUE (#) CPUE (lbs) exp_num exp_wt
Albemarle Sound Jan-Apr 1,325 44 3.3% 0.18 0.21 239 278
May-Aug 638 2 0.3% 0.20 0.33 126 211
Sep-Oct 292 0 0.0% 0.57 1.69 166 493
Nov-Dec 256 0 0.0% 0.25 0.28 64 72
Core Sound South Jan-Apr 169 2 1.2% 0.18 0.24 30 41
May-Aug 196 2 1.0% 0.20 0.33 39 65
Sep-Oct 950 0 0.0% 0.57 1.69 542 1,606
Nov-Dec 508 0 0.0% 0.25 0.28 127 142
Pamlico/Neuse River Jan-Apr 691 15 2.2% 0.00 0.00 - -
May-Aug 221 1 0.5%
0.20 0.33 44 73
Sep-Oct 222 1 0.5% 0.57 1.69 127 375
Nov-Dec 288 0 0.0% 0.25 0.28 72 81
Pamlico Sound Jan-Apr 1,200 16 1.3% 0.38 0.59 456 708
May-Aug 1,053 1 0.1% 0.20 0.33 211 347
Sep-Oct 543 6 1.1% 0.57 1.69 310 918
Nov-Dec 575 4 0.7% 0.25 0.28 144 161
Combined All 9,127 94 1.0% 2,694 5,570
Collapsed across region by season where n<10
Collapsed across region and season by year
118

Table 32. Estimated release mortalities (number and weight) of red drum from the large mesh
estuarine gill net fishery.
2004
Season # trips
# trips
observed
% coverage CPUE (#) CPUE (lbs)
(10%)
exp_num
(10%)
exp_wt
Albemarle Sound Jan-Apr 5,755 30 0.5% 0.00 0.00 - -
May-Aug 2,371 41 1.7% 0.00 0.00 - -
Sep-Oct 1,838 5 0.3% 1.64 2.93 301 539
Nov-Dec 1,037 4 0.4% 1.59 3.04 165 315
Core Sound South Jan-Apr 504 0 0.0% 0.99 1.66 50 84
May-Aug 2,273 1 0.0% 0.37 0.28 84 64
Sep-Oct 1,098 27 2.5% 2.85 4.49 313 493
Nov-Dec 230 2 0.9% 1.59 3.04 37 70
Pamlico/Neuse River Jan-Apr 1,422 21 1.5% 0.00 0.00 - -
May-Aug 1,477 67 4.5% 0.46 0.32 68 47
Sep-Oct 930 22 2.4% 0.64 0.96 60 89
Nov-Dec 330 17 5.2% 0.47 0.70 16 23
Pamlico Sound Jan-Apr 503 0 0.0% 0.99 1.66 50 83
May-Aug 2,220 36 1.6% 0.56 0.48 124 107
Sep-Oct 1,646 110 6.7% 1.68 3.20 277 526
Nov-Dec 354 27 7.6% 2.44 4.89 86 173
Combined 23,988 410 1.7% 1,630 2,613
2005
Season # trips
# trips
observed
% coverage CPUE (#) CPUE (lbs)
(10%)
exp_num
(10%)
exp_wt
Albemarle Sound Jan-Apr 4,640 11 0.2% 0.14 0.40 65 185
May-Aug 1,654 7 0.4% 0.73 1.22 121 202
Sep-Oct 2,216 0 0.0% 2.15 5.55 476 1,230
Nov-Dec 1,458 0 0.0% 1.65 4.01 241 585
Core Sound South Jan-Apr 458 0 0.0% 1.69 2.20 77 101
May-Aug 2,008 14 0.7% 3.14 5.49 631 1,102
Sep-Oct 1,225 2 0.2% 2.15 5.55 263 680
Nov-Dec 226 2 0.9% 1.65 4.02 37 91
Pamlico/Neuse River Jan-Apr 1,410 41 2.9% 0.80 1.39 113 196
May-Aug 1,671 57 3.4% 0.32 0.44 53 74
Sep-Oct 810 2 0.2% 2.15 5.55 174 450
Nov-Dec 172 3 1.7% 1.65 4.02 28 69
Pamlico Sound Jan-Apr 483 3 0.6% 1.69 2.20 82 106
May-Aug 1,771 18 1.0% 0.39 0.72 69 128
Sep-Oct 1,721 125 7.3% 2.18 5.68 375 978
Nov-Dec 327 46 14.1% 1.15 1.66 38 54
Combined 22,250 331 1.5% 2,844 6,229
2006
Season # trips
# trips
observed
% coverage CPUE (#) CPUE (lbs)
(10%)
exp_num
(10%)
exp_wt
Albemarle Sound Jan-Apr 4,631 26 0.6% 0.23 0.27 107 125
May-Aug 2,582 0 0.0% 0.38 0.52 98 134
Sep-Oct 2,625 0 0.0% 1.43 2.76 375 725
Nov-Dec 1,100 0 0.0% 1.23 1.83 135 201
Core Sound South Jan-Apr 396 0 0.0% 0.20 0.32 8 13
May-Aug 2,466 27 1.1% 0.19 0.28 47 69
Sep-Oct 1,390 1 0.1% 1.43 2.76 199 384
Nov-Dec 156 0 0.0% 1.23 1.83 19 29
Pamlico/Neuse River Jan-Apr 1,214 24 2.0% 0.17 0.40 21 49
May-Aug 1,574 23 1.5% 0.26 0.23 41 36
Sep-Oct 904 0 0.0% 1.43 2.76 129 250
Nov-Dec 160 0 0.0% 1.23 1.83 20 29
Pamlico Sound Jan-Apr 588 2 0.3% 0.20 0.32 12 19
May-Aug 2,065 13 0.6% 1.15 1.78 237 368
Sep-Oct 1,915 144 7.5% 1.42 2.77 272 530
Nov-Dec 217 25 11.5% 1.28 1.90 28 41
Combined 23,983 285 1.2% 1,747 3,001
Collapsed across region by season where n<10
119

Table 33. Estimated release mortalities (number and weight) of red drum from the
small mesh estuarine gill net fishery.
2004 Season # trips
# trips
observed
% coverage CPUE (#) CPUE (lbs)
(10%)
exp_num
(10%)
exp_wt
Albemarle Sound Jan-Apr 2,175 19 0.9% 0.00 0.00 - -
May-Aug 647 5 0.8% 0.25 0.19 16 12
Sep-Oct 288 3 1.0% 1.72 2.12 50 61
Nov-Dec 187 2 1.1% 2.08 3.05 39 57
Core Sound South Jan-Apr 418 0 0.0% 0.03 0.31 1 13
May-Aug 454 0 0.0% 0.25 0.19 11 9
Sep-Oct 962 0 0.0% 1.72 2.12 165 204
Nov-Dec 427 0 0.0% 2.08 3.05 89 130
Pamlico/Neuse River Jan-Apr 475 5 1.1% 0.03 0.31 1 15
May-Aug 185 1 0.5% 0.25 0.19 5 4
Sep-Oct 72 1 1.4% 1.72 2.12 12 15
Nov-Dec 164 2 1.2% 2.08 3.05 34 50
Pamlico Sound Jan-Apr 1,199 5 0.4% 0.03 0.31 4 37
May-Aug 797 2 0.3% 0.25 0.19 20 15
Sep-Oct 584 12 2.1% 2.29 2.83 134 165
Nov-Dec 604 20 3.3% 2.45 3.61 148 218
Combined 9,638 77 0.8% 729 1,005
2005
Season # trips
# trips
observed
% coverage CPUE (#) CPUE (lbs)
(10%)
exp_num
(10%)
exp_wt
Albemarle Sound Jan-Apr 2,068 31 1.5% 0.16 0.11 33 23
May-Aug 1,013 9 0.9% 0.41 0.72 42 73
Sep-Oct 240 0 0.0% 0.25 0.25 6 6
Nov-Dec 193 1 0.5% 1.10 1.71 21 33
Core Sound South Jan-Apr 224 0 0.0% 0.82 1.01 18 23
May-Aug 306 0 0.0% 0.41 0.72 13 22
Sep-Oct 607 0 0.0% 0.25 0.25 15 15
Nov-Dec 423 1 0.2% 1.10 1.71 47 72
Pamlico/Neuse River Jan-Apr 609 18 3.0% 0.22 0.28 13 17
May-Aug 172 3 1.7% 0.41 0.72 7 12
Sep-Oct 108 0 0.0% 0.25 0.25 3 3
Nov-Dec 171 0 0.0% 1.10 1.71 19 29
Pamlico Sound Jan-Apr 1,421 16 1.1% 2.75 3.58 391 509
May-Aug 1,444 10 0.7% 0.90 1.59 130 230
Sep-Oct 327 4 1.2% 0.25 0.25 8 8
Nov-Dec 605 18 3.0% 1.22 1.90 738 1,147
Combined 9,931 111 1.1% 1,503 2,222
2006
Season # trips
# trips
observed
% coverage CPUE (#) CPUE (lbs)
(10%)
exp_num
(10%)
exp_wt
Albemarle Sound Jan-Apr 1,325 44 3.3% 0.59 0.80 78 106
May-Aug 638 2 0.3% 0.73 1.05 47 67
Sep-Oct 292 0 0.0% 0.71 0.69 21 20
Nov-Dec 256 0 0.0% 1.25 2.59 32 66
Core Sound South Jan-Apr 169 2 1.2% 0.76 1.09 13 18
May-Aug 196 2 1.0% 0.73 1.05 14 21
Sep-Oct 950 0 0.0% 0.71 0.69 67 66
Nov-Dec 508 0 0.0% 1.25 2.59 64 132
Pamlico/Neuse River Jan-Apr 691 15 2.2% 0.40 0.49 28 34
May-Aug 221 1 0.5% 0.73 1.05 16 23
Sep-Oct 222 1 0.5% 0.71 0.69 16 15
Nov-Dec 288 0 0.0% 1.25 2.59 36 75
Pamlico Sound Jan-Apr 1,200 16 1.3% 1.75 2.74 210 329
May-Aug 1,053 1 0.1% 0.73 1.05 77 111
Sep-Oct 543 6 1.1% 0.71 0.69 39 37
Nov-Dec 575 4 0.7% 1.25 2.59 72 149
Combined 9,127 94 1.0% 828 1,268
Collapsed across region by season where n<10
120
4) Collect data on the harvest and releases of red drum captured in gill nets under the
Recreational Commercial Gear License.
Commercial fishing gears such as gill nets, crab pots and shrimp trawls have been used for
recreational purposes in the coastal w
aters of North Carolina for many years. To participate in these
activities the user must possess a Recreational Commercial Gear License (RCGL) that entitles the
individual to use limited amounts of commercial gear to catch fish for personal consumption but
does not allow for the sale of the catch.
The North Carolina Division of Marine Fisheries License and Statistics Section initiated a
survey project in March 2002 to collect catch and effort data from
RCGL holders. Questionnaires
are mailed to 30% of all RCGL holders each month requesting that they indicate waterbodies
commonly fished, types and amounts of gear used, number and weight of individual species kept,
and number of individual species discarded at sea.
Survey Design
The monthly and bimonthly survey questionnaires were designed to determine the number of trips
taken and quantities of gear used. Participants are also requested to provide estimates for the
numbers and pounds of each species caught and retained as well as the number of each species
discarded.
The sampling universe of RCGL holders for the monthly surveys includes all individuals
who purchased a license within a year prior of each m
onth sampled. SAS® PROC
SURVEYSELECT is used to randomly select a sample of the population at a 30.0% coverage rate
by county of residence, resulting in a mailing of 1,200 to 2,000 questionnaires, depending on the
number of active licenses during each sample period.
Effort and Catch Extrapolation Methods
To estimate the total number of trips taken by all RCGL holders, the monthly survey data are
extrapolated for each sample period and gear combination by:
1) Calculating the level of participation by dividing the total number of participants actively
using a
specific gear by the total number of returned questionnaires,
2) Calculating the mean number of trips taken by the participants indicating actively using a
specific gear and
3) Estimating the effort using the mean number of trips, level of participation, and the total
num
ber of RCGL holders for the given sample period.
Determination of the estimated catch for each species is also calculated for each sample period
and gear level by:
1. Summing the total catch by species, sample period and gear combination,
2. Summing the total number of trips taken by sample period and gear combination,
121

3. Dividing total catch by the total number of trips to determine the mean catch for each
species for every sample period and gear combination and
4. Calculating the catch estimate using the product of the mean catch and the estimated effort.
Red drum discards from RCGL gill nets were estimated for both small and large mesh gill
nets separately from 2002 to 2006. Information on the disposition of the red drum released from
RCGL gill nets was not available. Small mesh gill nets used under the RCGL require full time
attendance. Large mesh gill nets used under the RCGL can be left unattended from one hour before
sunset to one hour after sunrise north of the Emerald Isle Bridge (HWY 58) in Carteret County but
must be attended at all times south of this bridge to the South Carolina line. A maximum of 100
yards of gill net per license holder up to 200 yards of gill net per vessel can be fished. Although the
mortality associated with the use of this gear is unknown, the limited yardage and attendance
requirements should reduce the potential for excessive mortality.
Estimated red drum landings and discards from RCGL gill nets are summarized in Table 34.
Table 34. Estimated number and pounds of red drum harvested and the number of red drum
discarded using the Recreational Com
mercial Gear License in North Carolina.
Year Gear
Expanded
Trips
Actual Numbe
r
Observations
Kept
(number)
Kept
(pound)
Discard*
(number)
2002 Large Mesh Gill Nets 4,599 98 2,598 8,413 2,791
Small Mesh Gill Nets 789 26 441 1,480 1,252
All 5,388 124 3,039 9,893 4,043
2003 Large Mesh Gill Nets 1,645 47 738 2,746 818
Small Mesh Gill Nets 976 28 386 1,499 777
All 2,621 75 1,124 4,245 1,595
2004 Large Mesh Gill Nets 2,389 47 538 1,927 1,897
Small Mesh Gill Nets 1,304 40 791 2,605 1,735
All 3,693 87 1,329 4,532 3,632
2005 Large Mesh Gill Nets 2,647 85 1,166 4,879 1,601
Small Mesh Gill Nets 1,572 54 672 2,748 1,777
All 4,219 139 1,838 7,627 3,378
2006 Large Mesh Gill Nets 1,783 70 843 3,619 979
Small Mesh Gill Nets 1,719 72 1,000 3,941 6,655
All 3,502 142 1,843 7,560 7,634
*discard estimates include both live and dead red drum
In order to estimate the potential dead discards from the RCGL large mesh gill net fishery,
the ratio of
dead to live releases was calculated from the commercial observer data from 2004 to
2006. Only trips with a soak time of less than 12 hours were used to correspond with the attendance
requirement during the day. Of all red drum discarded, 33% were discarded dead. The mean weight
122

of individual red drum discarded dead was also calculated from the commercial observer data to
allow for annual discard estimates by weight to be calculated. The mean weight of an individual
discarded dead red drum by year was 1.74 lb in 2004; 3.02 lb in 2005; and 2.73 lb in 2006. Based
on this analysis, dead discards from the large mesh RCGL gill nets accounted for between 882 lb
and 1,596 lb of red drum discards per year (Table 35).
Table 35. Estimated dead discards from large mesh RCGL gill nets.
Year
Dead Discards (number) Dead Discards (weight)
2004 626 1,089
2005 528 1,596
2006 323 882
Estimates of dead red drum discards from attended small mesh RCGL gill nets were not
calculated due to the lack of inform
ation on the fate of discarded red drum in this fishery.
Commercial observer data had zero mortalities from small mesh trips where the soak time was less
than two hours. Low gillnet mortality in attended nets is consistent with the findings of Thorpe et al.
(2001). This study characterized the mortality associated with various types of estuarine gill net
fisheries in southeastern North Carolina. They reported a 0% acute mortality for red drum discarded
in the run-around spotted seatrout fishery, as well as in the small mesh RCGL gill net fishery and a
2.2% acute mortality for red drum taken in the run-around gill net striped mullet fishery. Short soak
times, actively fishing gear, and limited yardage appear to be an effective way of minimizing discard
mortality.
Summary of Discard Estimates
Available data on red drum discard mortality are summarized below in both pounds and
num
bers. The summary includes estimates from anchored estuarine gill nets for both commercial
and RCGL users. Estimated pounds of dead discards from the anchored estuarine gill net fishery
represented between 20% and 39% of the total removals from the population by this gear between
the years 2004 and 2006 (
Table 36). Expressed as the number of fish removed from the population,
dead discards represented betw
een 50% and 55% of all removals by anchored estuarine gill nets
during 2004 and 2005 (
Table 37). Total harvest numbers were derived from the catch at age in the
stock assessm
ent so no values were available for 2006. Discard (release) mortality represents a large
portion of the overall annual removals from the red drum population in both the recreational and
commercial fishery. In 2004 and 2005, dead discards from the recreational fishery represented
between 38% and 39% of the total recreational removals (harvest + dead discards) by number (
Table
38). Currently, the assessment only accounts for the recreational removals and no estimates have
been available in the com
mercial fishery. Based on this analysis, the stock assessment failed to
account for between 14% and 18% of all annual removals from the population in 2004 and 2005.
123

Table 36. Summary of all estimated discard mortalities in pounds associated with the anchored
estuarine gill net fishery.
Recreational
Large Mesh
Gill Net
Dead
Discards
(lbs)*
Total
Discard
Mortalities
(lbs)
Harvest from
Anchored
Estuarine Gill
Nets (lbs)**
Year Small Mesh Large Mesh Small Mesh Large Mesh Large Mesh All % Dead Discard % Harvested
2004 3,042 12,393 1,005 2,613 1,089 20,142
46,844
30% 70%
2005 4,807 54,143 2,222 6,229 1,596 68,997
108,527
39% 61%
2006 5,570 27,106 1,268 3,001 882 37,827
149,452
20% 80%
*no estimates for releases recreational small mesh gill nets
**includes commercial and recreational harvest by anchored estuarine gill nets
Anchored Estuarine Gill
Net Dead Discards (lbs)
Anchored Estuarine Gill
Net Mortality from
Releases (lbs)
Proportion of Total Removals
(lbs)
Table 37. Summary of all estimated discard mortalities in numbers associated with the anchored estuarine
gill net f
ishery.
Recreational
Large Mesh
Gill Net
Mortalities
(#'s)*
Total
Discard
Mortalities
(#'s)
Harvest from
Anchored
Estuarine Gill
Nets (#'s)**
Year Small Mesh Large Mesh Small Mesh Large Mesh Large Mesh All % Dead Discard % Harvested
2004 1,112 7,138 729 1,630 626 11,235 9,159 55% 45%
2005 3,066 17,925 1,503 2,844 528 25,866 25,727 50% 50%
*no estimates for releases recreational small mesh gill nets
**includes commercial and recreational harvest by anchored estuarine gill nets
Anchored Estuarine Gill
Net Dead Discards (#'s)
Anchored Estuarine Gill
Net Mortality from
Releases (#'s)
Proportion of Total Removals
(#'s)
Table 38. Estimated total takes from the red drum population by year from the recreational
hook and line fishery.
Year % Dead Discard % Harvested
2004 19,159 30,165 39% 61%
2005 32,786 53,154 38% 62%
Note: all values reported are in numbers of fish.
Proportion of Total Removals
Harvest
Discard Mortality
(10% of Releases)
124

Is it possible to eliminate or reduce the bycatch of unmarketable red drum in the
estuarine gill net fishery?
Understanding the habitat use of sub-legal red drum is a key factor in the successful
management of red drum and is critical if management options can be developed to effectively
reduce bycatch. The NCDMF began an independent gill net survey (IGNS) in Pamlico Sound in
2001. The program was expanded to include the Pamlico, Pungo, and Neuse Rivers in 2003. A
major objective of this study was to provide a relative index of abundance for key species, including
red drum. A secondary objective was to look at habitat usage and associated catch rates of various
species. Information gathered from this program should provide insight on habitat use of red drum,
as well as ways to avoid red drum bycatch in the estuarine gill net fishery.
The IGNS utilized a stratified random sampling design where locations were selected based
on strata and depth (Figure 29). Sampling was divided into four regions: eastern Pamlico Sound
[Dare County (includes Outer Banks Dare and Hyde)], western Pam
lico Sound [Hyde County
(includes mainland Hyde County)], Neuse River, and Pamlico/Pungo River. Each of these sampling
regions was further divided into four evenly sized strata. A one-minute by one-minute (one square
nautical mile) grid system was laid over each stratum. Each stratum was sampled twice monthly. A
sample consisted of two shots of gill net and shots were made up of an array of panels, with each
panel being 30 yards in length. Panels varied in mesh size ranging from 3 to 6 ½ inches stretch
mesh by ½ inch intervals. For each sample, one shot was placed in deep (>
6 ft) and one shot was
placed in shallow (<6 ft) water for a total of 480 yards of gill net fished. Gill nets were set at dusk
and fished the following morning with a target soak time of 12 hours. Nets set close to shore were
either set perpendicular or parallel based on conditions and common fishing practice in the area.
Individual species captured were enumerated, measured and condition of fish at capture was
recorded (alive, dead or spoiled). Pertinent environm
ental data such as: salinity, temperature,
dissolved oxygen, bottom type, attached grass species, depth, and distance from shore were also
noted.
When and where are sub-legal red drum typically captured in estuarine gill nets?
The abundance of sub-legal red drum by season and habitat was explored using data from the
IGNS for each of the major regions sampled. Key predictors examined included depth and distance
from shore. Catch per unit effort (# of red drum captured per set) was calculated by month for all
red drum captured less than 18 inches total length. Results were pooled across years. Comparison
of CPUE values between shallow and deep sets clearly reveals a strong preference to shallow water
by sub-legal red drum (
Table 39). Across regions and months, shallow sets generally captured
>90% the num
ber of red drum as did deep sets with only a few exceptions having lower values. In
all instances, CPUE’s from shallow sets exceeded those of deep sets. Monthly CPUE values for
sub-legal red drum in shallow sets increased in all regions beginning in August as fish recruited to
the gear (
Figure 30). Peak monthly CPUE values occurred in September for the Neuse River,
October for the Pam
lico River and Dare County, and in November for the Pungo River and Hyde
County. The highest combined CPUE across all regions occurred in November.
125

Figure 29. Map of Pamlico Sound and associated rivers showing the sam
ple strata and locations of
individual samples taken in the NCDMF independent gill net survey from 2001 to 2006.
Table 39. Independent gill net survey CPUE for sub-legal red drum (<18 inches TL) captured in shallow (<6
ft) versus deep (>6 ft) sets from
2001 to 2005.
Location February March April May June July August September October November December
Neuse River shallow sets 1.33 1.29 1.17 1.27 0.63 2.14 5.08 11.87 6.02 7.19 2.75
deep sets 0.13 0.04 0 0 0.5 0 0.13 0.07 0.83 0.22 0.24
% reduced in deep 90% 97% 100% 100% 21% 100% 97% 99% 86% 97% 91%
Pamlico River shallow sets 0 0 0.91 0.13 0.375 0.94 2.02 3.56 7.88 4.15 1.96
deep sets 0 0 0 0.11 0 0 0.1 0.51 0.13 0.29 0.13
% reduced in deep - - 100% 15% 100% 100% 95% 86% 98% 93% 93%
Pungo River shallow sets 0 4 1.1 0.63 3.5 1.83 1.57 4.04 3.63 8.63 4.75
deep sets 0 0.25 0 0.4 0 0 0 0.17 0.1 0.17 0.25
% reduced in deep - 94% 100% 37% 100% 100% 100% 96% 97% 98% 95%
Hyde County shallow sets 0.85 0.58 1.21 0.77 0.15 0.44 1.44 4.57 6.77 9.21 5.52
(Pamlico Sound) deep sets 0 0 0.1 0.02 0.06 0 0 0.02 0.02 0.29 0.25
% reduced in deep - 100% 92% 97% 60% 100% 100% 100% 100% 97% 95%
Dare County shallow sets 0.25 1.03 2.28 1 1.29 0.33 1.25 3.7 6.15 3.73 2
(Pamlico Sound) deep sets 0.1 0.03 0.13 0.06 0.02 0.04 0.02 0.86 0.94 0.48 1
% reduced in deep 60% 97% 94% 94% 98% 88% 98% 77% 85% 87% 50%
CPUE by Month
126

0
5
10
15
20
25
30
35
February March April May June July August September October November December
Month
Sum of CPUE across Regions
Dare County shallow sets
Hyde County shallow sets
Pungo River shallow sets
Pamlico River shallow sets
Neuse River shallow sets
Figure 30. Sub-legal red drum (<18 inches TL) CPUE by m
onth and region from the Pamlico Sound
independent gill net survey from 2001 to 2005.
In addition to depth, distance from shore was also analyzed to determine how sub-legal red
drum
catches may be impacted based on gill nets set at varying distances from shore. For this
analysis, sets made less than or greater than 50, 100 and 200 yards were compared using both deep
and shallow sets combined. In all regions, CPUE values typically decreased as distance from shore
increased (
Table 40). Hyde County had the greatest overall reduction with a 96% decrease in sub-
legal red drum
catch resulting from gill nets being set at least 50 yards from shore. Dare County saw
the lowest reduction but still had a 35% decrease in sub-legal red drum catch at 50 yards from shore.
Because depth typically increases with distance from shore, and red drum CPUE decreased with
increasing depth, the data were also analyzed using only shallow sets. Results using only shallow
water sets had higher overall CPUE values than did the deep and shallow sets combined, but the
percent reduction with distance from shore was similar. At 50 yards, the reduction in sub-legal red
drum catch ranged from 32% for Dare County to 95% for Hyde County.
Table 40. Sub-legal red drum CPUE from the NCDMF independent gill net survey with percent reductions
in CPUE based on establishing 50, 100, and 200 yard buffers from
shorelines for gill nets.
All Sets (Deep and Shallow) <50
y
ds >50
y
ds % reduction < 100
y
ds > 100
y
ds % reduction < 200
y
ds > 200
y
ds % reduction
Pamlico/Pungo/Neuse Rivers 1.87 0.88 53% 1.65 0.91 45% 1.51 0.18 88%
Pamlico Sound (Hyde County) 2.25 0.08 96% 2.01 0.01 100% 1.81 0.01 99%
Pamlico Sound (Dare County) 1.77 1.15 35% 1.72 1.13 34% 1.74 1.13 35%
Shallow Sets Only
Pamlico/Pungo/Neuse Rivers 3.23 2.02 37% 3.2 1.92 40% 3.16 0.41 87%
Pamlico Sound (Hyde County) 2.96 0.14 95% 2.94 0 100% 2.94 0 100%
Pamlico Sound (Dare County) 2.96 2.01 32% 2.92 1.96 33% 2.87 1.97 31%
CPUE reduction at 50 yds CPUE reduction at 100 yds CPUE reduction at 200 yds
127

What factors determine the fate of a red drum captured in a gill net?
Data from the NCDMF IGNS was analyzed to determine the fate of sub-legal red drum
captured with regard to month (water temperature) and mesh size (Table 41). Mortality was highest
for both sm
all and large mesh gill nets during the summer months from June through September.
Mortality in small mesh gill nets was higher than that for large mesh gill nets in every month except
September. Mortality rates showed a positive correlation with water temperature (
Figure 31).
Table 41. Sub-legal red drum acute mortality from capture in small and large mesh gill nets from
the NCDMF independent gill net survey, 2001 to 2006. Based on 12-hour soak tim
e.
Month N % dead N % dead
February 34 29% 7 0% 48
March 115 30% 9 0% 53
April 169 38% 30 33% 64
May 115 50% 11 27% 71
June 99 72% 27 67% 80
July 116 72% 17 65% 84
August 306 74% 30 57% 83
September 729 67% 67 69% 78
October 953 51% 80 24% 68
November 962 40% 74 4% 59
December 274 23% 24 4% 51
Small Mesh Large Mesh
Average Water
Temperature (
o
F)
0%
10%
20%
30%
40%
50%
60%
70%
80%
February March April May June July August September October November December
Month
% Acute Mortality
40
45
50
55
60
65
70
75
80
85
90
Temperature (F)
Small Mesh
Large Mesh
Average Water Temperature (F)
Figure 31. Mean water temperature (
o
F) and percent acute mortality (at the net) for sub-legal red drum
captured in small and large mesh gill nets by month.
128
Discussion
A goal of the North Carolina Red Drum FMP is to prom
ote fishing practices that minimize
bycatch. Bycatch in the estuarine gill net fishery appears to be a substantial source of mortality in
the red drum fishery. Estimates from the available observer data indicate that dead red drum
discards from the estuarine gill net fishery are approximately equal to the number of red drum
harvest commercially on an annual basis. This loss due to discard mortality accounted for about
14% to 18% of all red drum removals in 2004 and 2005. The majority of these mortalities are sub-
legal fish.
Sub-legal red drum have been described as being ubiquitous with shoreline habitat (Ross and
Stevens 1992). Data gathered from
the IGNS indicated that red drum catch rates increase with
decreasing water depth and decreasing distance to shore. Bacheler et al. (2007) recently analyzed
data from the IGNS to determine what factors contribute to the distribution of red drum in Pamlico
Sound. The study used a generalized additive model (GAM) to relate water quality, microhabitat,
geographic, and temporal factors to red drum catches in the IGNS. The model utilized these
variables to predict what factors were significant in determining the habitat usage of various life
stages of red drum in North Carolina. Results indicated that age 1 (primarily sub-legal) red drum
had a strong preference to shallow, nearshore habitat. In addition, red drum along the ‘Outer Banks’
(Dare County), tended to also commonly be associated with seagrass habitat. Findings of the study
are consistent with the descriptive data presented in this paper, and indicate that limiting gill nets in
shallow water habitats and near shorelines could substantially reduce red drum discard mortality.
The undesirable effect of this action is that landings of other legal species could potentially be
negatively impacted.
The difficult question moving forward is to weigh the cost and benefits of various actions.
Can catches of other species (i.e. spot, striped mullet, speckled trout, bluefish and flounder) be
retained or recouped if gill nets are prohibited in particular areas or if they are required to be set at a
particular distance from shore?
Large Mesh Gill Net Fishery
Data collected by NCDMF in the fall of 2004 found no significant difference in the catch
rates of flounder taken in gill nets set on the shoreline versus those set 50 yards offshore. Sets were
made in the Pamlico, Pungo and Neuse Rivers. A Fishery Resource Grant (FRG) conducted in 2002
was designed to address the catch rates of red drum and flounder in large mesh gill nets set close to
and off the shoreline (Montgomery 2003). The results of the study found that more red drum were
captured in gill nets set close to and perpendicular to the shoreline while flounder catches were
highest in nets set slightly off (10 to 25 ft) and parallel to the shore. The conclusion of the study was
that the data tended to support the hypothesis that nets set farther from the marsh line would
decrease red drum bycatch without decreasing the number of flounder taken. It was also noted
however, that the study was limited in spatial coverage and that the overall number of red drum
captured was relatively low. In 2005, a FRG was conducted in southeastern North Carolina to
determine the effect of gill net tie-downs on fish and bycatch rates in the flounder and American
shad fisheries (Thorpe et al. 2005). While the study did not find a significant difference in the catch
rates of red drum using tie-downs, the study did report that distance from shore (<80 ft) and net
129

orientation (perpendicular to shore) were significant factors in increasing the incidence of red drum
capture in the shad fishery from January through April. It was not apparent from the study if shad or
flounder species were impacted by these variables. A third FRG conducted in 2005 and 2006 was
designed to characterize the flounder gill net fishing techniques and bycatch in the Pamlico River
(Hassell 2007). Unlike the previous studies, results of this study showed some decrease in flounder
catches with increasing distance from shore. At a minimum distance from shore of 50 yards
flounder catches were reduced by 22% while red drum bycatch was reduced by 76%. The author
suggests an alternative option should be to explore a 25 yard buffer where the results indicated that
flounder catches would be reduced by 11% with red drum catches reduced by 48%.
To address this question more thoroughly, IGNS data was analyzed for legal size southern
flounder with catch rates reported for sets m
ade at less than or greater than 50 yards from shore
(
Table 42). Results for the rivers from the IGNS support the findings of Hassell (2007) and show
that catches of flounder outside 50 yards were reduced. Reductions in the IGNS rivers region were
m
uch more significant (61%) than those of Hassell (22%). Fishing methods in the IGNS may not be
typical for flounder fishermen in this area. For instance, the average depth fished in the Hassell
study was approximately 5 ft where sets made in the IGNS are typically either less than 3 ft or
greater than 6 ft. These differences may explain why the IGNS saw such a drastic decline in catch
rates in the rivers for sets made outside 50 yards where sets were typically made in water >6 ft.
Catch rates in Pamlico Sound (Hyde County) showed no differences in CPUE values for southern
flounder from sets made less than or greater than 50 yards while red drum bycatch was reduced by
96% in the offshore sets in this area (
Table 40). The Pamlico Sound (Dare County) saw a 22%
reduction in legal size flounder catches in gill net sets m
ade outside of 50 yards with a
corresponding reduction in sub-legal red drum bycatch of 35%.
Table 42. CPUE of southern flounder captured in IGNS from 2001 to 2006 in gill net
sets m
ade either less than or greater than 50 yards from shore.
Region
<
50 yds
>50 yds % reduction
Pamlico/Pungo/Neuse Rivers 0.67 0.26 61%
Pamlico Sound (Hyde County) 1.1 1.1 0%
Pamlico Sound (Dare County) 1.4 1.09 22%
CPUE
note: corresponding reductions of red drum are given in Table 16
An important criterion in deciding if and when regulations are needed should be to determine
w
hen the potential impacts are the greatest. The number of trips made in the gill net fishery
fluctuates with season, but red drum discard mortality for a given unit of gill net effort will primarily
be determined by two factors: 1) the mortality associated with being captured and 2) the availability
or catch rate of red drum to the gear being fished. In order to investigate how the cumulative effect
of these two factors has the potential to impact sub-legal red drum discard mortality throughout the
year, the relative index of abundance by month from the IGNS was multiplied by the mean monthly
acute mortality rate associated with gill net capture. Results indicate that the greatest potential
impact in the large mesh gill net fishery increases in June through August with a large peak in
130

September (Figure 32). Impacts are minimal in February, March, November and December.
Considering these im
pacts, the third factor to consider is fishing effort. Based on trip ticket
information, large mesh gill net trips are relatively high throughout the year but peak in October and
March. Based on this analysis the greatest potential impact for bycatch mortality of sub-legal red
drum in the large mesh gill net fishery would be for the period of June through October with the
month of September having by far the largest potential impact (
Figure 32).
0
0.1
0.2
0.3
0.4
0.5
0.6
February March April May June July August September October November December
Month
Acute gill net mortality rate x IGNS CPUE
0
1000
2000
3000
4000
5000
6000
7000
# of Large Mesh Gill Net Trips
Large Mesh Trips
Acute Mortality X CPUE
Figure 32. Potential impact of large mesh gill nets per unit of effort based on the availability of sub-
legal red drum
(CPUE from IGNS) and the % acute mortality associated with capture in a
gill net by month. Based on samples collected from 2001 to 2006.
Small Mesh Gill Net Fishery
As stated in the background of this report, North Carolina took action as part of the 2001 NC
red drum
FMP to reduce red drum bycatch in the estuarine gill net fishery. The restrictions require
the seasonal attendance of small mesh gill nets (<5” stretch mesh) and have been in place since
October of 1998. Small mesh gill nets select for red drum less than 18” TL and can be a significant
source of the bycatch mortality, particularly in months when water temperatures are high. Current
North Carolina regulations require the attendance of small mesh gill nets from May 1 through
October 31 in areas known to be critical for juvenile red drum. These include all primary and
secondary nursery areas, areas within 200 yards of any shoreline, and the extensive area of shallow
grass flats located behind the Outer Banks. An exemption to this rule lifts the attendance
requirement for the region from Core Sound to the South Carolina border in October to allow for the
fall spot fishery. In this fishery, observed trips by NCDMF noted that gill netters tended to set nets
at least 100 yards from shore and were able to avoid red drum bycatch.
When attendance rules were debated during the development of the 2001 Red Drum FMP,
m
uch discussion centered on the potential need for attendance to extend into November. At the
time, data were unavailable on the incidence of red drum bycatch during this period. Data collected
since that time indicates that sub-legal red drum have their highest catch rates during November and
although the acute mortality rate associated with this month is lower, it is still >40% (
Figure 31;
131

Table 41).
Analysis was done for small mesh gill nets, as with large mesh gill nets, to determine the
m
onths when the greatest potential impact per unit of gill net effort occurred for sub-legal red drum.
The results indicate that the months of August through November have the greatest potential impact
with a peak in September (Figure 33). Mortality is likely already greatly reduced due to attendance
regulations currently in place from May 1 through October 31. Of the remaining months, November
and December have the greatest potential for dead sub-legal discards.
0
1
2
3
4
5
6
February March April May June July August September October November December
Month
Acute gill net mortality rate x IGNS CPUE
0
200
400
600
800
1000
1200
1400
1600
1800
2000
# of Small Mesh Gill Net Trips
Small Mesh Trips
Acute Mortality X CPUE
Figure 33. Potential impact of small mesh gill nets per unit of effort based on the availability of sub-
legal red drum
(CPUE from IGNS) and the % acute mortality associated with capture in a
gill net by month. Based on samples collected from 2001 to 2006.
It is extremely difficult to predict how commercial gill net landings will be impacted by any
regulations. Reductions based on m
inimum distance from shore cannot account for the potential
adaptability of commercial users. Some landings, particularly for small mesh fisheries, may shift to
other gears such as run-around gill nets. The simplest exercise to understand potential impacts may
be to look at how landings shifted in the periods before and after the current attendance rule went
into place in October of 1998. Key species that were likely to be impacted by past attendance
regulations include those typically taken in small mesh gill nets: bluefish, Spanish mackerel,
menhaden, striped mullet, sea mullet, spot, weakfish, spotted seatrout and white perch (Table 43).
Landings after the attendance requirements were implemented in late 1998 show an overall 15%
increase over the pre-attendance period. By species, bluefish, Spanish mackerel, menhaden, spot
and white perch increased in landings, while striped (jumping) mullet, sea mullet, weakfish and
spotted seatrout landings decreased. Overall landings increased despite a 14% decrease in the
number of trips made and a 6% decrease in the ex-vessel value. Additional analysis indicates that
overall, there was no major shift to run-around gill nets and away from anchored gill nets since
attendance rules were implemented (Table 44). It appears that for those fisheries impacted by the
attendance requirements, gill netters were able to locate suitable fishing grounds outside the
attendance areas or were willing to attend their gillnets without major reductions in landings.
132

Table 43. Average annual landings, trips and value of key species captured in the estuarine gill net fishery
before (1994-1998) and after (1999-2006) the sm
all mesh gill net rules were implemented. Species
included are those typically taken in the small mesh gill net fishery. These data include both
anchored and run-around gill net landings.
1994-1998 1999-2006 1994-1998 1999-2006 1994-1998 1999-2006
Species Pre-attendance Attendance % change Pre-attendance Attendance % change Pre-attendance Attendance % change
Bluefish 277,235 335,646 21% 7,170 6,236 -13% 73,658$ 83,351$ 13%
Mackerel, Spanish 128,006 138,230 8% 1,625 1,200 -26% 72,036$ 130,154$ 81%
Menhaden 198,216 738,872 273% 668 3,433 414% 18,754$ 80,602$ 330%
Mullets, Jumping 1,772,629 1,700,232 -4% 11,748 8,477 -28% 1,153,276$ 867,614$ -25%
Sea Mullet 47,651 37,089 -22% 2,973 2,290 -23% 41,289$ 36,060$ -13%
Spot 493,543 647,588 31% 6,596 7,593 15% 179,944$ 305,350$ 70%
Weakfish 342,333 123,736 -64% 9,813 6,488 -34% 198,686$ 80,335$ -60%
Trout, Speckled 198,945 172,753 -13% 9,853 7,214 -27% 231,783$ 219,384$ -5%
White Perch 122,086 209,871 72% 5,316 4,902 -8% 93,631$ 136,966$ 46%
Total 3,580,644 4,104,018 15% 55,764 47,834 -14% 2,063,056$ 1,939,817$ -6%
Average Landings (lbs) Average Trips Average Value
Table 44. Average annual landings for key species captured in the small mesh estuarine gill net
fishery before (1994-1998) and after (1999-2006) the sm
all mesh gill net rules were
implemented. Results are broken down into either anchored or run-around/drift gill nets.
Species included are those typically taken in the small mesh gill net fishery.
1994-1998 1999-2006
Gear Species Pre-attendance Attendance % change
Anchored Gill Nets Bluefish 265172 324815 22%
Mackerel, Spanish 123981 135048 9%
Menhaden 196119 715089 265%
Mullets, Jumping 851131 714349 -16%
Sea Mullet 46963 36526 -22%
Spot 443381 603629 36%
Weakfish 339261 122123 -64%
Trout, Speckled 169378 127865 -25%
White Perch 120958 205755 70%
Total 2556344 2985197 17%
Run-around/Drift Gill Nets Bluefish 12063 10832 -10%
Mackerel, Spanish 4025 3182 -21%
Menhaden 2097 23783 1034%
Mullets, Jumping 921498 985884 7%
Sea Mullet 688 563 -18%
Spot 50162 43959 -12%
Weakfish 3072 1613 -47%
Trout, Speckled 29567 44889 52%
White Perch 1129 4116 265%
Total 1024300 1118821 9%
Average Landings (lbs)
133
Current Authority
North Carolina Fisheries Rules for Coastal Waters (15A NCAC)
03J.0103 Gill Nets, Seines, Identification, Restrictions
03R.0112 Attended Gill Net Areas
Management Options/Impacts
(+ potential positive impact of action)
(- potential negative impact of action)
Set small mesh (<5 inches stretch) estuarine gill net management options:
1) Status quo
+ No additional rules or burden for commercial fishery
- Continued bycatch and discards of sub-legal red drum
- Potentially reduced SPR and escapement rates
2) Extend attendance duration
+ Reduce red drum bycatch mortality
+ Decreased bias in stock assessment
+ Reduce bycatch of other unmarketable species
- Additional rules with increased burden for commercial fishery
- Potential for some reduced landings of target species
3) Extend attendance areas
+ Reduce bycatch and discard mortality in habitats where sub-legal red drum are abundant
+ Reduced mortality of juvenile red drum and decreased bias in stock assessment
+ Reduce bycatch of other unmarketable species
+ Continued use of gears/methods that have less impact (run-around gill nets, attended nets)
- Additional rules with increased burden for commercial fishery
- Potential for some reduced landings of target species
4) Require minimum depth for the use of set small mesh gill nets
+ Reduce red drum bycatch mortality in areas where sub-legal red drum are abundant
+ Decreased bias in stock assessment
+ Reduce bycatch of other unmarketable species
+ Continued use of gears/methods that have less impact (run-around gill nets, attended nets)
- Additional rules with increased burden for commercial fishery
- Increased potential for reduced landings of target species
5) Require minimum distance from shore for the use of set small mesh gill nets
+ Reduce red drum bycatch mortality in areas where sub-legal red drum are abundant
+ Decreased bias in stock assessment
134

+ Reduce bycatch of other unmarketable species
+ Continued use of gears/methods that have less impact (run-around gill nets, attended nets)
- Additional rules with increased burden for commercial fishery
- Potential for some reduced landings of target species
Set large mesh (>5 inches stretch) estuarine gill net management options:
1) Status quo
+ No new rules or additional burden for commercial fishery
- Continued bycatch and discards of sub-legal red drum
- Potentially reduced SPR and escapement rates
2) Require attendance seasons
+ Reduce red drum bycatch mortality during periods when discard mortality is high
+ Decreased bias in stock assessment
+ Reduce bycatch of other unmarketable species
- Additional rules with increased burden for commercial fishery
- Potential for some reduced landings of target species
3) Require nets to be set at a minimum distance from shore
+ Reduce red drum bycatch bycatch mortality in areas where sub-legal red drum are abundant
+ Decreased bias in stock assessment
+ Reduce bycatch of other unmarketable species
+ Continued use of gears/methods that have less impact (run-around gill nets, attended nets)
- Additional rules with increased burden for commercial fishery
- Potential for some reduced landings of target species
4) Require nets to be set at a minimum depth of water
+ Reduce bycatch and discard mortality in areas where sub-legal red drum are abundant
+ Reduced mortality of juvenile red drum and decreased bias in stock assessment
+ Reduce bycatch of other unmarketable species
+ Continued use of gears/methods that have less impact (run-around gill nets, attended nets)
- Additional rules with increased burden for commercial fishery
- Difficult to enforce
- Increased potential for some reduced landings of target species
135

Management Recommendations
DMF Recommendation
Small Mesh (<5” stretch mesh)
Year-round attendance requirements:
Extend attendance within 200 yards of shore to include the area of the lower Neuse out to the mouth of
the river.
Seaasonal attendance requirements:
Modify the seasonal attendance requirements for small mesh gill nets (currently May 1 to October 31) to
include the period of May 1 through November 30 in:
1) all primary and permanent secondary nursery areas and all m
odified no-trawl areas (shallow
grass beds in eastern Pamlico and Core Sound)
2) Within 200 yards of any shoreline for the areas of Pam
lico, Pungo, Neuse, and Bay Rivers
3) Within 50 yards of any shoreline in areas of Pam
lico and Core Sound and in all coastal
waters south to NC/SC line
4) Area from HWY 58 bridge south is excluded from
shoreline requirement during October
and November
Large Mesh (>5” stretch mesh)
Require all unattended large mesh gill nets to be set a minimum of 10 yards from any shoreline from
June through October
RDAC Recommendation
Small Mesh (<5” stretch mesh)
Year-round attendance requirements:
Extend attendance within 200 yards of shore to include the area of the lower Neuse out to the mouth
of the river (and)
Require year-round attendance of small mesh nets in Primary and Permanent Secondary Nursery
Areas north of the Wainwrights in Carteret County
and exempting the Albemarle Sound Management
Area
Seaasonal attendance requirements:
Modify the seasonal attendance requirements for small m
esh gill nets (currently May 1 to October 31)
to include the period of May 1 through November 30 in:
a) all primary and permanent secondary nursery areas
b) all modified no-trawl areas (shallow grass beds in eastern Pam
lico and Core Sound)
c) all areas within 200 yards of any shoreline, exem
pting the areas of Core Sound and south
from the 200 yards of any shoreline requirement during the months of October and November
Large Mesh (>5” stretch mesh)
Require all unattended large mesh gill nets to be set a m
inimum of 10 yards from any shoreline
136

MFC Selected Management Option:
Small Mesh (<5” stretch mesh)
Year-round attendance requirements:
Extend attendance within 200 yards of shore to include the area of the lower Neuse out to the
mouth of the river.
Seaasonal attendance requirements:
Modify the seasonal attendance requirements for small mesh gill nets (currently May 1 to
October 31) to include the period of May 1 through Novem
ber 30 in:
5) all primary and permanent secondary nursery areas and all modified no-trawl areas
(shallow grass beds in eastern Pamlico and Core Sound)
6) Within 200 yards of any shoreline for the areas of Pamlico, Pungo, Neuse, and Bay
Rivers
7) Within 50 yards of any shoreline in areas of Pamlico and Core Sound and in all coastal
waters south to NC/SC line
8) Area from Core Sound and south is excluded from shoreline requirement during
October and November
Large Mesh (>5” stretch mesh)
Require all unattended large mesh gill nets to be set a minimum of 10 yards from any shoreline
from June through October
Research Recommendations
• Conduct research to determine the extent of red drum interactions with the small mesh gill
net fishery in the areas of Core Sound and south during the months of October and
November.
• Continue and expand estuarine gill net observer program to collect data across various key
fisheries by season and area.
• Collect data from observer program or through other sources on the catch rates of red drum
and targeted species with regard to distance from shore.
• Conduct a comprehensive survey of gill net fishers including information on species
targeted, gear characteristics, areas fished.
• Conduct studies that explore ways to reduce red drum interactions while allowing for
retention of targeted species.
• Conduct additional research to determine the release mortality of red drum captured in gill
nets.
• Continue and enhance collection of fishery dependent data.
137
10.2.5.2 Red Drum Discard Byctatch in the Pamlico, Pungo and Neuse Rivers
Issue
Red drum discarded bycatch in the small mesh gill net fishery of the Pamlico, Pungo, and
Neuse rivers, N.C.
Background
Bycatch is defined as the “ the portion of a catch taken incidentally to the targeted catch
because of non-selectivity of the fishing gear to either species or size differences” (ASMFC 1994).
The 2001 Red Drum FMP stipulates that the take of red drum is allowed solely as bycatch, one may
not target or direct fishing effort toward red drum. Therefore any take of red drum meets the
definition of bycatch. Bycatch can be further divided into two components: incidental catch
(retained or marketable non-targeted species), and discard (portion of catch returned to the waters as
a result of regulatory, economic or personal considerations). Current management allows the
commercial harvest of up to 7 red drum, provided an equal weight of other commercially marketable
species is also taken. This harvest would be considered incidental catch, and any other take would
be “discard”. The distinction between these two categories is often overlooked in the public
discussion of “bycatch issues”.
The Neuse River small mesh gill net fisheries have become a focal point for these
discussions. During the developm
ent of the initial 2001 Red Drum FMP the issue of red drum
discards in large and small mesh gill net fisheries was debated and the following management
measures were enacted to reduce the discard and minimize impacts to other ongoing targeted
fisheries (striped mullet, speckled trout, etc.):
Rule NCAC 03J .0103 (Gill net, seines, identification, restrictions) sets up sm
all mesh (< 5
inches stretched mesh) net attendance requirements for referenced areas either year round or
seasonally from May 1 through 31 October. This rule also grants the Director broad proclamation
authority for gill nets and seines.
Rule NCAC 03R. 0112 (Attended gill net areas) specifies the year round locations (upper
Neuse, Pam
lico and Pungo rivers and within 200 yards of shore within portions of these systems)
and the seasonal areas (primary nursery, permanent secondary nursery, no trawl, Outer Banks
Mechanical Methods prohibited, within 200 yards of any shoreline).
The existing Rule NCAC 03O .0302 (Authorized gear for Recreational Com
mercial Gear
License) limits RCGL small mesh (defined as less than 5 ½ inch stretch mesh) to 100 yards per
person and not more than 200 yards when two or more RCGL holders are onboard a vessel. All
RCGL small mesh must be attended (within 100 yards) at all times. In inland water under the
Wildlife Resources Commission (WRC) no gill nets are allowed. During the development of the
2001 FMP whether to include the month of November as part of the seasonal attendance period was
debated but tabled due to a lack of adequate data. This issue paper will summarize independent
survey information that is now available.
138

The public concern about red drum discard in this system has intensified. The Division
(DMF) and the Marine Fisheries Commission (MFC) have received numerous complaints about red
drum discard in the tributaries and requests to eliminate small mesh gill nets. The recreational print
media have also highlighted this concern with several articles. This issue paper will summarize for
the Neuse and Pamlico river systems red drum discard rates, mortality rates, commercial effort and
harvest trends, and other relevant information in order to provide a sound basis for discussing
potential management actions.
Data Sources
Data for this issue paper were obtained from two fishery-independent programs (462, and
915), and two fishery-dependent programs (estuarine gill net sampling and the trip ticket program),
which are briefly described below. All analysis and discussion are based on seasons (October–
December) area (Pamlico, Pungo, and Neuse rivers) and anchored set gill nets with mesh size (3.5”,
4”, 4.5”). These mesh sizes are commonly used in the small mesh fisheries of Pamlico, Pungo and
Neuse rivers.
Trip Ticket Data
In 1994, NCDMF implemented a mandatory Trip Ticket Program, which is a landings
inform
ation record keeping system for each commercial harvest trip. Under this program licensed
fishermen can only sell commercial catches to licensed NCDMF fish dealers. The dealer is required to
complete a trip ticket every time a licensed fishermen lands fish. Trip tickets capture data on gears
used to harvest fish, area fished, species harvested, and total weights of each individual species. Gear
codes to distinguish large and small mesh gill nets were initiated in 2004. Care must be used in the
interpretation of landings assigned to a specific gear and waterbody. Up to three gears and one
waterbody may be reported on an individual trip ticket. On tickets with more than one gear,
assignment of landings to a specific gear is a judgment call. The method described in the “Bycatch
and Discards of Red Drum in the North Carolina Estuarine Gill Net Fishery” issue paper was used to
determine small mesh catches. The landings for the complex of targeted small mesh species
identified in the referenced Issue paper were used to represent this fishery in the Trends Section of
this paper.
Program 462 Independent Estuarine Gill Net Selectivity Study
Due to the aforementioned concerns the DMF initiated a study to quantify catch rates and
m
ortality of red drum, spotted sea trout, southern flounder, and striped bass during months in which
small mesh gill net attendance is not required. A total of 288 small mesh gill net samples were
collected in creeks off the Neuse and Bay rivers during the months of October - December 2005 &
2006 (Figure 34). This study utilized three separate gangs of nets with each gang consisting of three
nets (3½, 4, and 4½” stretched mesh, each 30 yards long by 8 feet deep). Each individual 30 yard
set composed a sample. Nets were set perpendicular and as close to shore as possible, left
unattended and then fished each following day with a target soak time of 24 hours in a manner that
closely mirrored commercial fishing practices.
139

Figure 34. Program 462 gill net sampling areas.
Data collected included: water depth; temperature, salinity, dissolved oxygen; time gear set
and retrieved, GPS coordinates of set, species
captured, length (FL or TL), and condition (alive,
dead, spoiled). Individual weights were calculated based on length/weight relationships obtained
from DMF age sampling. Upon retrieval of the nets, fish were enumerated by mesh size, measured
to the nearest mm and a total group weight obtained (kg). This program provided information on red
drum mortality, CPUE, and size and species composition, of small mesh gill nets.
Program 915 Pamlico Sound Independent Gill Net Survey
The DMF began an independent gill net survey (IGNS) in Pamlico Sound in 2001. The
program
was expanded to include the Pamlico, Pungo, and Neuse rivers in 2003. One objective of
this study was to provide a relative index of abundance for key species, including red drum.
The IGNS utilizes a stratified random sampling design where locations are selected based on
strata and depth. Sam
pling is divided into four regions: eastern Pamlico Sound (Dare County),
western Pamlico Sound (Hyde County), Neuse River, and Pamlico/Pungo River. Each of these
sampling regions is further divided into four evenly sized strata (Figure 35). A one-minute by one-
minute (one square nautical mile) grid system is laid over each stratum. Each stratum is sampled
twice monthly. A sample consisted of two shots of gill net and shots are made up of an array of
panels, with each panel being 30 yards in length. Panels vary in mesh size ranging from 3 to 6 ½
inches stretch mesh by ½ inch intervals. For each sample, one shot was placed in deep (>
6 ft) and
one shot was placed in shallow (<6 ft) water. Gill nets were set at dusk and fished the following
morning with a target soak time of 12 hours. Nets set close to shore are either set perpendicular or
parallel based on conditions and common fishing practice in the area.
140

Individual species captured are enumerated, measured and condition of fish at capture is
recorded (alive, dead or spoiled). Pertinent environmental data such as: salinity, temperature,
dissolved oxygen, bottom type, attached grass species, depth, and distance from shore are also noted.
Data from this program was used to obtain species composition, size data, and CPUE estimates for
small mesh gill nets.
Figure 35. Independent gill net (Program 915) sampling grids for the Neuse, Pamlico, and Pungo,
rivers.
Program 461 Dependent Estuarine Gill Net Sampling
Sampling of the estuarine gill net fishery was initiated by the DMF in April 1991 to
determ
ine age, size, and composition of species taken in the gill net fishery. Trip information is
gathered on waterbody fished, total length of nets (feet), soak time (minutes), specific net type (i.e.
float, sink, etc.), mesh size (bar mesh, inches), net depth (float nets, recorded in feet), vertical fishing
depth (sink nets, recorded in feet), twine size, average water depth (meters) and incidental species.
Information from this program was used to estimate average yardage by mesh size of small mesh
nets fished in the river system, which was then used to obtain estimates of red drum CPUE in the
commercial fishery.
Trend Analysis
Landings for the targeted small mesh gill net fishery in the rivers have averaged 663,591
pounds since 1994, while other estuarine water small mesh landings have averaged 3.3 million
pounds during the same time frame. Landings for both areas have shown an upward trend since
1994 (Figure 36). The number of trips in the rivers has remained relatively stable and had averaged
4, 074 since 1994 (Figure 37). Although landings for other waters have shown an upward trend the
number of trips is declining (Figure 38) and have averaged 24,184 trips per year. Both areas have
shown a declining trend in the number of participants, with 282 fishermen on average working the
rivers and, 1,362 in other areas of the state (Figure 39). The small mesh fishery in the rivers
accounts for 17% of the poundage and participation, and 14% of the trip of the statewide estuarine
small mesh fishery.
141

0
1,000,000
2,000,000
3,000,000
4,000,000
5,000,000
6,000,000
1994
1995
1996
1997
1998
1999
2000
2001
2002
2003
2004
2005
2006
Year
Pounds
Other
River
Figure 36. Reported landings for targeted small mesh gill net species. River includes Pamlico,
Pungo, and Neuse rivers; other includes all other estuarine waters of the state. Targeted
species are bluefish, red drum
, kingfish, Spanish mackerel, Atlantic Menhaden (bait),
striped mullet, white perch, spotted seatrout, spot, and weakfish.
0
5,000
10,000
15,000
20,000
25,000
30,000
35,000
40,000
1994
1995
1996
1997
1998
1999
2000
2001
2002
2003
2004
2005
2006
Year
Number
Other
River
Figure 37. Numbers of trips for targeted small mesh gill net species. River includes Pamlico,
Pungo, and Neuse rivers; other includes all other estuarine waters of the state.
142

0
500
1,000
1,500
2,000
2,500
1994
1995
1996
1997
1998
1999
2000
2001
2002
2003
2004
2005
2006
Year
Number
Other
River
Figure 38. Numbers of participants targeting small mesh gill net species. River includes Pamlico,
Pungo, and Neuse rivers; other includes all other estuarine waters of the state.
Species Composition
Species composition by river system is shown for October and November/December in order
to contrast catch composition between attendance and non-attendance periods.
Trip Ticket Species Composition
Based on annual landings the seasonal percentage by species using small mesh gill nets in
the Neuse River, October through December, were spotted seatrout (41.9%), spot (40.9%), striped
mullet (32.8%), red drum (22%) and bluefish (15.2%). October accounts for 8% of all gill net
landings in the Neuse River, while November accounts for 5%, and December 3% (Table 45). For
the Pamlico/Pungo complex, 66% of the weakfish were landed from October through November
(Table 46). Other species with significant landings during this three month period are; Sea mullet
(65%), striped mullet (39%), red drum (33%), and spotted sea trout (32%). October landings for this
system are 10% of the total, followed by November (8%), and December (7%).
Program 462 Species Composition
Percent species composition for Program 462 sampling includes all species captured.
Looking at all species, striped mullet were the primary species captured in October accounting for
41% of the total collection weight (Table 47). Other commercially important species captured
during this month included, red drum (10.1%), spotted seatrout (6.8%), southern flounder (3.9%)
and weakfish (0.9%).
143
When only the top five marketable species for October are included, percentages shifted to
for striped mullet (67.4%), red drum (19.8%), spotted seatrout (7.5%), bluefish (4.3%) and spot
(1%). For November and December, red drum (49.7%) were more abundant than striped mullet
(35%).
For all species during November and December red drum were the most abundant species
captured in this study accounting for 49.7% of the total weight (Table 48). Striped m
ullet accounted
for 35.1% of the catch, followed by spotted seatrout (14.2 %), spot (1.0 %) and no bluefish.
Program 915 Species Composition
Data from the shallow water sets (< 6’) were used in this analysis because the vast majority
of commercial effort is prosecuted within shallow waters. Furthermore, 94 % of the red drum were
caught in shallow sets (
Table 49), and these sets are similar to those made in Program 462. Red
drum
were the primary species captured in October and accounted for 34.4% of the total collection
weight for the Neuse River (
Table 50). When only the top five marketable species for October are
included, percentages shifted to for red drum
(64.3%), striped mullet (19.0 %), spotted seatrout (9.6
%), bluefish (4.7 %) and spot (2.3 %). November and December show similar species compostion.
For the Pamlico and Pungo rivers red drum were the most abundant species accounting for
26.8% of
the total catch (Table 51). Other economically important species captured were striped
mullet (18.4%), striped bass (6.2%), and southern flounder (3.7%).
When looking only at the top five marketable species for October, percentages shifted for red
drum
(52.5%), striped mullet (45.1 %), spotted seatrout (0.5 %), bluefish (0 %) and spot (1.9 %).
Again, November and December also have similar species composition.
During November and December red drum accounted for 30.6% of the catch in the Neuse
River (Table 52). Striped bass accounted for 13.6% of the catch, followed by striped m
ullet
(13.1%), spotted sea trout (3.3%), and southern flounder (1.1%). Catches from the Pamlico and
Pungo rivers for this time frame were dominated by gizzard shad [35.9% (Table 53)]. Red drum was
the second most abundant species and accounted for 14.1% of the catch. This was followed by
striped bass (11.9%), and striped mullet (11.2%).
144

Table 45. Average monthly landings (pounds) for targeted small mesh gill net species in the Neuse River, NC 2001 – 06, set nets only.
Month
Species Jan Feb Mar Apr May Jun Jul Aug Sep Oct Nov Dec Total
Bluefish . 1 76 2,854 579 59 16 434 872 819 53 2 5,764
Red drum 465 395 412 601 1,190 899 716 838 1,330 1,179 577 178 8,780
Sea mullet . 0 6 74 9 0 2 3 5 48 10 1 159
Spanish mackerel . 8 . 1 30 4 65 7,724 4,813 1,011 18 . 13,673
Atlantic menhaden 3,341 35,380 30,923 15,109 1,406 3 36 247 269 674 595 825 88,807
Mullets 5,987 3,649 2,224 4,063 2,406 1,999 1,846 2,338 3,791 6,589 5,045 2,167 42,103
White perch 63 202 275 92 5 3 4 8 7 8 84 112 864
Spotted sea trout 1,458 898 669 1,212 1,129 491 160 277 375 818 2,183 1,822 11,491
Spot 11 1 94 2,672 1,633 551 506 398 1,049 4,003 761 13 11,691
Weakfish 40 75 179 801 130 17 10 26 105 364 284 190 2,221
All 11,365 40,608 34,860 27,479 8,518 4,026 3,360
12,292 12,614 15,512 9,610 5,310 185,554
Table 46. Average monthly landings (pounds) for targeted small mesh gill net species in the Pamlico, Pungo rivers, NC 2001 – 06, set nets only.
Month
Species Jan Feb Mar Apr May Jun Jul Aug Sep Oct Nov Dec Total
Bluefish . . 1 968 326 81 2 97 220 34 2 . 1,731
Red drum 184 144 119 131 163 259 486 689 618 778 437 168 4,175
Sea mullet . 3 0 6 6 1 0 1 4 14 9 16 60
Spanish mackerel . . . 2 289 144 147 1,303 2,199 393 1 . 4,477
Atlantic menhaden 2,717 13,520 24,530 2,603 58 114 31 28 11 7 47 35 43,702
Mullets 12,594 4,517 7,395 5,488 4,226 4,005 1,760 3,179 5,107 13,009 8,701 9,026 79,007
White perch 2,328 2,528 3,162 767 234 60 25 185 156 290 1,338 1,078 12,150
Spotted sea trout 2,430 251 254 464 1,297 571 111 128 253 543 1,281 898 8,480
Spot . 3 48 1,893 1,505 702 142 436 640 866 44 2 6,282
Weakfish 3 8 112 508 63 6 2 17 142 578 851 258 2,546
All 20,255 20,973 35,620 12,829 8,165 5,941 2,706
6,064 9,351 16,514 12,709 11,481 162,609
145

Table 47. Species composition from Program 462, Estuarine Gill Net Selectivity Study, Neuse River
NC, October, 2005 - 06.
Species
Number
of nets
Mean
catch
weight
(kg)
Percent
total
weight
Mean
catch
num
ber
Percent
total
number
Mean
fi
sh
weight
(kg)
Total
num
ber
Total
weight
(kg)
Striped mullet 54 1.8 41.0 2.3 22.4 0.8 126 96.6
Gizzard shad 54 1.0 23.5 2.4 23.1 0.4 130 55.5
Red drum 54 0.4 10.1 0.7 6.6 0.6 37 23.9
Spotted seatrout 54 0.3 6.8 0.3 2.5 1.1 14 16.0
Atlantic menhaden 54 0.3 6.0 2.1 19.8 0.1 111 14.0
Southern flounder 54 0.2 3.9 0.5 4.6 0.4 26 9.3
Blue crab 54 0.1 2.2 0.6 5.7 0.2 32 5.1
Black drum 54 0.1 1.8 0.1 0.9 0.8 5 4.2
Pinfish 54 0.1 1.7 1.0 9.3 0.1 52 3.9
Weakfish 54 0.0 0.9 0.2 1.6 0.2 9 2.1
Spot 54 0.0 0.8 0.1 1.4 0.2 8 1.8
Striped bass x white 54 0.0 0.5 0.0 0.2 1.2 1 1.2
Bluefish 54 0.0 0.3 0.0 0.4 0.4 2 0.8
Atlantic croaker 54 0.0 0.2 0.0 0.4 0.2 2 0.4
White perch 54 0.0 0.1 0.0 0.2 0.4 1 0.4
Silver perch 54 0.0 0.1 0.1 0.5 0.1 3
0.3
Southern kingfish 54 0.0 0.1 0.0 0.2 0.3 1 0.3
Ladyfish 54 0.0 0.1 0.0 0.2 0.2 1 0.2
White shrimp 54 0.0 0.0 0.0 0.2 0.0 1 0.0
146

Table 48. Species composition from Program 462, Estuarine Gill Net Selectivity Study, Neuse
River NC, Novem
ber - December, 2005 - 06.
Species
Number
of nets
Mean
catch
weight
(kg)
Percent
total
weight
Mean
catch
num
ber
Percent
total
number
Mean
fi
sh
weight
(kg)
Total
num
ber
Total
weight
(kg)
Red drum 234 1.2 30.2 1.7 24.1 0.7 388 273.1
Striped mullet 234 1.0 25.6 1.2 17.0 0.8 274 230.9
Spotted seatrout 234 0.6 14.3 0.5 6.9 1.2 112 129.2
Gizzard shad 234 0.5 13.4 1.1 15.6 0.5 251 121.2
Atlantic menhaden 234 0.2 5.2 1.4 20.5 0.1 330 47.1
Southern flounder 234 0.1 3.4 0.3 4.9 0.4 79 30.7
White perch 234 0.1 1.9 0.2 3.2 0.3 51 17.3
Longnose gar 234 0.0 1.2 0.0 0.4 1.8 6 10.5
Striped bass x white 234 0.0 1.0 0.0 0.5 1.1 8 9.0
Bowfin 234 0.0 0.8 0.0 0.3 1.4 5 7.2
Black drum 234 0.0 0.7 0.1 1.4 0.3 22 6.6
Blue crab 234 0.0 0.7 0.2 3.3 0.1 53 6.5
Striped bass 234 0.0 0.6 0.0 0.5 0.7 8 5.5
Spot 234 0.0 0.3 0.0 0.4 0.4 6 2.5
White catfish 234 0.0 0.3 0.0 0.2 0.8 3 2.4
Pinfish 234 0.0 0.1 0.0 0.6 0.1 9
0.6
Sheepshead 234 0.0 0.0 0.0 0.1 0.2 2 0.4
Tarpon 234 0.0 0.0 0.0 0.1 0.2 1 0.2
Hogchoker 234 0.0 0.0 0.0 0.1 0.1 1 0.1
Ladyfish 234 0.0 0.0 0.0 0.1 0.1 1 0.1
147

Table 49. Program 915 sampling effort and number of red drum by month in
shallow
(<6ft) and deep (>6ft) water gill net sets. Data is combined
for all river systems sampled, Pamlico, Pungo and Neuse rivers. Set
is defined as each 30 yard net (3 ½, 4, and 4 ½”).
Total sets made Red drum captured in sets
Month/year Shallow Deep Shallow Deep
Sep-05 12 18 12 1
Oct-05 33 33 107 0
Nov-05 31 31 40 7
Dec-05 15 15 0 0
Feb-06 14 15 0 0
Mar-06 30 30 1 0
Apr-06 30 30 13 0
May-06 30 30 21 0
Jun-06 29 30 23 0
Jul-06 30 30 8 0
Aug-06 29 31 5 5
Sep-06 24 30 19 4
Oct-06 30 30 5 3
Nov-06 29 30 75 0
Dec-06 15 15 7 0
Total 381 398 336 20
Percent of total 49% 51% 94% 6%
148

Table 50. Neuse River species composition data from
Program 915, Pamlico Sound Independent
Gill Net Survey, October, 2005 - 06.
Species
Number
of nets
Mean
catch
weight
(kg)
Percent
total
weight
Mean
catch
num
ber
Percent
total
number
Mean
fi
sh
weight
(kg)
Total
num
ber
Total
weight
(kg)
Red drum 24 3.9 34.4 3.4 11.5 1.2 27 31.4
Gizzard shad 24 3.0 25.9 6.8 23.0 0.4 54 23.7
Atlantic menhaden 24 1.8 15.7 13.9 47.2 0.1 111 14.4
Striped mullet 24 0.9 7.6 1.0 3.4 0.9 8 6.9
Spotted seatrout 24 0.5 4.4 0.5 1.7 1.0 4 4.1
Southern flounder 24 0.2 2.2 0.6 2.1 0.4 5 2.0
Striped bass 24 0.2 2.0 0.1 0.4 1.8 1 1.8
Bluefish 24 0.2 1.6 0.3 0.9 0.7 2 1.4
Black drum 24 0.2 1.4 0.1 0.4 1.3 1 1.3
Atlantic sturgeon 24 0.2 1.4 0.3 0.9 0.7 2 1.3
Atlantic croaker 24 0.1 0.9 0.4 1.3 0.3 3 0.8
Pinfish 24 0.1 0.6 0.5 1.7 0.1 4 0.6
Blue crab 24 0.1 0.6 0.5 1.7 0.1 4 0.6
Sheepshead 24 0.1 0.5 0.1 0.4 0.5 1 0.5
Ladyfish 24 0.0 0.2 0.1 0.4 0.2 1
0.2
Weakfish 24 0.0 0.2 0.1 0.4 0.2 1 0.2
Spot 24 0.0 0.2 0.1 0.4 0.2 1 0.2
Cownose ray 24 . . 0.6 2.1 . 5 .
149

Table 51. Pamlico and Pungo rivers species composition data from Program 915, Pamlico Sound
Independent Gill Net Survey, October, 2005 - 06
Species
Number
of nets
Mean
catch
weight
(kg)
Percent
total
weight
Mean
catch
num
ber
Percent
total
number
Mean
fi
sh
weight
(kg)
Total
num
ber
Total
weight
(kg)
Red drum 39 6.3 26.8 6.5 13.9 1.0 85 82.5
Gizzard shad 39 5.7 24.1 14.2 30.2 0.4 184 74.1
Striped mullet 39 4.4 18.4 5.6 12.0 0.8 73 56.7
Striped bass 39 1.5 6.2 1.6 3.4 0.9 21 19.1
Atlantic menhaden 39 1.1 4.5 7.5 16.1 0.1 98 14.0
Southern flounder 39 0.9 3.7 2.2 4.8 0.4 29 11.4
Carp 39 0.9 3.7 0.8 1.6 1.1 10 11.4
Moxostoma suckers 39 0.8 3.5 0.9 2.0 0.9 12 10.7
Bowfin 39 0.6 2.4 0.4 0.8 1.5 5 7.3
Blue crab 39 0.6 2.3 4.6 9.8 0.1 60 7.2
White perch 39 0.2 1.0 0.8 1.6 0.3 10 3.1
Largemouth bass 39 0.2 0.9 0.3 0.7 0.7 4 2.9
White catfish 39 0.2 0.7 0.2 0.5 0.7 3 2.2
Atlantic croaker 39 0.1 0.4 0.2 0.5 0.4 3 1.3
Spot 39 0.1 0.4 0.2 0.5 0.4 3
1.1
Spotted seatrout 39 0.1 0.3 0.1 0.2 1.0 1 1.0
Yellow bullhead 39 0.0 0.2 0.1 0.2 0.6 1 0.6
Pinfish 39 0.0 0.2 0.5 1.0 0.1 6 0.5
Black drum 39 0.0 0.2 0.1 0.2 0.5 1 0.5
Black crappie 39 0.0 0.1 0.1 0.2 0.4 1 0.4
150

Table 52. Neuse River species composition data from
Program 915, Pamlico Sound Independent
Gill Net Survey, November - December 2005 - 06.
Species
Number
of nets
Mean
catch
weight
(kg)
Percent
total
weight
Mean
catch
num
ber
Percent
total
number
Mean
fi
sh
weight
(kg)
Total
num
ber
Total
weight
(kg)
Red drum 36 3.7 30.6 4.5 15.8 0.8 54 44.3
Gizzard shad 36 2.0 16.2 4.7 16.4 0.4 56 23.5
Atlantic menhaden 36 1.7 14.5 13.9 48.8 0.1 167 21.0
Striped bass 36 1.6 13.6 0.8 2.9 2.0 10 19.7
Striped mullet 36 1.6 13.1 2.0 7.0 0.8 24 19.0
Spotted seatrout 36 0.4 3.3 0.3 0.9 1.6 3 4.8
Black drum 36 0.3 2.4 1.2 4.1 0.2 14 3.5
Bowfin 36 0.2 1.5 0.1 0.3 2.2 1 2.2
Southern flounder 36 0.1 1.1 0.2 0.6 0.8 2 1.6
White catfish 36 0.1 1.1 0.2 0.6 0.8 2 1.5
White perch 36 0.1 0.7 0.2 0.6 0.5 2 1.0
Spot 36 0.1 0.5 0.2 0.6 0.4 2 0.7
Atlantic sturgeon 36 0.1 0.4 0.1 0.3 0.6 1 0.6
Largemouth bass 36 0.1 0.4 0.1 0.3 0.6 1 0.6
Bluefish 36 0.0 0.4 0.1 0.3 0.6 1
0.6
Hickory shad 36 0.0 0.3 0.1 0.3 0.5 1 0.5
151

Table 53. Pamlico and Pungo rivers species composition data from Program 915, Pamlico Sound
Independent Gill Net Survey, Novem
ber - December 2005 - 06.
Species
Number
o
f
samples
Mean
catch
weight
(kg)
Percent
total
weight
Mean
catch
num
ber
Percent
total
number
Mean
fi
sh
weight
(kg)
Total
num
ber
Total
weight
(kg)
Gizzard shad 57 6.4 35.9 14.0 39.1 0.5 266 121.6
Red drum 57 2.5 14.1 3.6 10.0 0.7 68 47.8
Striped bass 57 2.1 11.9 1.7 4.9 1.2 33 40.3
Striped mullet 57 2.0 11.2 3.1 8.5 0.7 58 37.8
Bowfin 57 1.8 9.8 0.9 2.5 2.0 17 33.3
Atlantic menhaden 57 1.0 5.5 8.8 24.7 0.1 168 18.7
White perch 57 0.5 2.8 1.5 4.1 0.3 28 9.6
Moxostoma suckers 57 0.3 1.9 0.3 0.9 1.1 6 6.4
Carp 57 0.3 1.5 0.3 0.9 0.8 6 4.9
Largemouth bass 57 0.2 1.2 0.3 0.7 0.8 5 3.9
Silver redhorse 57 0.2 1.1 0.2 0.4 1.3 3 3.8
White catfish 57 0.1 0.7 0.2 0.6 0.6 4 2.3
Southern flounder 57 0.1 0.7 0.3 0.7 0.4 5 2.2
Black crappie 57 0.1 0.4 0.2 0.4 0.5 3 1.5
Spotted seatrout 57 0.1 0.4 0.1 0.1 1.3 1
1.3
Chain pickerel 57 0.1 0.4 0.1 0.1 1.3 1 1.3
Suckers 57 0.1 0.3 0.1 0.1 1.0 1 1.0
Yellow bullhead 57 0.0 0.3 0.1 0.1 0.9 1 0.9
Blue crab 57 0.0 0.2 0.3 0.9 0.1 6 0.7
152

Discussion
Length Frequency
Independent gill net survey data indicates that small mesh gill nets used from October -
Decem
ber in the Neuse River predominately take red drum under 18 inches (Figure 39, Figure 40,
and Figure 41). Ninety-nine percent of red drum captured in program 462 were sublegal (<18”) and
none were above the upper slot limit (>27”). Eighty-nine percent of red drum captured in program
915 were sublegal (<18”) and none were above the upper slot limit (>27”).
0
20
40
60
80
100
120
11 12 13 14 15 16 17 18 19 20 21 22 23 24 25
Size Class (inches)
Frequency
3.5" (N = 219)
4" (N = 149)
4.5" (N = 57)
Figure 39. Red drum length frequency from October - Decem
ber 2005 and 2006 from Neuse River,
NC. Samples taken from NCDMF Program 462 independent Estuarine Gill Net
Sampling.
153

0
2
4
6
8
10
12
11 12 13 14 15 16 17 18 19 20 21 22 23 24 25
Size Class (inches)
Frequency
3.5" (N = 40)
4" (N = 26)
4.5" (N = 15)
Figure 40. Red drum length frequency from October-December 2005 and 2006 from Neuse River,
NC. Sam
ples taken from NCDMF Program 915 Pamlico Sound Independent Gill Net
Survey.
0
5
10
15
20
25
30
35
11 12 13 14 15 16 17 18 19 20 21 22 23 24 25
Size Class
(
inches
)
Frequency
3.5" (N = 81)
4" (N = 49)
4.5" (N = 20)
Figure 41. Red drum length frequency from October-Decem
ber 2005 and 2006 from Pamlico,
Pungo rivers, NC. Samples taken from NCDMF Program 915 Pamlico Sound
Independent Gill Net Survey.
154

Mortality
Overall, mortality rates estimated from sampling indicate October having the highest rate
(46.0-58.6%), while November (28.3-40.0%) and December (0-14.5%) were lower (Table 54, Table
55, and Table 56). Mortality varied by mesh size and month for both Program 915 and 462 but
showed the same overall trend (Table 54, Table 55, and Table 56), generally declining with
increasing mesh size.
Table 54. Program 462 mortality estimates for red drum by mesh and month for Neuse River,
NC, 2005 and 2006 (N = Num
ber captured).
3.5" 4" 4.5" Total
Month N % Mortality N % Mortality N % Mortality N % Mortality
October 22 40.9 8 75.0 7 28.6 37 46.0
November 162 38.3 132 25.0 41 19.5 335 30.8
December 35 14.3 9 33.3 9 .0 53 15.1
Total 219 34.7 149 28.2 57 17.5 425 30.1
Table 55. Program 915 mortality estimates for red drum by mesh and month for Neuse River,
NC, 2005 and 2006 (N = Num
ber captured).
3.5" 4" 4.5" Total
Month N % Mortality N % Mortality N % Mortality N % Mortality
October 9 66.7 11 54.6 7 42.9 27 55.6
November 29 41.4 15 20.0 8 0 52 28.9
December 2 0 0 0 0 0 2 0
Total 40 45.0 26 34.6 15 20.0 81 37.0
Table 56. Program 915 mortality estimates for red drum by mesh and month for Pamlico
Pungo rivers NC, 2005 and 2006 (N = Num
ber captured).
3.5" 4" 4.5" Total
Month N % Mortality N % Mortality N % Mortality N % Mortality
October 27 51.9 39 59.0 16 31.3 82 51.2
November 52 51.9 8 50.0 3 0 63 49.2
December 2 50.0 2 0.0 1 0 5 20.0
Total 81 51.9 49 55.1 20 25.0 150 49.3
CPUE
A total of 8,640 yards of small mesh gill net was set for Program 462 yielding a CPUE of one
red drum captured for every 20.3 yards of small mesh net fished. A total of 3,600 yards of small
mesh gill net was set for Program 915 yielding a CPUE of one red drum captured for every 44.4
yards of small mesh net fished. Catch rates from Program 915 and 462 were used to estimate the
number of red drum captured per trip by commercial fisherman on the Neuse River, NC (Table 57).
The November estimates of red drum CPUE per trip (37.5) for the two programs (462, and 915)
were the same; however, the estimate from Program 915 was double the amount estimated for
155
Program 462 in October and half of what was estimated for December (Table 57). The average
number of small mesh trips taken in the Neuse River from October through December was used to
expand the estimated red drum captured per trip shown in the last column in Table 57. The
estimated number of red drum captured by month (October through December) for the Neuse River
is shown in Table 58. Using this information, an estimated number of red drum taken in the Neuse
River small mesh gill net fishery was generated (Table 58). Table 59 and Table 60 give the same
information for the Pamlico/Pungo river complex, however only data from Program 915 was used
for the expansions. When comparing just the trip estimates based on the Program 915 data, the
estimates for the Pamlico/Pungo rivers were slightly higher in October than those for the Neuse
River (36.6 fish per trip versus 28.2). The reverse was true in November with the Neuse River rate
being 49.3,as opposed to 31.4 for the Pamlico/Pungo rivers. Trip estimates were similar in
December (Neuse 7.0, Pamlico/Pungo 5.2) (Table 57 and Table 59). The estimated take of red drum
for these systems was ~3,400 to 3,700 fish in the Neuse River and ~1,200 fish for the Pamlico/Pungo
rivers.
It is important to note that fishery independent gill net samples for Program 915 were
random
ly selected and no attempt was made to avoid areas that may or may not have a high density
of red drum, or commercial fishing activity. Additionally, the estimated red drum captured per trip
during October represent the worst-case scenario for this month. During this month commercial
fisherman are required to attend their nets and the soak times used for extrapolation were 12 hours
(Program 915) and 24 hours (Program 462).
For the Neuse River it does appear that there was a small shift (~10%) from set nets to
runaround/drift nets during the attendance period [May through October (Table 61)]. However,
there is no apparent difference in net use before the net attendance rule was put in place and after,
during the Novem
ber through April time period (Table 61). The overall trend for small mesh gill net
trips in this system is down, but there is a rebound in the number of trips beginning in 2004 (Figure
42). Changes in the Pamlico/Pungo river complex are shown in Table 62. For this system there
appears to be an 8 to 10% shift from set nets to run around/drift nets. The number of small mesh
trips in this system is stable with no apparent upward or downward trend (Figure 43). While the
change in effort is not substantially large, there has been a shift in the percent contribution of target
species that set and run around small mesh nets capture (Table 63). Overall there has been a 34%
decline in the percent contribution that set nets made to the total small mesh gill net landings for the
ten listed target species. While the set net contribution declined, the run around gill net contribution
increased by 49% (Table 63).
156

Table 57. Neuse River estimated red drum CPUE for commercial small mesh fishery from October – December
(2005-06 com
bined). Data from Program 915- Pamlico Sound Independent Gill Net Survey, Program
462-Estuarine Gill Net Selectivity Study and Program 461 – Estuarine Gill Net Sampling were used to
estimate commercial discards.
3.5" 4" 4.5" Total
Program Month
Mean yards
fished
2
Red drum
CPUE per
yard
1
Est. red
drum per
trip
Red drum
CPUE per
ya
rd
1
Est. red
drum per
trip
Red drum
CPUE per
ya
rd
1
Est. red
drum per
trip
Red drum
CPUE per
ya
rd
1
Est. red
drum per
trip
462 October 704.0 0.04 28.2 0.01 7.0 0.01 7.0 0.02 14.1
November 704.0 0.11 77.4 0.08 56.3 0.02 14.1 0.07 49.3
December 704.0 0.05 35.2 0.01 7.0 0.01 7.0 0.02 14.1
915 October 704.0 0.04 28.2 0.04 28.2 0.03 21.1 0.04 28.2
November 704.0 0.12 84.5 0.06 42.2 0.03 21.1 0.07 49.3
December 704.0 0.02 14.1 0 0.0 0 0.0 0.01 7.0
1
- CPUE was estimated from two Independent Gill Net Surveys.
2
- This value represents the average yards fished by a commercial fisherman in the Neuse River, source program 461.
157

Table 58. Neuse River estimated number of red drum captured in commercial small mesh gill nets based on
m
ortality and month from October – December (2005-06 combined). Data from Program 915- Pamlico
Sound Independent Gill Net Survey, Program 462-Estuarine Gill Net Selectivity Study, and Trip Ticket
Program were used to estimate commercial mortality.
Discarded Incidental harvest
Program Month
Estimated
red drum
per trip
Trip
Ticket
estim
ated
number of
trips
1
Estimated
number of
red drum
captured
Percent
sublegal
dead
Sublegal
dead
Percent
sublegal
alive
Sublegal
alive
Percent
legal
Number
legal
462 October 14.1 58 817.8 41.0% 331.2 51.0% 420.3 8.0% 66.2
November 49.3 63 3105.9 30.0%
934.9 69.0% 2143.1 1.0% 28.0
December 14.1 44 620.4 15.0%
93.7 85.0% 526.7 0 0
Total (Nov-Dec) 3726.3
1028.6
2669.8 28.0
915 October 28.2 58 1635.6 48.0% 790.0 35.0% 564.3 17.0% 281.3
November 49.3 63 3105.9 28.0%
879.0 64.0% 1994.0 8.0% 232.9
December 7.0 44 308.0 0
0 100% 308.0 0 0
Total (Nov-Dec) 3413.9
879.0
2302.0 232.9
1
– Average for 2005 – 2006.
158

Table 59. Pamlico - Pungo river estimated red drum CPUE for commercial small mesh fishery from October –
December (2005-06 combined). Data from Program 915- Pamlico Sound Independent Gill Net
Survey, Program 462-Estuarine Gill Net Selectivity Study, and Program 461 – Estuarine Gill Net
Sampling were used to estimate commercial discards.
3.5" 4" 4.5" Total
Program Month
Mean yards
fished
2
Red drum
CPUE per
yard
1
Est. red
drum per
trip
Red drum
CPUE per
ya
rd
1
Est. red
drum per
trip
Red drum
CPUE per
ya
rd
1
Est. red
drum per
trip
Red drum
CPUE per
ya
rd
1
Est. red
drum per
trip
915 October 523.5
0.07 36.6 0.11 57.6 0.04 20.9 0.07 36.6
November 523.5
0.14 73.3 0.02 10.5 0.01 5.2 0.06 31.4
December 523.5
0.01 5.2 0.01 5.2 0.01 5.2 0.01 5.2
1
- CPUE was estimated from 915 Pamlico Sound Independent Gill Net Survey.
2
- This value represents the average yards fished by a commercial fisherman in the Pamlico-Pungo rivers, source data Program 461.
3
– No samples for 4.5” mesh. Estimated based on 4.5” from Neuse River information.
Table 60. Pamlico - Pungo estimated number of red drum captured in commercial small mesh gill nets based on
mortality and month from October – December (2005-06 combined). Data from Program 915-
Pamlico Sound Independent Gill Net Survey and Trip Ticket Program were used to estimate
commercial mortality.
Discarded Incidental harvest
Program Month
Estimated
red drum
per trip
Trip
Ticket
estim
ated
number of
trips
1
Estimated
number of
red drum
captured
Percent
sublegal
dead
Sublegal
dead
Percent
sublegal
alive
Sublegal
alive
Percent
legal
Number
legal
462 October
36.6 34 1244.4 40.5% 504.0 45.1% 561.5 7.3% 91.1
November
31.4 33 1036.2 30.1% 311.9 49.2% 509.9 1.5% 16.5
December
5.2 21 109.2 15.1% 16.5 80.0% 87.4 0% 0
Total (Nov-Dec)
1145.4
328.4
597.3 16.5
1
Average for 2005 and 2006.
159

160
Table 61. Percentage of reported trips in the Neuse River using various types of gill nets before
the attendance rule was im
plemented (1994 - 1998), and after it was implemented.
Post attendance Pre attendance Post attendance Pre attendance
Nov - April Nov - April May - Oct May - Oct
Year run&drift setnet run&drift setnet run&drift setnet run&drift setnet
1994
10% 90%
11% 89%
1995
11% 89%
33% 67%
1996
31% 69%
46% 54%
1997
38% 62%
51% 49%
1998
28% 72%
47% 53%
1999 28% 72%
46% 54%
2000 20% 80%
42% 58%
2001 27% 73%
43% 57%
2002 30% 70%
37% 63%
2003 25% 75%
65% 35%
2004 31% 69%
55% 45%
2005 39% 61%
60% 40%
2006 33% 67%
63% 37%
Total 28% 72% 25% 75% 49% 51% 39% 61%
Total trips 1,708 4,312 1,070 3,163
2,140 2,196 1,633 2,520
Avg trips 214 539 214 633 268 275 327 504
0
500
1000
1500
2000
2500
1994
1995
1996
1997
1998
1999
2000
2001
2002
2003
2004
2005
2006
Year
Number of trips
run&drift setnet
Figure 42. Neuse River small mesh gill net trips (all gears combined), and overall trend for gill
net trips in this river, 1994 – 2006.
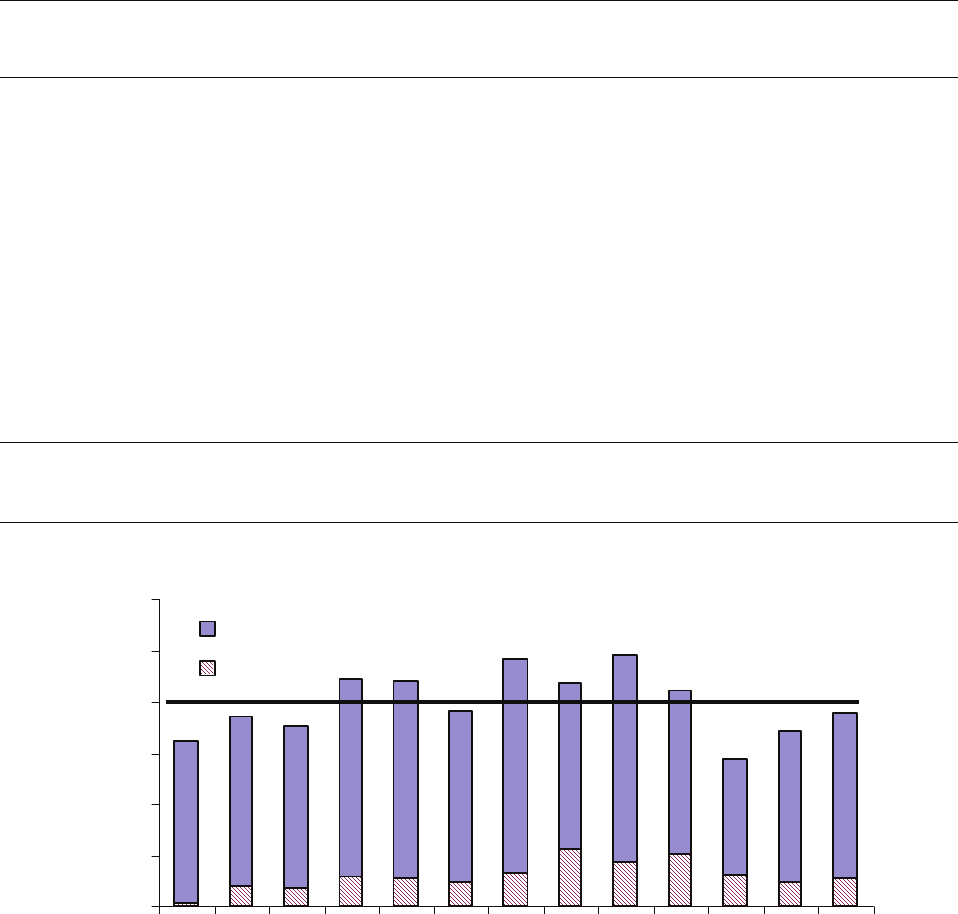
161
Table 62. Percentage of reported trips in the Pamlico/Pungo river complex using various types
of gill nets before the attendance rule was im
plemented (1994 -1998), and after it
was implemented.
Post attendance Pre attendance Post attendance Pre attendance
Nov - April Nov - April May - Oct May - Oct
Year run&drift setnet run&drift setnet run&drift setnet run&drift setnet
1994
2% 98%
2% 98%
1995
1% 99%
21% 79%
1996
5% 95%
20% 80%
1997
6% 94%
19% 81%
1998
9% 91%
19% 81%
1999 5% 95%
25% 75%
2000 8% 92%
24% 76%
2001 19% 81%
36% 64%
2002 14% 86%
22% 78%
2003 17% 83%
36% 64%
2004 20% 80%
27% 73%
2005 8% 92%
27% 73%
2006 10% 90%
22% 78%
Total 12% 88% 5% 95% 27% 73% 17% 83%
Total trips 481 3421 108 2074
694 1850 284 1386
Avg trips 60 428 22 415 87 231 57 277
0
200
400
600
800
1000
1200
1994
1995
1996
1997
1998
1999
2000
2001
2002
2003
2004
2005
2006
Year
Number of trips
setnet
run&drift
Figure 43. Pamlico, Pungo rivers small mesh gill net trips (all gears combined), and overall
trend for gill net trips in this system
, 1994 – 2006.

162
Table 63. Percent contribution (landings) of targeted species for small mesh gill net
fisheries by gear type (set nets, and run around), pre and post sm
all mesh
attendance rules, Pamlico, Pungo, and Neuse rivers landings data combined.
1994 – 2006, trip ticket data.
Set nets Run around/drift
Species
Pre
attendance
Post
attendance
Percent
change
Pre
attendance
Post
attendance
Percent
change
Bluefish 92.7 71.7 -22.7
7.3 28.3 288.1
Red drum 88.4 84.3 -4.6
11.7 15.7 34.7
Sea mullet 99.8 63.5 -36.3
0.2 36.5 15212.5
Spanish Mackerel 93.8 83.0 -11.5
6.2 17.0 174.4
Atlantic menhaden 100.0 82.7 -17.3
0.0 17.3
Mullets 55.0 31.3 -43.0
45.0 68.7 52.5
White perch 95.9 86.5 -9.7
4.1 13.5 226.4
Spotted seatrout 75.1 54.5 -27.4
25.0 45.5 82.3
Spot 93.9 71.3 -24.1
6.1 28.8 369.5
Weakfish 96.8 90.5 -6.5
3.2 9.5 195.8
All (weighted avg) 58.6 38.5 -34.3 41.4 61.5 48.5
Current Authority
The MFC has granted proclamation authority to the Director to specify the
means/methods to take red drum, in addition to other parameters (NCAC 15A 3M .0501). The
MFC also has granted proclamation authority to the Director to impose a variety of restrictions
on gill nets (3J. 0103(b)) and passed rules related to gill net attendance (3J. 0103 (g)(h)). A
listing of the current rules as they apply to red drum can be found in Section 4.7.
Management Options/Impacts (See section 10.2.5.1 Statewide Estuarine Gill Net Bycatch
Estimates
)
Research Recommendations (See section 10.2.5.1 Statewide Estuarine Gill Net Bycatch
Estimates
)
10.2.5.3 Other Gill Net Issues
Issue
Consider possible alterations to the current gill net attendance (modified no-trawl) area
along the eastern Pamlico Sound based on public comments received during FMP process.
163
Background
During the public comment period for Amendment 1 to the North Carolina Red Drum
FMP gill net fishers expressed concerns over the need for possible changes to the small mesh gill
net attendance line along the eastern Pamlico Sound. Three separate issues were raised: 1)
modifications to the current small mesh gill net attendance line along the Outer Banks and 2)
small mesh gill net attendance requirements under the Pamlico Sound Gill Net Restricted Area
and 3) consideration for exemptions to small mesh attendance for deepwater areas within the
attendance line where red drum discards are minimal.
Gill netters fishing water bodies in eastern Pamlico Sound between Rodanthe and Gull
Island requested a slight m
odification to the current gill net attendance line to allow for
additional areas to be fished with small mesh gill nets without requiring that they be attended.
Gill netters fishing in the area of Hatteras requested consideration for allowing unattended small
mesh gill nets in a region near Olivers Reef if attendance was extended into November. The
Northeast Advisory Committee voted unanimously to request that NCDMF review these requests
as part of the FMP process. Additionally, at the April 2008 MFC meeting, the fishermen from
the areas of Hatteras and Ocracoke requested the DMF and the MFC consider allowing some
deep water small mesh gill netting with unattended nets in areas within the attendance line.
The current small mesh gill net attendance line (modified “No Trawl”) along the Outer
Banks region is designed to protect the shallow grass beds to the east while allowing fishers to
set nets in deep w
ater areas to the west (Figure 44). The protected area to the east of the line
includes shallow shoals and flats often characterized by dense SAV (submerged aquatic
vegetation, i.e. eelgrass, widgeon grass, etc.), and is the primary habitat for sub-legal red drum
along the Outer Banks. The current small mesh gill net attendance line in this area was
developed and modified by the NCDMF from the “No Trawl” line as listed in the current rules.
Later modifications were made, based on public comment, in areas where the “No Trawl” line
extended further out into the sound than necessary, possibly putting commercial fishers in the
direct path of working trawlers and outside of productive deep water fishing grounds. The DMF
considered the recommendations of local fishers in developing the gill net attendance line and
then made some additional modifications in order to straighten the line to relieve some of the
difficulty in enforcement.
Discussion
1) Modifications to the current small mesh gill net attendance line along the Outer Banks
During the 2001 Red Drum FMP process, modifications were made in response to
concerns raised by com
mercial fishers along the ‘Outer Banks’ during the development of the
current small mesh gill net attendance line,. The contention among these fishers was that the
original attendance area along the ‘Outer Banks’ extended to far offshore outside shallow areas,
unnecessarily forcing gill net fishers into less productive and potentially hazardous conditions
created by the deeper water. Modifications made addressed the majority of the concerns raised
and were considered a successful compromise in the approved plan. During the process of
developing Amendment 1 to the NC Red Drum FMP, additional concerns were raised in the
164
areas of Rodanthe to Gull Island and in the area of Hatteras, near Oliver Reef. NCDMF
investigated the proposed changes and is recom
mending to the NCMFC that the following
changes can be made without any substantive increase in red drum discards.
Area 1: Rodanthe to Gull Island
Gill netters fishing the area from Rodanthe to Gull Island have requested the
straightening of the attendance line along the area from
just south of Rodanthe channel to
Gull Island (Figure 44; Area 1). This rule change would require the removal of a single
point along the current gill net attendance line. Changing the line in this manner affords
additional access to productive fishing ground to the west of the line during the
attendance period. The change also makes it easier for gill netters in this area to know
they are in compliance with the rule by making it straight and therefore more easily
discerned on the water. The area to the west of this modified change consists primarily
of habitat that is deeper than where sub-legal red drum are typically captured and is not
likely to result in any substantive increase in discards.
Area 2: Hatteras, near Oliver Reef
Gill netters fishing in this region requested that the attendance line be moved inshore
from
its current location to allow for additional access to deep water fishing grounds
where attendance would not be required. NCDMF investigated the area and is
recommending that an additional area of deep water along Oliver Reef be excluded from
the attendance line (Figure 44; Area 2). The modification to the rule would extend the
current attendance line inshore from Beacon “36” to Beacon “35” along Rollinson
Channel where it would then run southwesterly to a “Danger” Beacon offshore of Austin
Reef before merging back with the current line. These changes would only exclude deep
water habitat and it has the added advantage of being clearly marked by visible beacons
on the water.
2) Small Mesh Gill Net Attendance Requirements under the Pamlico Sound Gill Net Restricted
Area
During 2000, the Pamlico Sound Gill Net Restricted Area (PSGNRA) was established by
National Marine Fisheries Service (NMFS) and created a perm
anent closure of Pamlico Sound to
large mesh gillnets (> 4 ¼ in. stretch mesh, FR Vol. 67, No 173 56931) from September 1 to
December 15 each year. The PSGNRA was established due to increased observations of sea
turtle strandings, and subsequent observed gillnet interactions in 1999 along the Outer Banks
(Gearhart 2001). NCDMF pursued and received a Section 10 Incidental Take Permit along the
mainland side and Outer Banks of Pamlico Sound to allow a limited, shallow water gillnet
fishery to continue to operate. The permit establishes conditions (e.g., restricted fishing areas,
reporting requirements, observer coverage) that must be met in order for the fishery to continue.
Habitat Conservation Plans (HCPs) within Section 10 Incidental Take Permit (ITP)
requires an extensive m
onitoring program in permitted area which has been in place since 2000.
165
The primary goal each year in the management of the PSGNRA is to monitor and reduce sea
turtle interactions in com
mercial gillnets with the assumption that these will result in decreased
sea turtle strandings in Pamlico Sound from September through December of each year. Fishery
management measures within HCPs restrict areas, seasons, gear, mandate observer coverage, and
require weekly reporting. These actions protect sea turtles, allow a limited shallow water gillnet
fishery, and characterize catch, effort, and bycatch along the Outer Banks and mainland side of
Pamlico Sound from September through December of each year.
One of the conditions of the current Section 10 ITP is that all small mesh gill nets fished
within the perm
itted area must be attended from September 15 through October 31 of each year.
This condition increases the attendance areas beyond those established by the 2001 NC Red
Drum FMP along the Outer Banks and forces fishermen out into deeper water during this period.
NCDMF has requested and the NMFS has agreed to allow NCDMF to manage small mesh gill
nets in this area through the current rule passed as part of the 2001 NC Red Drum FMP.
3) Consideration for exemptions to small mesh attendance for deepwater areas within the
attendance line.
The current attendance line, as previously stated, was designed to minimize the mortality
associated w
ith sub-legal red drum discards in the small mesh gill net fishery during the months
when discard rates and mortality are the highest. Several changes have been made to the
existing attendance line at the request of the public. Modifications, when made, have been
allowed in the past because the areas being excluded were not deemed as areas where red drum
interactions typically occur with gill nets. DMF has documented habitat types that are
commonly associated with red drum abundance along the Outer Banks region. The primary
factor associated with the presence of sub-legal red drum is shallow depth, although submerged
aquatic vegetation and close proximity to a shoreline tend to also be important. DMF data
indicate that red drum bycatch is highest in gill nets set in shallow water (<3 ft) and can be
significantly reduced by >90% when compared to nets set at depths of 6 feet or greater.
Gill netters asked DMF and MFC to consider allowing unattended gill nets to be set in
existing deep water habitats within the current attendance line. Based on com
ments received, the
majority of the small mesh effort in these areas would be directed at menhaden, bluefish, trout
and sea mullet in depths of 6 to 12 feet of water. Criteria for opening these areas would be an
average minimum depth of at least 6 feet in an area that is easily distinguished. Small deep
sloughs surrounded by shallow habitat would not be suitable candidates due to the difficulty in
enforcing and the increased potential for red drum interactions.
The primary area of concern expressed during public comment was for the deep water
habitat located betw
een Rollinson Channel and Cape Channel. These areas of deep water fall
within the current attendance line. NCDMF staff investigated this area to determine if
significant deep water areas existed that could be delineated without the inclusion of significant
shallow water habitat. The conclusion of this investigation was that while significant areas of
deep water are present, there are also significant areas of shoals and submerged aquatic
vegetation. There was no apparent way to delineate an area of deep water habitat without the

166
inclusion of considerable shallow water habitat. A second consideration, allowing unattended
gill nets to be set at a m
inimum depth (i.e. 7 ft), was not considered enforceable.
Figure 44. Map of the current gill net attendance area along the Outer Banks. The black-
dashed line denotes the m
odified attended gill net area (AGNA) along the Outer
Banks of Pamlico Sound. Proposed changes to “Area 1” near Rodanthe and “Area
2” behind Hatteras would allow for additional deep water areas to be fished outside
the attendance area.
167
Current Authority
North Carolina Fisheries Rules for Coastal Waters (15A NCAC)
03J.0103 Gill Nets, Seines, Identification, Restrictions
03R.0112 Attended Gill Net Areas
Management Options/Impacts
(+ potential positive impact of action)
(- potential negative impact of action)
1) No Action/Maintain current small mesh attendance line
+ Reduced bycatch of undersized red drum
+ Maintain established areas for attendance
- Potential economic burden for fishers
- More difficult to enforce/more difficult for gill netters to comply
2) Modify current attendance line in 15A NCAC 03R0.112 (b)(2) between Rodanthe and Gull
Island striking the point along the attendance line at the location described as ‘west of Salvo’ and
located at 35
° 32.6000' N - 75° 31.8500' W.
+ Increased area for small mesh gill nets to be set unattended
+ More protected from elements of open waters
+ Deeper area with less likelihood of red drum bycatch
+ Straight line easier to discern and enforce
- Potential that some additional red drum discards may occur
3) Modify current attendance line in 15A NCAC 03R0.112 (b)(2) in the area of Oliver Reef,
near Hatteras.
+ Increased area for small mesh gill nets to be set unattended
+ More protected from elements of open waters
+ Deeper area with less likelihood of red drum bycatch
+ Line easier to discern and enforce due to use of existing beacons
- Potential that some additional red drum discards may occur
4) Consider exempting large deepwater areas within the current attendance area along the Outer
Banks.
+ Increased area for small mesh gill nets to be set unattended
+ More protected from elements of open waters
- Very difficult to enforce
- Potential for some increased red drum discards
Management Recommendations
168
RDAC - Modify current attendance line in 15A NCAC 03R0.112 (b)(2) between
Rodanthe and Gull Island striking the point along the attendance line at the
location described as ‘west of Salvo’ and located at 35
° 32.6000' N - 75°
31.8500' W.
DMF - Modify current attendance line between Rodanthe and Gull Island striking the
point along the attendance line at the location described as ‘west of Salvo’
and located at 35
° 32.6000' N - 75° 31.8500' W and modify current
attendance line in 15A NCAC 03R0.112 (b)(2) in the area of Oliver Reef,
near Hatteras.
MFC Selected Management Option
Modify current attendance line between Rodanthe and Gull Island striking the
point along the attendance line at the location described as ‘west of Salvo’ and
located at 35° 32.6000' N - 75° 31.8500' W and modify current attendance line in
15A NCAC 03R0.112 (b)(2) in the area of Oliver Reef, near Hatteras.
Other actions being taken by NCDMF:
For the period of September 1 to October 31, NCDMF asked NMFS to consider allowing the gill
net attendance line established in 15A NCAC 03R0.112 (b)(2) to be the area where sm
all mesh
gill net attendance is required as opposed to the PSGNRA that has been used (see part (2) of
discussion above). NMFS had no objection to this request and DMF was allowed to make this
change without violating the current Section 10 ITP issued by NMFS. The changes were made
effective with the 2008 fishing year through proclamation authority.
169
11. MANAGEMENT PROGRAM
A management program has been developed in an effort to meet the goals and objectives
of
this FMP as listed in Section 4.2. This section outlines the need for additional data in order to
improve our ability to assess the status of the red drum stocks, details the selected management
strategy as approved by the NC MFC, and summarizes the research needs covered in this plan.
11.1 Data Needs
Additional data are needed to improve red drum stock assessments, to better evaluate the
ef
fects of current management actions, and to identify additional management actions that will
allow for the long-term sustainability of the North Carolina red drum stock. A listing of data
needs, based on reviews by Vaughan and Carmichael (2000) and Takade and Paramore (2007) is
provided below.
1. Improved Fishery-Dependent Sampling.
Currently available catch statistics may not be complete for a number of reasons that are
described in detail below. Failure to account for all removals from the population, and to
properly allocate harvest and discard losses into size and age categories, contributes to
uncertainty and bias in stock assessment results. In addition, adequate monitoring of non-harvest
losses is necessary to develop management measures that prevent waste.
There is limited sampling of at-sea discarding in commercial fisheries which should be
continued and expanded. Although red drum
are considered a bycatch species, as noted in the
description of commercial fisheries (Section 7.1), they are encountered by many different
fisheries throughout the state. Given the restrictive allowable harvest of red drum, the mortality
associated with discarding by these fisheries represents a potentially significant, but largely
unknown, removal from the population. In addition to estimates of total removals, data are also
needed on the size and age distribution of bycatch losses.
Sampling of the recreational fishery should be im
proved. Recreational harvest accounts
for greater than half of the total North Carolina harvest each year, so reliable and precise
estimates of total harvest and adequate characterization of the length, weight, and age
composition of the harvest are crucial. The number of MRFSS intercepts should be increased,
collection of biological samples from the recreational harvest should be improved, and additional
sampling, especially at night when many directed recreational trips occur, should be pursued.
Data on the length distribution of recreational discards is severely needed. Although important
for many species, this is especially critical for red drum because of both the steadily increasing
proportion of red drum that are released and the nature of the management program. Since red
drum are managed through a possession limit and a slot size limit, red drum may be discarded
that are below the minimum size, above the maximum size, or in excess of the possession limit.
Methods for determining size distribution on an annual basis should be investigated.
170
2. Improved Fishery-Independent Sampling
Surveys at age are needed to better monitor the abundance of red drum. Prior
assessments on red drum in North Carolina have utilized the red drum juvenile abundance index
generated from the NCDMF Red Drum Seine Program. More recently, NCDMF initiated an
independent gill net survey in estuarine waters designed to provide an index of abundance for
sub-adult red drum in North Carolina. Sampling of sub-adults should improve estimates of
recruitment and better warn of recruitment failure and could provide more accurate data for
estimates of SPR and escapement. The index generated from this survey was used in the most
recent stock assessment. Sampling of the adult population is needed to provide data on the age
structure of the population and long-term sampling could possibly provide an index of the
spawning stock that could potentially be used to estimate spawning stock abundance and
biomass. During 2007, NCDMF initiated a Red Drum Longline Survey designed to provide an
index of abundance of adult red drum over time. As with all monitoring studies, the strength of
the data is dependent upon maintaining a long-term database to track changes over time.
3. Improved Estimates of Vital Rates
Assessment and population model results are sensitive to input parameters such as natural
mortality, fecundity, and growth rates. Research should be directed at estimating these important
vital rates for red drum in North Carolina.
4. Improved Tagging Programs
Red drum tagging programs have been conducted by DMF for many years. Recent
improvements in modeling techniques have made this data useful in providing estimates of both
the selectivity and fishing mortality rates of red drum at age (Bacheler et al. 2007). Selectivity
patterns estimated from North Carolina’s tagging data were used in the most recent assessment
to provide critical information on the length frequency of red drum released in the recreational
fishery (Burdick et al. 2007). Estimates of mortality rates calculated from well designed tagging
studies could provide a useful complement to traditional assessment techniques, particularly for
red drum, where results are complicated by the lack of an adult index, a high proportion of
captured and released fish, and an atypical dome shaped selectivity curve centered around
juvenile fish. In the future, tagging studies conducted by North Carolina should be better
designed to limit potential biases and improve mortality estimates. In particular, studies should
include methods to estimate the non-reporting rate of tag recaptures, tag loss rates over time and
the mortality associated with the tagging event. Additionally, effort should be made to ensure
proper mixing of tagged individuals into the population.
171
11.2 Management Strategies and Proposed Actions
Listed below are the management strategies as selected from each of the management issues in
Section 10.2. Each numbered strategy is followed by a reference to the Principal Issue and
Management Option section that supports it, e.q. (10.1.1) and the Objectives from Section 4.2
that it addresses, e.q. [2,3]. Changes to the current rules required to implement these actions are
found in Appendix 1.
11.2.1 Adult Harvest Limits
Issue: The potential modification of the rule prohibiting the harvest and possession of red drum
greater than 27 inches in total length.
Management Options:
1) Status quo (prohibit all possession and sale of red drum >27 in TL)
2) Trophy fishery (1 fish 55 in TL or greater) through the use of a trophy tag
3) Special Permit to retain 1 fish > 27 in TL
4) Harvest of adults (>27 in TL) while maintaining a 30% SPR threshold
5) No harvest of adults (>27 in TL) while maintaining a 40% SPR target
Management Recommendations
DMF and RDAC
- Status quo (no harvest over 27 inches TL)
MFC Selected Management Strategy
Selects DMF and RDAC recommendation.
(Section 10.2.1), [Objectives 1,2]
11.2.2 Recreational Targeting of Adult Red Drum
Issue: The directed recreational catch and release fishery for adult red drum and the concerns and
potential risks of this fishery.
Management Options:
1) Status quo (prohibit all possession and sale of red drum >27 in TL)
2) Trophy fishery (1 fish 55 in TL or greater) through the use of a trophy tag
3) Special Permit to retain 1 fish > 27 in TL
172
4) Harvest of adults (>27 in TL) while maintaining a 30% SPR threshold
5) No harvest of adults (>27 in TL) while maintaining a 40% SPR target
Management Recommendations
DMF and RDAC
- Status quo (no harvest over 27 inches TL)
MFC Selected Management Strategy
Selects DMF and RDAC recommendation.
(Section 10.2.2), [Objectives 1, 2 and 5]
11.2.3 Recreational Bag and Size Limits
Issue: The recreational bag limit for red drum is currently 1 fish per person per day from 18 to 27
inches TL. The North Carolina fishery management plan for red drum may consider options to
modify the current bag limit and other recreational management measures.
Management Options:
1) Status quo (1 fish 18-27 inches TL)
2) Increase the bag limit and change size range
Management Recommendations
DMF and RDAC
- Status quo (1 fish 18-27 inches TL)
MFC Selected Management Strategy
Selects DMF and RDAC recommendation.
(Section 10.2.3), [Objectives 1, 2 and 4]
11.2.4 Commercial Harvest Limits
Issues: Can the current bycatch allowance in the Red Drum FMP of 7 fish be increased?
Avoiding closures in the commercial red drum bycatch fishery.
Management Options:
1) Status quo (7 fish limit with 50% bycatch provision, DMF Director maintains proclamation
173
authority to increase trip limit and adjust the bycatch provision as needed)
2) Increase the bycatch allowance
3) Allow for possession of some red drum while actively fishing gear even if adequate finfish
(excluding m
enhaden) have not yet been obtained.
4) Allow for the possession of some red drum without requiring that they be bycatch
(Exam
ple would be to allow three red drum to be landed without requiring other finfish to
be present; additional landed red drum would be subject to bycatch provision)
5) Implement a split season on the commercial fishing year, capping the period of September
1 to April 30 at 150,000 lb and conserving the rem
aining portion of the cap (100,000 lb)
for the period of May 1 to August 31. Unused cap in Period 1 can be carried forward to
Period 2.
Management Recommendations:
DMF and RDAC –
1) Status quo (7 fish trip limit with 50% bycatch provision). Director retains authority to
modify the trip limit and bycatch provisions as needed.
2) Allow for the possession of up to 3 fish while engaged in red drum without requiring
that they be subject to the 50% bycatch provision. Upon landing/sale all red drum
possessed would be subject to any bycatch requirements.
3) Implement a split season on the commercial fishing year, capping the period of
September 1 to April 30 at 150,000 lb and conserving the remaining portion of the cap
(100,000 lb) for the period of May 1 to August 31. Unused cap in period 1 can be
carried forward to period 2. Any annual commercial harvest limit that is exceeded one
year will result in the poundage overage being deducted from the subsequent year’s
commercial harvest limit.
MFC Selected Management Strategy
Selects DMF and RDAC recommendations.
(Section 10.2.4), [Objectives 1, 2, 4 and 5]

174
11.2.5 Bycatch in the Estuarine Gill Net Fishery
Issue: The occurrence and magnitude of regulatory and unmarketable red drum discards in the
estuarine gill net fishery.
Management Options:
Set small mesh (<5 inches stretch) estuarine gill net management options:
1) Status quo
2) Extend attendance duration
3) Extend attendance areas
4) Require minimum depth for the use of set small mesh gill nets
5) Require minimum distance from shore for the use of set small mesh gill nets
Set large mesh (>5 inches stretch) estuarine gill net management options:
1) Status quo
2) Require attendance seasons
3) Require nets to be set at a minimum distance from shore
4) Require nets to be set at a minimum depth of water
Management Recommendations:
DMF Recommendation
Small Mesh (<5” stretch mesh)
Year-round attendance requirements:
Extend attendance within 200 yards of shore to include the area of the lower Neuse out to the mouth
of the river.
Seaasonal attendance requirements:
Modify the seasonal attendance requirements for small mesh gill nets (currently May 1 to October
31) to include the period of May 1 through November 30 in:
1) all primary and permanent secondary nursery
areas and all modified no-trawl areas
(shallow grass beds in eastern Pamlico and Core Sound)
2) Within 200 yards of any shoreline for the areas of Pam
lico, Pungo, Neuse, and Bay
Rivers
3) Within 50 yards of any shoreline in areas of Pam
lico and Core Sound and in all coastal
waters south to NC/SC line
4) Area from HWY 58 bridge south is excluded from
shoreline requirement during October
and November
Large Mesh (>5” stretch mesh)
Require all unattended large mesh gill nets to be set a minimum of 10 yards from any shoreline from

175
June through October
RDAC Recommendation
Small Mesh (<5” stretch mesh)
Year-round attendance requirements:
Extend attendance within 200 yards of shore to include the area of the lower Neuse out to the
mouth of the river (and)
Require year-round attendance of small mesh nets in Primary and Permanent Secondary Nursery
Areas north of the Wainwrights in Carteret County
and exempting the Albemarle Sound
Management Area
Seaasonal attendance requirements:
Modify the seasonal attendance requirements for small m
esh gill nets (currently May 1 to October
31) to include the period of May 1 through November 30 in:
1) all primary and permanent secondary nursery areas
2) all modified no-trawl areas (shallow grass beds in eastern Pam
lico and Core Sound)
3) all areas within 200 yards of any shoreline, exem
pting the areas of Core Sound and south
from the 200 yards of any shoreline requirement during the months of October and
November
Large Mesh (>5” stretch mesh)
Require all unattended large mesh gill nets to be set a m
inimum of 10 yards from any shoreline
MFC Selected Management Strategy
Small Mesh (<5” stretch mesh)
Year-round attendance requirements:
Extend attendance within 200 yards of shore to include the area of the lower Neuse out to
the mouth of the river.
Seaasonal attendance requirements:
Modify the seasonal attendance requirements for small mesh gill nets (currently May 1 to
October 31) to include the period of May 1 through Novem
ber 30 in:
5) all primary and permanent secondary nursery areas and all modified no-trawl areas
(shallow grass beds in eastern Pamlico and Core Sound)
6) Within 200 yards of any shoreline for the areas of Pamlico, Pungo, Neuse, and Bay Rivers
7) Within 50 yards of any shoreline in areas of Pamlico and Core Sound and in all coastal
waters south to NC/SC line
8) Area from Core Sound and south is excluded from shoreline requirement during October
and Novem
ber
Large Mesh (>5” stretch mesh)
Require all unattended large mesh gill nets to be set a minimum of 10 yards from any
shoreline from June through October
(Section 10.2.5), [Objectives 1, 2 and 5]
176
11.3 Habitat and Water Quality Management Recommendations
At the state level, North Carolina has developed a strategy to protect and restore habitats critical
to North Carolina’s coastal fishery resources through the im
plementation of the Coastal Habitat
Protection Plan (CHPP). This plan recognizes those habitats that have been identified to provide
critical habitat functions or that are particularly at risk due to imminent threats, vulnerability or
rarity. Areas meeting these criteria are to be designated as “Strategic Habitat Areas” (SHAs) and
given the highest priority for protection. In addition to its overall goals, the CHPP has specific
recommendations that will benefit habitat used by red drum. Additional red drum habitat
research needs identified in this Red Drum FMP Amendment are:
• Determine juvenile habitat preference and examine if recruitment is habitat limited.
• Examine ecological use and importance of shell bottom to red drum.
• Identify coastal wetlands and other habitats utilized by juvenile red drum and assess
relationship between changes in recruitment success and changes in habitat conditions.
• Assess cumulative impact of large-scale beach nourishment and inlet dredging on red
drum and other demersal fish that use the surf zone.
• Determine location and significance of spawning aggregation sites throughout the coast.
• Determine if navigational dredging between August and October significantly impacts
spawning activity.
• Determine if designation of spawning areas by MFC is needed, and if specific protective
measures should be developed.
(Section 9.0), [Objective 6]
11.4 Research Needs Summary
The following research needs were compiled from those listed in the issue papers in
Section 10.0 as w
ell as those outlined in Section 11.1 Data Needs. Improved management of red
drum is dependent upon research needs being met. Research needs are not listed in order of
priority.
• Assess the size distribution of recreational discards.
• Improved catch and effort data for the red drum recreational fishery, particularly for the
fishery that occurs at night.
• Development of independent surveys to monitor both the sub-adult and adult red drum
populations. (Underway).
• Improved length frequency data for adult red drum in the recreational and commercial
fisheries.
177
• Conduct studies to determine the magnitude of red drum interactions and discards in the
small mesh gill net fishery from Core Sound and south during November and December.
• Continue tagging efforts of adult red drum through the NCDMF Volunteer Tagging
Program.
•
Update and/or continue to monitor age, growth and maturity data for the red drum.
• Conduct studies on the diet of red drum in North Carolina.
• Further identification of the spawning areas for adult red drum in North Carolina.
• Economic analysis of the adult red drum fishery.
• Improved social and economic data collection on the recreational and commercial fishery,
including information on current conflicts and the potential for future conflicts in this
fishery.
• Characterize the trophy recreational fishery (tackle, geographic location, bait, water
temperature, seasonality, hook types, etc.).
• Incorporate information on conservative angling practices for red drum into future fishing
guides and make the information available on the NCDMF website.
• Expand independent gill net survey to other parts of the state.
• Continue and expand estuarine gill net observer program to collect data across various key
fisheries by season and area.
• Collect data from the observer program or through other sources on the catch rates of red
drum and targeted species with regard to distance from shore in estuarine gill nets.
• Conduct a comprehensive survey of gill net fishers including information on species
targeted, gear characteristics, areas fished.
• Conduct studies that explore ways to reduce red drum interactions with commercial gear
while allowing for retention of targeted species.
• Conduct additional research to determine the release mortality of red drum captured in gill
nets.
• Continue and enhance collection of fishery dependent data.
• Continue and improve tagging studies to estimate mortality rates in the red drum fishery.
11.5 Review Cycle
As provided in the Fisheries Reform Act of 1997, the Red Drum
Fishery Management Plan will
be reviewed and revised at least every five years with the support of advisors.
178
12. LITERATURE CITED
Aguilar, R. 2003. Short-term post-hooking mortality and m
ovement of adult red drum in the Neuse
River, North Carolina. MS, North Carolina State University, Raleigh, NC. 138 p.
Atlantic States Marine Fisheries Commission (ASMFC). 1984. Fishery Managem
ent Plan for
Red Drum. Fisheries Management Report No. 5. ASMFC, Washington, DC. 107 p.
Atlantic States Marine Fisheries Commission (ASMFC). 1994. Fishery Managem
ent Plan for
Red Drum – Amendment # 1. Fisheries Management Report No. 19. ASFMC,
Washington, DC, 123 p.
Atlantic States Marine Fisheries Commission (ASMFC). 1999. ASMFC guidelines for
evaluating fishing gear im
pacts to submerged aquatic vegetation and determining
mitigation strategies. ASMFC, Washington, DC. 34p.
Atlantic States Marine Fisheries Commission (ASMFC). 2000. Evaluating fishing gear im
pacts
to submerged aquatic vegetation and determining mitigation strategies. ASFMC Habitat
Management Series 5, 38p.
Atlantic States Marine Fisheries Commission (ASMFC). 2002. Am
endment 2 to the Interstate
fishery management plan for red drum. Fisheries Management Report No. 38. Atlantic
States Marine Fisheries Commission, Washington, DC. 142 p.
Atlantic States Marine Fisheries Commission (ASMFC). 2006. 2006 Review of the ASMFC fishery
m
anagement plan for red drum (
Sciaenops ocellatus). Atlantic States Marine Fisheries
Commission, Washington, DC. 16 p.
Atlantic States Marine Fisheries Commission (ASMFC). 2007. The importance of habitat
created by m
olluscan shellfish to managed species along the Atlantic coast of the United
States. ASMFC, Washington, DC, ASMFC Habitat Management Series #8, 128p.
Auster, P. J. and R.W. Langton. 1999. The effects of fishing on fish habitat. p. 150-187
in L.
Benaka (ed.). Fish habitat: essential fish habitat and rehabilitation. American Fisheries
Society, Bethesda, Md. Symp. 22, 459p.
Bacheler, N. M. , J. E. Hightower, L. M. Paramore, J. A. Buckel, and K. H. Pollock. 2008.
An
age-dependent tag return model for estimating mortality and selectivity of an estuarine-
dependent fish with high rates of catch and release. Transactions of the American
Fisheries Society 137:1422-1432.
Bacheler, N.M., L.M. Paramore, J.A. Buckel. In Press. Abiotic and biotic factors influence the
habitat use of an estuarine fish. Marine Ecology Progress Series.
Bahr, L. M. and W. P. Lanier. 1981. The ecology of intertidal oyster reefs of the south Atlantic
coast: a com
munity profile. US Fish and Wildlife Service, Washington, DC,
FWS/OBS/81.15. 105 p.
Bales, J. D. and D.J. Newcomb. 1996. North Carolina wetland resources. p. 297-302
in R.M.
Hirsch (dir). National Water Summary on Wetland Resources. U.S. Geological Survey,
Atlanta, GA, USGS Water-Supply Paper 2425.
179
Baltz, D. M., J. W. Fleeger, C. R. Rakocinski, and J. N. McCall. 1998. Food, density, and
m
icrohabitat: factors affecting growth and recruitment potential of juvenile saltmarsh
fishes. Environmental Biological Fisheries 53(1): 89-103.
Barrios, A. T. 2004. Use of passive acoustic monitoring to resolve spatial and temporal patterns
of spanwing activity for red drum
,
Sciaenops ocellatus, in the Neuse River Estuary,
North Carolina. MS, NCSU, Raleigh, NC, 97p.
Barrios Beckwith, A.T., G.H. Beckwith, Jr., and P.S. Rand. 2006. Identification of critical s
pawning
habitat and male courtship vocalization characteristics of red drum,
Sciaenops ocellatus, in
the lower Neuse River estuary of North Carolina. North Carolina Sea Grant Fishery
Research Grant Program, Final Report 05-EP-05. 39 p.
Beckwith, Jr., G.H. and P.S. Rand. 2004a. Investigating post-hooking recovery and m
ortality of red
drum in the Neuse River. North Carolina Sea Grant Fishery Research Grant Program, Final
Report 02-FEG-03. 31 p.
Beckwith, Jr., G.H. and P.S. Rand. 2004b. Large circle hooks and short leaders with fixed weights
reduce incidence of deep hooking in angled adult red drum
. Fisheries Research. 71(2005)
115-120.
Brown, C. A., G.A. Jackson, S.A. Holt, and G.J. Holt. 2005. Spatial and temporal patterns in
m
odeled particle transport to estuarine habitat with comparisons to larval fish settlement
patterns. Estuarine, coastal, and shelf science 64(1): 33-46.
Brown, S. S., G.R. Gaston, C.F. Rakocinski, and R.W
. Heard. 2000. Effects of sediment
contaminants and environmental gradients on macrobenthic community trophic structure
in Gulf of Mexico estuaries. Estuaries 23(3): 411-424.
Buckel, J.A., R.J. Hines, and T.C. McArthur, Jr. 2006. Incidental catch and discard of red drum
,
Sciaenops ocellatus, in a large mesh Paralichthyidae gillnet fishery: experimental
evaluation of a fisher’s experience at limiting bycatch. Fisheries Management and
Ecology 13: 1-7.
Burdick, S.M., J.E. Hightower, J.A. Buckel, L.M. Paramore and K.H. Pollock. 2007. Movement
and selectivity of red drum
and survival of adult red drum: an analysis of 20 years of
tagging data. Completion Report. North Carolina Division of Marine Fisheries,
Morehead City, NC. 85 p.
Buzzelli, C. P., R.A. Luettich Jr., S.P. Powers, C.H. Peterson, J.E. McNinch, J.L. Pinckney, and
H.W
. Paerl. 2002. Estimating the spatial extent of bottom water hypoxia and habitat
degradation in a shallow estuary. Marine ecology progress series 230: 103-112.
Cahoon, L. B., M.H. Posey, T.D. Alphin, D. Wells, S. Kissling, W
. H. Daniels, and J. Hales.
2002. Shrimp and crab trawling impacts on estuarine soft-bottom organisms. UNC-
Wilmington, Wilmington, NC, 17p.
Carraway, R. J. and L.J. Priddy. 1983. Mapping of subm
erged grass beds in Core and Bogue
Sounds, Carteret County, North Carolina, by conventional aerial photography. CEIP
Report No. 20, 88p.
180
Chmura, G. L. and N.W. Ross. 1978. Environmental impacts of marinas and their boats. Rhode
Island Sea Grant, Narragansett, RI, P675; RIU-T-78-005.
COE (US Army Corps of Engineers). 2001. The New York District's biological m
onitoring
program for the Atlantic coast of New Jersey, Asbury Park to Manasquan section beach
erosion control project. USACOE, Vicksburg, MS, Final report , 103p.
COE (US Army Corps of Engineers). 2003. Effects of dredged m
aterial beach disposal on surf
zone and nearshore fish and benthic resources on Bald Head Island, Caswell Beach, Oak
Island, and Holden Beach, North Carolina: Interim study findings. Versar, Inc.,
Columbia, Md.
Coen, L. D., M.W. Luckenbach, and D.L. Breitburg. 1999. The role of oyster reefs as essential
fish habitat: a review of current knowledge and som
e new perspectives. p. 438-454
in
L.R. Benaka (ed). Fish habitat: Essential fish habitat and rehabilitation. American
Fisheries Societs, Bethesda, Md, Symposium 22, 459 p.
Collie, J. S., G.A. Escanero, and P.C. Valentine. 1997. Effects of bottom fishing on the benthic
m
egafauna of Georges Bank. Marine Ecology Progress Series 155: 159-182.
Connell, B. and T. Murphey. 2004. A preliminary evaluation on the effects of dock shading on
density and coverage of shoal grass (
Halodule wrightii). DENR, DMF, Morehead City,
NC, 13p.
Cooper, S. R. and G.S. Brush. 1991. A 2500 year history of anoxia and eutrophication in the
Chesapeake Bay. Science 254: 992-1001.
Cross, F. A., D.S. Peters, and W.E. Schaaf. 1985. Implications of waste disposal in coastal
waters on fish populations. Aquatic Toxicology and Hazard Assessm
ent: Seventh
Symposium, American Society for Testing and Materials, Philadelphia, PA. 383-399.
Currie, D. R. and G.D. Parry. 1996. Effects of scallop dredging on a soft sedim
ent community: a
large-scale experimental study. Marine Ecological Progress Series. 134: 131-150.
Dahl, T. E. 1990. Wetlands - losses in the United States, 1780's to 1980's. U.S. Fish and Wildlife
Service, W
ashington, D.C., Report to Congress, 13p.
Daniel, L. B. III. 1988. Aspects of the biology of juvenile red drum,
Sciaenops ocellatus and
spotted seatrout,
Cynoscion nebulosus (Pisces: Sciaenidae) in South Carolina. M. S.
Thesis, College of Charleston, 58 p.
Dauer, D. M., J.A. Ranasinghe, and S.B. Weisberg. 2000. Relationships between benthic
com
munity condition, water quality, sediment quality, nutrient loads, and land use
patterns in Chesapeake Bay. Estuaries 23(1): 80-96.
Davis, G. J. and M.M. Brinson. 1990. A survey of submersed aquatic vegetation of the
Currituck Sound and the W
estern Albemarle-Pamlico estuarine system. DNRCD,
Albermarle-Pamlico Estuarine Study Project No. 89-10, 135p.
DEHNR (NC Dept. of Environment Health and Natural Resources). 1990. North Carolina
coastal m
arinas: water quality assessment. DEHNR, Raleigh, NC, 90-01, 69p.
181
DMF (North Carolina Division of Marine Fisheries). 1990. Justification for subm
erged aquatic
vegetation critical habitat designation. DMF , Unpub. rep. 15p.
DMF (North Carolina Division of Marine Fisheries). 2001a. North Carolina oyster fishery
m
anagement plan. N.C. Department of Environment and Natural Resources, Division of
Marine Fisheries, 225 p.
DMF (North Carolina Division of Marine Fisheries). 2006. North Carolina shrim
p fishery
management plan. NC DMF, Morehead City, NC.
Donoghue, C. R. 1999. The influence of swash processes on
Donax variabilis and Emerita
talpoida. PhD Dissertation, University of Virginia, Charlottesville, Va, 197 p.
Durako, M. J. 1994. Seagrass die-off in Florida Bay (USA): changes in shoot dem
ographic
characteristics and population dynamics in
Thalassia testudinum. Marine Ecology
Progress Series 110: 59-66.
DWQ (North Carolina Division of Water Quality). 2000a. Water quality progress in North
Carolina in 1998-1999, 305(b) report. DENR, Division of W
ater Quality, Raleigh, NC,
34p.
DWQ (North Carolina Division of Water Quality). 2000b. A citizen's guide to water quality
m
anagement in North Carolina. DENR, Div. Water Quality, Planning Branch, Raleigh,
NC, 156p.
DWQ (North Carolina Division of Water Quality). 2002a. Neuse River Basinwide Water
Q
uality Plan. N.C. Department of Environment and Natural Resources, Raleigh, NC,
http://h20.enr.state.nc.us/nepp.
DWQ (North Carolina Division of Water Quality). 2002b. Pasquotank River Basinwide Water
Q
uality Plan. N.C. Department of Environment and Natural Resources, Raleigh, NC,
http://h20.enr.state.nc.us/nepp.
DWQ (North Carolina Division of Water Quality). 2003. Lumber River Basinwide Water
Q
uality Plan. N.C. Department of Environment and Natural Resources, Raleigh, NC,
http://h20.enr.state.nc.us/nepp.
DWQ (North Carolina Division of Water Quality). 2004. Tar-Pamlico River Basinwide Water
Q
uality Plan. N.C. Department of Environment and Natural Resources, Raleigh, NC,
http://h20.enr.state.nc.us/nepp.
DWQ (North Carolina Division of Water Quality). 2005. Cape Fear River Basinwide Water
Q
uality Plan. N.C. Department of Environment and Natural Resources, Raleigh, NC,
http://h20.enr.state.nc.us/nepp.
DWQ (North Carolina Division of Water Quality). 2006. Annual report of fish kill events, 2006.
D
ivision of Water Quality, Raleigh, NC.
DWQ (North Carolina Division of Water Quality). 2007. White Oak River basinwide water
quality plan. N
.C. Department of Environment and Natural Resources, Raleigh, NC.
182
Dyer, K. R. and R.J. Orth. 1994. Changes in fluxes in estuaries: implications from science to
m
anagement. Olsen and Olsen, Fredenburg, Denmark.
Eby, L., L. Crowder, and C. McClellan. 2000. Neuse River estuary modeling and monitoring
project Stage 1: ef
fects of water quality on distribution and composition of the fish
community. Water Resources Research Institute, Raleigh, NC, Report N. 325-C, 2p.
EEP (Ecosystem Enhancement Program). 2006. 2005-2006 Annual report. EEP, Raleigh, NC,
17p.
EPA (U.S. Environmental Protection Agency). 2001. Hydrom
odification chapter factsheet.
http://www.epa.gov/OWOW/NPS/MMGI/hydro.html, 12/2001.
Feierabend, S. J. and J.M. Zelazny. 1987. Status report on our nation's wetlands. National
W
ildlife Federation, Washington, D.C., 50p.
Ferguson, R. L. and L.L. Wood. 1994. Rooted vascular aquatic beds in the Albemarle-Pamlico
estuarine system
. NMFS, NOAA, Beaufort, NC, Project No. 94-02, 103 p.
Fonseca, M. S. 1996a. The role of seagrasses in nearshore sedimentary processes: a review. p.
261-286
in C. Roman and K. Nordstrom (eds). Estuarine Shores: Hydrological,
Geomorphological and Ecological Interactions. Blackwell, Boston, MA.
Funderburk, S. L., J.A. Mihursky, S.J. Jordan, and D. Riley. 1991. Habitat requirements for
Chesapeake Bay living resources. Habitat Objectives W
orkgroup, Living Resources
Subcommittee and Chesapeake Research Consortium with assistance from Maryland
Department of Natural Resources, Solomons, MD.
Garbisch, E. W., P.B. Woller, W.J. Bostian, and R.J. McCallum. 1973. Biotic techniques for
shore stabilization. p. 405-407
in L.E. Cronin (ed.). Estuarine Research. Academic
Press Inc., New York, NY, II.
Gearhart J. 2001. Sea turtle bycatch monitoring of the 2000 fall flounder gillnet fishery of
southeastern Pam
lico Sound, North Carolina. Completion Report for ITP 1259. North
Carolina Department of Environment and Natural Resources, Division of Marine
Fisheries. 26pp.
Goldsborough, W. J. and W.M. Kemp. 1988. Light responses of submersed macrophytes:
im
plication for survival in turbid waters. Ecology 69: 1775-1786.
Grabowski, J. H., D. Pettipas, M.A. Dolan, A.R. Hughes, and D.L. Kimbro. 2000. The economic
and biological value of restored oyster reef habitat to the nursery f
unction of the estuary.
NC Sea Grant, Morehead City, NC, FRG # 97-EP-6, 29p.
Graff, L. and J. Middleton. 2003. Wetlands and fish: catch the link. NOAA, National Marine
Fisheries Service, Silver Springs, MD, 48p.
Gray, J. S., R. S. Wu, and Y.Y. Or. 2002. Effects of hypoxia and organic enrichm
ent on the
coastal marine environment. Marine Ecology Progress Series 238: 249-279.
183
Guthrie, J. F. and C. W. Lewis. 1982. The clam
-kicking fishery of North Carolina. Marine
Fisheries Review 44(1): 16-21.
Haab, T. , J. Whitehead, and Ted McConnell. The Economic Value of Marine Recreational
Fishing in the Southeast United States: 1997 Southeast Econom
ic Data Analysis.,
National Marine Fisheries Service, Southeast Regional Office, St. Petersburg, FL. 2000.
Hackney, C. T., J. Grimley, M. Posey, T. Alphin, and J. Hyland. 1998. Sedim
ent contamination
in North Carolina's estuaries. Center for Marine Science Research, UNC-W, Wilmington,
NC, Publication #198, 59p.
Hackney, C. T., M.H. Posey, S.W. Ross, and A.R. Norris. 1996. A review and synthesis of data
on surf zone fishes and invertebrates in the South Atlantic Bight and the potential im
pacts
from beach renourishment. Prepared for Wilmington District, US Army Corps of
Engineers. UNC-Wilmington, Wilmington, NC, 111 p.
Hare, J. O., J.A. Quinlan, F.E. Werner, B.O. Blanton, J.J. Govini, R.B. Forward, L.R. Settle, and
D.E. Hoss. 1999. Larval transport during winter in the SABRE study area: results of a
coupled vertical larval behavior-three-di
mensional circulation model. Fisheries
Oceanography. 8(2): 57-76.
Hassell, J. 2007. Characterization of flounder gill net fishing techniques and bycatch in the
Pam
lico river. North Carolina Sea Grant Fishery Research Grant Program, Final Report
06-FRG-04. 52 p.
Hawkins, J. H. 1980. Investigations of anadromous fishes of the Neuse River, North Carolina.
DMF, Morehead City, NC, Special Science Report No. 34, 111p.
Heath, R. C. 1975. Hydrology of the Albemarle-Pam
lico region, North Carolina: a preliminary
report on the impact of agricultural developments. US Geological Survey Water
Resources Investigations 80(44): 1-85.
Hettler, W. F. and A.J. Chester. 1990. Temporal distribution of ichthyoplankton near Beaufort
Inlet, North Carolina. Marine Ecology Progress Series 68: 157-168.
Holt, S. A., G.J. Holt, and C.R. Arnold. 1989. Tidal stream transport of larval fishes into non-
stratified estuaries. p. 100-104
in J.H.S. Blaxter, J. C. Gamble J. Westernhagen. The
early life history of fish. The third ICES Symposium, Bergen, 3-5 October 1988.
International Council for the Exploration of the Sea, Bergen.
Iannuzzi, T. J., M.P. Weinstein, K.G. Sellner, and J.C. Barrett. 1996. Habitat disturbance and
m
arina development: An assessment of ecological effects. I. Changes in primary
production due to dredging and marina construction. Estuaries 19(2A): 257-271.
IMPLAN PRO version 2.0 (2000). Stillwater, MN: Minnesota IMPLAN Group.
IPPC (Intergovenrmental Panel on Climate Change). 2002. Clim
ate Change 2001: Synthesis
report. Cambridge University Press, Cambridge, England.
Johnson, J. C., and M. K. Orbach. 1996. Effort management in North Carolina fisheries: a total
system
s approach. Fisheries Research Reports to the Fisheries Moratorium steering
184
Committee, North Carolina Sea Grant College Program, UNC-SG-96-08, Institute for
Coastal and Marine Resources East Carolina University, Technical Report 96-07.
Jutte, P. C., R.F.Van Dolah, and M.V.Levison . 1999. An environmental monitoring study of the
Myrtle Beach renourishing project: intertidal benthic com
munity assessment. Phase II-
Myrtle Beach. Final Report, prepared by Marine Resources Division; submitted to US
Army Corps of Engineers. SC Department of Natural Resources, Charleston, SC, 34p.
Kenworthy, W. J. and D.E. Haunert. 1991. The light requirem
ents of seagrasses: proceedings of
a workshop to examine the capability of water quality criteria, standards and monitoring
progress to protect seagrasses. National Oceanic and Atmospheric Administration,
Beaufort, NC, Tech. Memo. NMFS-SEFC-287, 181p.
Kirby, J., W. Maher, and F. Krikowa. 2001. Selenium, cadmium, copper, and zinc
concentrations in sedim
ents and mullet (
Mugil cephalus) from the southern basin of Lake
Macquarie, NSW Australia. Archives of environmental contamination and toxicology
40(2): 246-256.
Knutson, P. L. 1977. Planting guidelines for m
arsh development and bank stabilization. US
Army Corps of Engineering Research Center, Fort Belvoir, Va.
Laney, R. W. 1997. The relationship of submerged aquatic vegetation (SAV) ecological value
to species m
anaged by the Atlantic States Marine Fisheries Commission (ASFMC):
Summary for the ASMFC SAV Subcommittee. In Atlantic coastal submerged aquatic
vegetation: a review of its ecological role, anthropogenic impacts, state regulation, and
value to Atlantic coastal fisheries (C.D. Stephan and T.E. Bigford, editors). ASFMC
Habitat Management Series #1, 78 p.
Lenihan, H. S., and C. H. Peterson. 1998. How habitat degradation through fishery disturbance
enhances im
pacts of hypoxia on oyster reefs. Ecological Applications 8(1): 128-140.
Levin. P.S. and G.W. Stunz. 2005. Habitat triage for exploited fishes: Can we identify essential
"Essential Fish H
abitat?". Estuarine, Coastal and Shelf Science 64: 70-78.
Lindquist, N. and L. Manning. 2001. Impacts of beach nourishment and beach scraping on
critical habitat and productivity of surf fishes. NC Division of Marine Fisheries, Fisheries
Resource Grant 98-EP-05: 41 .
Llanso, R. J., S.S. Bell, and F.E. Vose. 1998. Food habits of red drum and spotted seatrout in a
restored m
angrove impoundment. Estuaries 21(2): 294-306.
Loflin, R. K. 1995. The effects of docks on seagrass beds in the Charlotte Harbor estuary.
Florida Scientist 58(2): 198-205.
Lowerre-Barbieri, S.K., F.E. Vose and J.A. Whittington. 2003. Catch-and-release fishing on a
spawning aggregation of com
mon snook: does it affect reproductive output? Transactions of
the American Fisheries Society. 139: 940-952.
Luckenbach, M. W. and P.G. Ross. 2003. An experim
ental evaluation of the effects of scale on
oyster restoration. A final report to VA Sea Grant Consortium. 120p.
185
Luczkovich, J. J., H. J. Daniel, III, and M. W. Sprague. 1999. Characterization of critical
spawning habitats of weakfish, spotted seatrout and red drum
in Pamlico Sound using
hydroplane surveys. Completion Report, F-62, NC Division of Marine Fisheries,
Morehead City, NC. 128 p.
Luettich, R. A., J.E. McNinch, J.L. Pinckney, M.J. Alperin, C.S. Martens, H.W. Paerl, C.H.
Peterson, and J.T. W
ells. 1999. Neuse River estuary modeling and monitoring project,
final report: Monitoring phase. Water Resources Research Institute, Raleigh, NC, 190p.
Lyon, D. D. and M. R. Fisher. 1998. Temperature and pH-related mortality of red drum larvae
in fertilized culture ponds. Progressive Fish-Culturist 60(3): 227-230.
Mallin, M. A., K.E. Williams, E.C. Esham, and R.P. Lowe. 2000b. Effect of human
developm
ent on bacteriological water quality in coastal watersheds. Ecological
Applications 10(4): 1047-1056.
Marburger, J. E., W.E. Johnson, T.S. Gross, D.R. Douglas, and J. Di. 2002. Residual
organochlorine pesticides in soils and fish from
wetland restoration areas in central
Florida. Wetlands 22(4): 705-711.
Marcus, J. M. and T.P. Stokes. 1985. Polynuclear arom
atic hydrocarbons in oyster tissue around
three coastal marinas. Bulletin of Environmental Contamination and Toxicology 35:
835-844.
Marks, R. E., and G. DiDominico, 1996. Life History Aspects of Selected Marine Recreational
Fishes in North Carolina. Tagging Studies, Maturity, and Spawning of Red Drum
(
Sciaenops ocellatus) in North Carolina. Completion Report F-43, Segment 1, NC
Division of Marine Fisheries, Marine Fisheries, Morehead City, NC 38 p.
Meeder, J. F. and L.B. Meeder. 1989. Hurricanes in Florida: a dominant physical process.
Bulletin of Marine Science 44(1).
MFC (North Carolina Fisheries Commission) 1997. North Carlina fisheries rules for coastal
waters 1999-2000. NC Division of Marine Fisheries, Morehead City, NC. 206 p.
Mercer, L. P. 1984. A biological and fisheries profile of red drum
,
Sciaenops ocellatus. North
Carolina Division of Marine Fisheries. Special Scientific Report 41. Morehead City,
NC.
Meyer, D. L., E.C. Townsend, and P.L. Murphey. 1996. Final report for the project evaluation
of restored wetlands and enhancem
ent methods for existing restorations. National
Oceanic and Atmospheric Administration, Office of Habitat Conservation Restoration
Center, Silver Springs, MD.
Micheli, F. M. and C. H. Peterson. 1999. Estuarine vegetated habitats as corridors for predator
m
ovement. Conservation Biology 13(4): 869-881.
Miller, J. M., L.B. Crowder, and M.L. Moser. 1985. Migration and utilization of estuarine
nurseries by juvenile fishes: an evolutionary perspective. p. 338-352
in M.A. Rankin
(ed.). Migration: mechanisms and adaptive significance. Contributions to Marine Science
(Supplement). 27.
186
Mitsch, W. J. and J.G. Gosselink. 1993. Wetlands, Second Edition. Van Nostrand Reinhold,
New York, NY, Second Edition, 772p.
Mock, C. R. 1966. Natural and altered estuarine habitats of penaeid shrimp. Proceedings Gulf
Caribbean Fish Institute 19th Annual Session. 86-98.
Montgomery, J. 2003. What effect does setting a flounder net close to the marsh have on the
incidental by catch of red drum
? North Carolina Sea Grant Fishery Research Grant
Program, Final Report, Final Report 02-FEG-18. 13 p.
Moore, J. W. 1991. Inorganic contaminants of surface water, research and monitoring priorities.
Springer-Verlag, New York, NY, Springer series on environm
ental management. 334p.
Moore, L. J., J.H. List, D. Stolper, and S.J. Williams. 2006. Modeling the large-scale
m
orphodynamics of barrier island coasts under conditions of rising sea level. EOS
Transactions, American Geophysical Union 87 (36 supp).
Music, J. L., Jr., and J. M. Pafford. 1984. Population dynamics and life history aspects of major
m
arine sportfishes in Georgia’s coastal waters. Georgia Dept. of Natural Resources,
Coastal Resources Division, Coastal Fisheries Section, Final Report Study VI F-31, 382 p.
Neill, W. H. 1987. Environmental requirements of red drum. In G.W. Chamberlain, R. J. Miget
and M. G. Haby (eds.), Manual on Red Drum
Aquaculture. Preliminary draft of invited
papers presented at the Production Short course of the 1987 Red Drum aquaculture
Conference on 22-24 June, 1987 in Corpus Christi, Texas A&M University, College
Station.
North Carolina Coastal Federation (NCCF). 1997. State of the Coast Report 15(4). 19p.
North Carolina Division of Marine Fisheries (NCDMF). 1998. Blue Crab Public Inform
ation
Document. Morehead City, NC.
North Carolina Division of Marine Fisheries (NCDMF). 2001. Red Drum
Fishery Management
Plan. North Carolina Division of Marine Fisheries, Morehead City, NC. 110 p. +
appendices.
North Carolina Sea Grant. 1997. Coastal water quality. NC State University, Raleigh, NC,
UNC-SG-97-04 , 72 p.
Orth, R. J., J. Simons, J. Capelli, V. Carter, L. Hindm
an, S. Hodges, K. Moore, and N. Rybicki.
1986. Distribution of submerged aquatic vegetation in the Chesapeake Bay and
tributaries - 1985. US EPA, Washington, DC, Final report.
Paerl, H., M. M. Mallin, C. A. Donahue, M. Go, and B. L. Peierls. 1995. Nitrogen loading
sources and eutrophication of the Neuse River, NC: direct and indirect roles of
atm
ospheric deposition. Publication 291. Water Resources Research Institute, UNC,
Chapel Hill, NC.
Pate, P. P., Jr., and R. Jones. 1981. Effects of upland drainage on estuarine nursery areas of
Pam
lico Sound, North Carolina. UNC Sea Grant Pub. No. UNC-SG-WP-10. 24 p.

187
Pearsall, S. and B. Poulter. In press. Adapting coastal lowlands to rising seas.
in M. Groom, ed.
Principles of Conservation Biology . Sinauer Press.
Pearson, J. C. 1929. Natural history and conservation of the redfish and other commercial
sciaenids on the Texas coast. Bulletin of the U.S. Bureau of Fisheries. 44:129-214.
Peters, D. S., L.R. Settle, and J.D. Fuss. 1995. Larval fish abundance in the vicinity of Beaufort
Inlet prior to berm
construction. NMFS, Beaufort, NC, NMFS Progress Report , 20 p.
Peters, K. M. and J. R.H. McMichael. 1987. Early life history of the red drum,
Sciaenops
ocellatus (Pisces: Sciaenidae) in Tampa Bay, Florida. Estuaries 10(2): 92-107.
Peterson, B. J. and R.W. Howarth. 1987. Sulfur, carbon, and nitrogen isotopes used to trace
organic m
atter flow in the salt-marsh estuaries of Sapelo Island, Georgia. Limnology and
Oceanography 32(6): 1195-1213.
Peterson, C. H., J.H. Grabowski, and S.P. Powers. 2003. Quantitative enhancement of fish
production by oyster reef habitat: restoration valuation. Marine Ecology Progress Series
264: 249-264.
Peterson, C. H. and N.M. Peterson. 1979. The ecology of intertidal flats of North Carolina: A
com
munity profile. U.S. Fish and Wildlife Service, OBS-79/39, 73 p.
Peterson, M. S., B.H. Comyns, J.R. Hendon, P.J. Bond, and G.A. Duff. 2000c. Habitat use by
early life-stages of fishes and crustaceans along a changing estuarine landscape:
difference between natural and altered shoreline sites. W
etland, Ecology, and
Management 8(2-3): 209-219.
Powell, A. B. and R.E. Robbins. 1998. Ichthyoplankton adjacent to live-bottom habitats in
Onslow Bay, North Carolina. NOAA , Seattle, W
ashington, Tech. Rep. NMFS 133, 32p.
Powers, M. J. and D. Gaskill. 2004. Recruitment, growth, and habitat utilization of red drum
Sciaenops ocellatus, in North Carolina estuaries. North Carolina Sea Grant Extension
Program, FRG project #00-EP-04 , 40p.
Price, A. B. and J.L. Gearhart. 2002a. Small Mesh (< 4.5-inch) Gillnet Discard Mortality of
spotted seatrout (
Cynoscion nebulosus), weakfish (Cynoscion regalis), southern flounder
(
Paralichthys lethostigma), and red drum (Sciaenops ocellata) in Roanoke Sound, Core
Sound, and the Neuse River, North Carolina. North Carolina Division of Marine
Fisheries, Morehead City, North Carolina.
Price, A. B. and J.L. Gearhart. 2002b. Large Mesh (>
5-inch) Gillnet Discard Mortality of
Spotted Seatrout (
Cynoscion nebulosus), Weakfish (Cynoscion regalis), Southern
Flounder (
Paralichthys lethostigma), and Red Drum (Sciaenops ocellata) in Roanoke
Sound, Core Sound, and the Neuse River, North Carolina.
North Carolina Division of
Marine Fisheries, Morehead City, North Carolina.
Rakocinski, C., S.E. LeCroy, J.A. McLelland, and R.W. Heard. 1993. Responses by
m
acroinvertebrate communities to beach renourishment at Perdido Key, Florida: benthic
recovery. US Dept. of the Interior, National Park Service.
188
Reagan, R. E. 1985. Species profiles: life histories and environm
ental requirements of coastal
fishes and invertebrates (Gulf of Mexico) – red drum. US Fish and Wildlife Service,
Washington, DC. Biological Report 82 (11.36). 16 p.
Reilly, F. J. Jr. and B.J. Bellis. 1983. The ecological impact of beach nourishment with dredged
m
aterials on the intertidal zone at Bogue Banks, North Carolina. U.S. Army Corps of
Engineers, Coastal Engineering Research Center, Fort Belvoir, VA.
Riggs, S. R. 1996. Sediment evolution and habitat function of organic-rich m
uds within the
Albemarle estuarine system, North Carolina. Estuaries 19(2A): 169-185.
Riggs, S. R., E.R. Powers, J. T. Bray, P.M. Stout, C. Ham
ilton, D. Ames, R. Moore, J. Watson ,
S. Lucas, and M. Williamson. 1989. Heavy metal pollutants in organic rich muds of the
Pamlico River estuarine system: their concentration, distribution, and effects upon
benthic environments and water quality: Albemarle-Pamlico Estuarine Study. Project
No. 89-06. US EPA and NC DNRCD, Raleigh, NC, 108p.
Riggs, S. R., J.T. Bray, E.R. Powers, C. Hamilton, D. Am
es, D. Yeates, K. Owens, S. Lucas, J.
Watson, and M. Williamson. 1991. Heavy metal pollutants in organic-rich muds of the
Neuse River Estuary: their concentration and distribution. Albemarle-Pamlico Estuarine
Study Report. Project no. 90-07. DENR, Raleigh, 168p.
Rooker, J. R., G. J. Holt, S. A. Holt. 1998. Vulnerability of newly settled red drum (
Sciaenops
ocellatus) to predatory fish: Is early-life survival enhanced by seagrass meadows?
Marine Biology 131(1): 145-151.
Rooker, J. R., S.A. Holt, G.J. Holt, and L.A. Fuiman. 1999. Spatial and temporal variability in
grow
th, mortality, and recruitment potential of postsettlement red drum,
Sciaenops
ocellatus, in a subtropical estuary. Fisheries Bulletin 97(3): 581-590.
Ross, J. L., and T. M. Stevens. 1992. Life history and population dynam
ics of red drum
(
Sciaenops ocellatus) in North Carolina waters. NC Division of Marine Fisheries, Marine
Fisheries Research Completion Report Project F-29, , 130 p.
Ross, J. L., T. M. Stevens, and D. S. Vaughan. 1995. Age, growth, mortality, and reproductive
biology of red drum
s in North Carolina waters. Trans. Am. Fish. Soc. 124:37-54.
Rozas, L. P. and W.E. Odum. 1987. The role of submerged aquatic vegetation in influencing the
abundance of nekton on contiguous tidal freshwater m
arshes. Journal of Experimental
Marine biology and Ecology 114(2-3): 289-300.
Scharf, F. S. 2000. Patterns in abundance, growth, and mortality of juvenile red drum across
estuaries on the Texas coast with im
plications for recruitment and stock enhnacement.
Transactions of the American Fisheries Society 129: 1207-1222.
Schoof, R. 1980. Environmental impact of channel modification. Water Resources Bulletin
16(4): 697-701.
Shafer, D. J. 1999. The effects of dock shading on the seagrass
Halodule wrightii in Perdido
Bay, Alabama. Estuaries 22(4): 936-943.
189
Simmons and Breuer, 1962. A study of redfish (
Sciaenops ocellatus Linnaeus) and black drum
(
Pogonias cromis Linnaeus). Publications of the Institute of Marine Science, University
of Texas 8:184-211.
South Atlantic Fishery Management Council (SAFMC). 1990. The Atlantic coast red drum
fishery management plan, including an environmental impact statement and regulatory
impact review. SAFMC, Charleston, SC in cooperation with MAFMC, Dover, Delaware,
106 p.
South Atlantic Fishery Management Council (SAFMC). 1998. Final habitat plan for the south
Atlantic region: essential fish habitat requirem
ents for fishery management plans of the
South Atlantic Fishery Management Council. SAFMC, Charleston, SC, 457 p.
Stevenson, J. C., L.W. Staver, and K.W. Staver. 1993. Water quality associated with survival of
subm
erged aquatic vegetation along an estuarine gradient. Estuaries 16(346-361).
Stewart, C. B. 2006. Spatial and temporal variability in recruitment timing, relative abundance,
and m
ortality of juvenile red drum (
Sciaenops ocellatus) in southeastern North Carolina.
MS, UNC-W, University of North Carolina Wilmington, 69 p.
Street, M. W., A.S. Deaton, W.S. Chappell, and P.D. Mooreside. 2005. North Carolina Coastal
Habitat Protection Plan. DENR, DMF, Morehead City, 607p.
Stunz, G. W., P. S. Levin, and T.J. Minello. 2001. Selection of estuarine nursery habitats by
wild-caught and hatchery-reared juvenile red drum
in laboratory mesocosms.
Environmental Biology of Fishes 61(3): 305-313.
Stunz, G. W. and T.J. Minello. 2001. Habitat-related predation on juvenile wild-caught and
hatchery-reared red drum
Sciaenops ocellatus. Journal of Experimental Marine Biology
and Ecology 260(1): 13-25.
Stunz, G. W., T.J. Minello, and P.S. Levin. 2002. A comparison of early juvenile red drum
densities am
ong various habitat types in Galveston Bay, Texas. Estuaries 25(1): 76-85.
Sutter, L. 1. 1999. DCM wetland mapping in coastal North Carolina. DENR, Raleigh NC, 33p.
Takade, H. and L.M. Paramore. 2007. Stock status of the northern red drum stock. North
Carolina Division of Marine Fisheries, Morehead City, NC. 47 p. + appendices.
Tarplee, W. H. Jr., D.E. Louder, and A.J. Weber . 1971. Evaluation of the effects of
channelization on fish populations in North Carolina's coastal plain stream
s. North
Carolina Wildlife Resources Commission, Raleigh, NC.
Tenore, K. R. 1972. Macrobenthos of the Pamlico River estuary, North Carolina. Ecological
Monographs 42: 51-69.
Thayer, G. W., W. Kenworthy, and M. Fonseca. 1984. The ecology of eelgrass meadows of the
Atlantic Coast: a com
munity profile. FWS/OBS-84/02. 147 p.
Thorpe, T., D. Beresoff, and K. Cannady. 2001. Gillnet bycatch potential, discard mortality, and
condition of red drum
(
Sciaenops ocellatus) in southeastern North Carolina. Final Report
to the Marine Fisheries Commission, Fishery Resource Grant Program. 00-FEG-14. 72 p.
190
Thorpe, T., D. Beresoff. 2005. Effects of gillnet tie-downs on fish and bycatch rates associated
with Am
erican shad (
Alosa sapidissima) and flounder (Paralichthys spp.) fisheries in
southeastern North Carolina. Final Report to Marine Fisheries Commission, North
Carolina Sea Grant 04-FEG-03. 111 p.
Twilley, R. R., W.M. Kemp, K.W. Staver, J.C. Stevenson, and W.R. Boynton. 1985. Nutrient
enrichm
ent of estuarine submersed vascular plant communities. 1. Algal growth and
effects on production of plants and associated communities. Marine Ecology Progress
Series 23: 179-191.
Van Dolah, R. F., P. H. Wendt, and M. V. Levisen. 1991. A study of the effects of shrim
p
trawling on benthic communities in two South Carolina sounds. Fisheries Research 12:
139-156.
Van Dolah, R. F., P. P. Maier, M. H. Fulton, and G. I. Scott. 1997. Comparison of
azinphosm
ethyl toxicity to juvenile red drum (
Sciaenops ocellatus) and the mummichog
(
Fundulus heteroclitus). Environmental Toxicology and Chemistry 16(7): 1488-1493.
Vaughan, D. S., and T. E. Helser. 1990. Status of the red drum stock of the Atlantic coast:
Stock assessm
ent report for 1989. NOAA Tech. Memo. NMFS-SEFC-263. 117 p.
Vaughan, D.S. 1996. Status of the red drum stock on the Atlantic coast: Stock assessment
report for 1995, SEFSC, Beaufort Laboratory, Beaufort, NC. NOAA Tech. Report
NMFS-SEFC-380. 50p.
Vaughan, D.S., and J. T. Carmichael. 2000. Assessment of Atlantic Red Drum for 1999:
Northern and Southern Regions. NOAA Tech. Mem
. NMFS-SEFSC-447.
Vaughan, D.S. and J.T. Carmichael. 2001. Bag and size limit analyses for red drum in northern
and southern regions of the U. S. Atlantic. NOAA Technical Mem
orandum NMFS-
SEFSC-454, 37 p.
Voudrias, E. A. and C.L. Smith. 1986. Hydrocarbon pollution from marinas in estuarine
sedim
ents. Estuarine Coastal Shelf Sciences 22: 271-284.
Wannamaker, C. M. and J.A. Rice . 2000. Effects of hypoxia on movements and behavior of
selected estuarine organism
s from the southeastern United States. Journal of
Experimental Marine Biology and Ecology 249: 145-163.
Waters, C. T. and C.D. Thomas. 2001. Shoreline hardening effects on associated fish
assem
blages in five North Carolina coastal rivers. North Carolina Wildlife Resources
Commission, Raleigh, NC, 20p.
Weinstein, M. P. 1979. Shallow marsh habitats as primary nurseries for fishes and shellfish,
Cape Fear River, NC. Fisheries Bulletin 2: 339-357 .
Weinstein, M. P., S.L. Weiss, R.G. Hodson, and L.R. Gerry. 1980. Retention of three taxa of
postlarval fishes in an intensively flushed tidal estuary, Cape Fear River, North Carolina.
fishery Bulletin 78(2): 419-436.
191
Weis, J. S. and P. Weis. 1989. Effects of environmental pollutants on early fish development.
Aquatic Sciences 1(1): 45-55.
Weis, J. S., P. Weis, and T. Proctor . 1998. The extent of benthic impacts of CCA-treated wood
structures in A
tlantic coast estuaries. Archives of Environmental Contamination and
Toxicology 34(4): 313-322.
Wendt, P. H., R.F. Van Dolah, M.Y. Bobo, and J.J. Manzi. 1990. Effects of marina proximity
on certain aspects of the biology of oysters
and other benthic macrofauna in a South
Carolina estuary. South Carolina Wildlife and Marine Resources Department, Charleston,
SC, South Carolina Marine Resources Center Tech. Rep. No. 74, 49p.
Wenner, C. A., W. A. Roumillat, J. E. Moran, Jr., M. B. Maddox, L. B. Daniel, III, and J. W.
Sm
ith. 1990. Investigations on the life history and population dynamics of marine
recreational fishes in South Carolina: Part 1. Final Rep., Proj. F-37, SC Wildl. Mar.
Resour. Dept., Mar. Resour. Res. Inst., 180p.
White, K. 1996. Restoration of channelized streams to enhance fish habitat.
http://www.ies.wisc.edu/research/ies900/kim
channelization.htm, Dec. 2003.
Yokel, B. 1966. A contribution to the biology and distribution of red drum,
Sciaenops ocellata.
MS Thesis. University of Miami, Miami.
Zieman, J. C. 1982. The ecology of seagrasses of south Florida: a community profile. US Fish
and W
ildlife Service, Washington, DC. FWS/OBS-82/25. 123 p.

192
Appendix 1 – Rule Changes Necessary to Implement Red Drum FMP
Amendment One.
RULES NECESSARY TO IMPLEMENT RED DRUM FMP AMENDMENT
MANAGEMENT
STRATEGIES SELECTED BY THE MFC
Changes to implement Red Drum FMP Amendment are underlined and highlighted.
Issue: Recreational Targeting of Adult Red Drum
SUBCHAPTER 03J - NETS, POTS, DREDGES, AND OTHER FISHING DEVICES
SECTION .0300 – POTS, DREDGES, AND OTHER FISHING DEVICES
NEW RULE PROPOSED
15A NCAC 03J .0306 HOOK-AND-LINE
It is unlawful to use any hook larger than 4/0 from July 1 through September 30 in the internal coastal fishing waters
of Pamlico Sound and its tributaries south of the Albemarle Sound Management Area as defined in 15A NCAC 03R
.0201 and north of a line beginning at a point 34° 59.7942' N - 76° 14.6514'
W on Camp Point; running easterly to a point at 34° 58.7853' N - 76° 09.8922' W on Core Banks while using natural
bait from 7:00 p.m. to 7:00 a.m. unless the terminal tackle consists of:
(1) A circle hook defined as a hook with the point of the hook directed perpendicularly back toward
the shank, and with the barb either compressed or removed.
(2) A fixed sinker not less than two ounces in weight, secured not more than six inches from the fixed
weight to the circle hook.
History Note: Authority G.S. 113-182; 113-182.1; 143B-289.52.
Eff.???
Issues: Recreational Bag and Size Limit
Commercial Cap and Fishing Year
The Use of Gigs, Gaffs or Spears to take Red Drum
SUBCHAPTER 03M - FINFISH
Section .0500 – other finfish
15A NCAC 03M .0501 RED DRUM
(a) The Fisheries Director, may by proclamation, impose any or all of the following restrictions on the
taking of red
drum:
(1)
Specify areas.
(2)
Specify seasons.
(3)
Specify quantity.
(4)
Specify means/methods.
(5)
Specify size.
(b)(a) It is unlawful to remove red drum from any type of net with the aid of any boat hook, gaff, spear, gig, or similar device.
(b) It is unlawful to take or possess red drum taken by gigs, gaffs ,spears, or similar device.
(c)(b)(c) It is unlawful to possess red drum less than 18 inches total length or greater than 27 inches total length.

193
(d)(c)(d) It is unlawful to possess more than one red drum per person per day taken-by hook-and-line or for recreational
purposes.
(e)(d)(e) The annual commercial harvest limit (September 1 through August 31) for red drum is 250,000 pounds. The annual
commercial harvest limit will be allotted in two periods: September 1 through April 30 at 150,000 pounds, and May 1 through
August 31 at 100,000 pounds plus any remainder from the first period allotment. Any annual commercial harvest limit that is
exceeded one year will result in the poundage overage being deducted from the subsequent year’s commercial harvest limit and
the Fisheries Director shall adjust the period allotments accordingly. If the harvest limit is projected to be taken, taken in any
period, the Fisheries Director shall, by proclamation, prohibit possession of red drum taken in a commercial fishing operation.
operation for the remainder of that period.
History Note: Authority G.S. 113-134; 113-182; 113-221; 143B-289.52;
Eff. January 1, 1991;
Issues:
Estuarine Gill Net Discarded Bycatch of Red Drum
SUBCHAPTER 03J - NETS, POTS, DREDGES, AND OTHER FISHING DEVICES
SECTION .0100 - NET RULES, GENERAL
15A NCAC 03J .0103 GILL NETS, SEINES, IDENTIFICATION, RESTRICTIONS
(a) It is unlawful to use gill nets:
(1) With a mesh length less than 2 ½ inches.
(2) In internal waters from April 15 through December 15, with a mesh length 5 inches or greater and less
than 5 ½ inches.
(b) The Fisheries Director may, by proclamation, limit or prohibit the use of gill nets or seines in coastal waters, or any
portion thereof, or im
pose any or all of the following restrictions on the use of gill nets or seines:
(1) Specify area.
(2) Specify season.
(3) Specify gill net mesh length.
(4) Specify means/methods.
(5) Specify net number and length.
(c) It is unlawful to use fixed or stationary gill nets in the Atlantic Ocean, drift gill nets in the Atlantic Ocean for
recreational purposes, or any gill nets in internal waters unless nets are m
arked by attaching to them at each end two
separate yellow buoys which shall be of solid foam or other solid buoyant material no less than five inches in diameter
and no less than five inches in length. Gill nets, which are not connected together at the top line, are considered as
individual nets, requiring two buoys at each end of each individual net. Gill nets connected together at the top line are
considered as a continuous net requiring two buoys at each end of the continuous net. Any other marking buoys on gill
nets used for recreational purposes shall be yellow except one additional buoy, any shade of hot pink in color,
constructed as specified in this Paragraph, shall be added at each end of each individual net. Any other marking buoys on
gill nets used in commercial fishing operations shall be yellow except that one additional identification buoy of any color
or any combination of colors, except any shade of hot pink, may be used at either or both ends. The owner shall be
identified on a buoy on each end either by using engraved buoys or by attaching engraved metal or plastic tags to the
buoys. Such identification shall include owner's last name and initials and if a vessel is used, one of the following:
(1) Owner's N.C. motor boat registration number, or
(2) Owner's U.S. vessel documentation name.
(d) It is unlawful to use gill nets:
(1) Within 200 yards of any pound net set with lead and either pound or heart in use, except from August
15 through Decem
ber 31 in all coastal fishing waters of the Albemarle Sound, including its tributaries
to the boundaries between coastal and joint fishing waters, west of a line beginning at a point 36°
04.5184' N - 75° 47.9095' W on Powell Point; running southerly to a point 35° 57.2681' N - 75°
48.3999' W on Caroon Point, it is unlawful to use gill nets within 500 yards of any pound net set with
lead and either pound or heart in use;

194
(2) From March 1 through October 31 in the Intracoastal Waterway within 150 yards of any railroad or
highway bridge.
(e) It is unlawful to use gill nets within 100 feet either side of the center line of
the Intracoastal Waterway Channel south
of the entrance to the Alligator-Pungo River Canal near Beacon "54" in Alligator River to the South Carolina line, unless
such net is used in accordance with the following conditions:
(1) No more than two gill nets per vessel may be used at any one time;
(2) Any net used must be attended by the fisherman from a vessel who shall at no time be more than 100
yards from
either net; and
(3) Any individual setting such nets shall remove them, when necessary, in sufficient time to permit
unrestricted boat navigation.
(f) It is unlawful to use drift gill nets in violation of 15A NCAC 03J .0101(2) and Paragraph (e) of this Rule.
(g) It is unlawful to use unattended gill nets with a mesh length
less than five inches in a commercial fishing operation in
the gill net attended areas designated in 15A NCAC 03R .0112(a).
(h) It is unlawful to use unattended gill nets with a mesh length less than five inches in a com
mercial fishing operation
from May 1 through October 31 November 30 in the internal coastal and joint waters of the state designated in 15A
NCAC 03R .0112(b).
(i) It is unlawful to use more
than 3,000 yards of gill net with a mesh length 5 1/2 inches or greater per vessel in internal
waters regardless of the number of individuals involved. For gill nets with a mesh length five inches or greater, it is
unlawful:
(1) To use more than 3,000 yards of gill net per vessel in internal waters regardless of the number of
individuals involved.
(2) From June through October, for any portion of the net to be within 10 feet of any point on the
shoreline while set or deployed, unless the net is attended.
(j) For the purpose of this Rule and 15A NCAC 03R .0112, shoreline is defined as the mean high water line or marsh
line, whichever is most seaward.
History Note: Authority G.S. 113-134; 113-173; 113-182; 113-221; 143B-289.52;
Eff. January 1, 1991;
Amended Eff. August 1, 1998; March 1, 1996; March 1, 1994; July 1, 1993; September 1, 1991;
Temporary Amendment Eff. October 2, 1999; July 1, 1999; October 22, 1998;
Amended Eff. April 1, 2001;
Temporary Amendment Eff. May 1, 2001;
Amended Eff. December 1, 2007; September 1, 2005; August 1, 2004; August 1, 2002.
SUBCHAPTER 03R - DESCRIPTIVE BOUNDARIES
SECTION .0100 - DESCRIPTIVE BOUNDARIES
03R .0112 ATTENDED GILL NET AREAS
(a) The attended gill net areas referenced in 15A NCAC 03J .0103 (g) are delineated in the following areas:
(1) Pamlico River, west of a line beginning at a
point 35° 27.5768' N - 76° 54.3612' W on Ragged Point;
running southwesterly to a point 35° 26.9176' N - 76° 55.5253' W on Mauls Point;
(2) Within 200 yards of any shoreline in Pamlico River and its tributaries east of the line beginning at a
point 35° 27.
5768' N - 76° 54.3612' W on Ragged Point; running southwesterly to a point 35° 26.9176'
N - 76° 55.5253' W on Mauls Point; and west of a line beginning at a point 35° 22.3622' N - 76°
28.2032' W on Roos Point; running southerly to a point at 35° 18.5906' N - 76° 28.9530' W on
Pamlico Point;
(3) Pungo River, east of the northern portion of the Pantego
Creek breakwater and a line beginning at a
point 35° 31.7198' N - 76° 36.9195' W on the northern side of the breakwater near Tooleys Point;
running southeasterly to a point 35° 30.5312' N - 76°35.1594' W on Durants Point;
(4) Within 200 yards of any shoreline in Pungo River an
d its tributaries west of the northern portion of the
Pantego Creek breakwater and a line beginning at a point 35° 31.7198' N - 76° 36.9195' W on the
northern side of the breakwater near Tooleys Point; running southeasterly to a point 35° 30.5312' N -
76° 35.1594' W on Durants Point; and west of a line beginning at a point 35° 22.3622' N - 76°

195
28.2032' W on Roos Point; running southerly to a point at 35° 18.5906' N - 76° 28.9530' W on
Pamlico Point;
(5) Neuse River and its tributaries northwest of
the Highway 17 highrise bridge;
(6) Trent River and its tributaries;
(7) Within 200 yards of any shoreline in Neuse River and its tributaries east of the Highway 17 highrise
bridge and west of a line beginning at a point 34° 57.9116' N - 76° 48.2240' W on Wilkinson Point;
running southerly to a point 34° 56.3658' N - 76° 48.7110' W on Cherry Point. south and west of a line
beginning on Maw Point at a point 35° 09.0407' N – 76° 32.2348' W; running southeasterly near the
Maw Point Shoal Marker "2" to a point 35° 08.1250' N - 76° 30.8532' W; running southeasterly near
the Neuse River Entrance Marker "NR" to a point 35° 06.6212' N – 76° 28.5383' W; running
southerly to a point 35° 04.4833' N - 76° 28.0000' W near Point of Marsh in Neuse River. In Core and
Clubfoot creeks, the Highway 101 Bridge constitutes the attendance boundary.
(b) The attended gill net areas referenced in 15A NCAC
03J .0103 (h) are delineated in the following internal
coastal
and joint waters of the state south of a line beginning on Roanoke Marshes Point at a point 35° 48.3693' N - 75° 43.7232'
W; running southeasterly to a point 35° 44.1710' N - 75° 31.0520' W on Eagles Nest Bay to the South Carolina State line:
(1) All primary nursery areas described in 15A NCAC 03R .0103, all perm
anent secondary nursery areas
described in 15A NCAC 03R .0104, and no trawl areas described in 15A NCAC 03R .0106 (2),(4),(5),
and (6);
(2) In the area along the Outer Banks, beginning at a point 35° 44.1710'
N - 75° 31.0520' W on Eagles
Nest Bay; running northwesterly to a point 35° 45.1833' N - 75° 34.1000' W west of Pea Island;
running southerly to a point 35° 40.0000' N - 75° 32.8666' W west of Beach Slough; running
southeasterly and passing near Beacon "2" in Chicamicomico Channel to a point 35° 35.0000' N - 75°
29.8833' W west of the Rodanthe Pier; running southwesterly to a point 35° 32.6000' N - 75° 31.8500'
W west of Salvo; running southerly to a point 35° 28.4500' N - 75° 31.3500' W on Gull Island;
running southerly to a point 35° 22.3000' N - 75° 33.2000' W near Beacon "2" in Avon Channel ;
running southwesterly to a point 35° 19.0333' N - 75° 36.3166' W near Beacon "2" in Cape Channel;
running southwesterly to a point 35° 15.5000' N - 75° 43.4000' W near Beacon "36" in Rollinson
Channel; running southeasterly to a point 35° 14.9386' N - 75° 42.9968' W near Beacon “35” in
Rollinson Channel; running southwesterly to a point 35° 14.0377' N - 75° 45.9644' W near a “Danger”
Beacon northwest of Austin Reef; running southwesterly to a point 35° 11.4833' N - 75° 51.0833' W
on Legged Lump; running southeasterly to a point 35° 10.9666' N - 75° 49.7166' W south of Legged
Lump; running southwesterly to a point 35° 09.3000' N - 75° 54.8166' W near the west end of Clarks
Reef; running westerly to a point 35° 08.4333' N - 76° 02.5000' W near Nine Foot Shoal Channel;
running southerly to a point 35° 06.4000' N - 76° 04.3333' W near North Rock; running southwesterly
to a point 35°01.5833' N – 76° 11.4500' W near Beacon "HL"; running southerly to a point 35°
00.2666' N - 76° 12.2000' W; running southerly to a point 34° 59.4664' N - 76° 12.4859' W on
Wainwright Island; running easterly to a point 34° 58.7853' N - 76° 09.8922' W on Core Banks;
running northerly along the shoreline and across the inlets following the Colregs Demarcation line to
the point of beginning.
(3) In Core and Back sounds, beginning at a point 34° 58.7853'
N - 76° 09.8922' W on Core Banks; running
northwesterly to a point 34° 59.4664' N - 76° 12.4859' W on Wainwright Island; running southerly to a
point 34° 58.8000' N - 76° 12.5166' W; running southeasterly to a point 34° 58.1833' N - 76° 12.3000' W;
running southwesterly to a point 34° 56.4833' N - 76° 13.2833' W; running westerly to a point 34° 56.5500'
N - 76°13.6166' W; running southwesterly to a point 34° 53.5500' N - 76° 16.4166' W; running
northwesterly to a point 34° 53.9166' N - 76° 17.1166' W; running southerly to a point 34° 53.4166' N - 76°
17.3500' W; running southwesterly to a point 34° 51.0617' N – 76° 21.0449' W; running southwesterly to a
point 34° 48.3137' N - 76° 24.3717' W; running southwesterly to a point 34° 46.3739' N – 76° 26.1526' W;
running southwesterly to a point 34° 44.5795' N – 76° 27.5136' W; running southwesterly to a point 34°
43.4895' N – 76° 28.9411' W near Beacon "37A"; running southwesterly to a point 34° 40.4500' N – 76°
30.6833' W; running westerly to a point 34° 40.7061' N – 76° 31.5893' W near Beacon "35" in Back
Sound; running westerly to a point 34° 41.3178' N -76° 33.8092' W near Buoy "3"; running southwesterly

196
to a point 34° 39.6601' N – 76° 34.4078' W on Shackleford Banks; running easterly and northeasterly along
the shoreline and across the inlets following the COLREGS Demarcation lines to the point of beginning;
(4) Within 200 yards of any shoreline, except from October 1 through October 31, south and east of Highway
12 in Carteret County and south of a line from a point 34° 59.7942' N - 76° 14.6514' W on Camp Point;
running easterly to a point at 34° 58.7853' N - 76° 09.8922' W on Core Banks; to the South Carolina State
Line. Within 200 yards of any shoreline in the area upstream of the 76° 28.0000’W longitude line
beginning at a point 35° 22.3752' N - 76° 28.0000' W near Roos Point in Pamlico River; running
southeasterly to a point 35° 04.4833' N - 76° 28.0000' W near Point of Marsh in Neuse River.
(5) Within 50 yards of any shoreline east of the 76° 28.0000’W longitude line beginning at a point 35°
22.3752' N - 76° 28.0000' W near Roos Point in Pamlico River; running southeasterly to a point 35°
04.4833' N - 76° 28.0000' W near Point of Marsh in Neuse River, except in internal coastal fishing waters
south and east of Highway 12 in Carteret County and south of a line from a point 34° 59.7942' N - 76°
14.6514' W on Camp Point; running easterly to a point at 34° 58.7853' N - 76° 09.8922' W on Core Banks;
to the South Carolina State Line during October 1 through November 30.
History Note: Authority G.S. 113-134; 113-173; 113-182; 113-221; 143B-289.52;
Eff. August 1, 2004.

197
Appendix 2. Active and Complete NC Red Drum FMP Management Issues.
Management Issue Initial
FMP
Amend I Amend I Status
1 Recreational Bag and Size Limit 2001 Active; status quo (1 fish 18–27 inches)
2 Adult Harvest Limits
2001 Active, status quo (prohibit all harvest >27 inches)
3 Recreational Targeting of Adult
Red Drum
2001
2008
Active; Education on ethical fishing practices.
New; Seasonal circle hook requirements in Pamlico Sd.
4 Commercial Harvest Limits
Commercial Trip Limits
Commercial Fishing Year
2001
2001
2008
2008
Active; status quo (Director has authority to set trip limits and
bycatch requirem
ents)
New: Allow for possession of up to three red drum without
requiring that they be subject to any bycatch provision while
actively fishing gear. Upon sale/landing bycatch provisions
would apply to all drum
possessed.
Active; (September 1 to August 31 with 250,000 lb cap)
New; Split fishing year with 150,000 lb for period of
Septem
ber 1 through April 30 and conserving the remaining
portion for period of May 1 to August 31.
5 Gill Net Attendance Rules
Small Mesh Gill Nets
Large Mesh Gill Nets
2001
2008
2008
Active; May 1 to October 31 attendance requirement in all
prim
ary and permanent secondary nursery areas, shallow grass
beds along ‘Outer Banks’, and within 200 yards of any
shoreline. Area from Core Sound and south excluded from
200 yard from shore attendance requirement in October.
Modify; Extend current attendance through November.
Require year round attendance in Neuse River for all nets set
within 200 yards of shore. Reduce seasonal distance from
shore requirement for Pamlico Sound and south to 50 yards.
Area from Core Sound and south excluded from 50 yard from
shore attendance requirement in October and November.
Modify attendance line along ‘Outer Banks’ in areas of
Rodanthe and Hatteras.
New; Require attendance of nets set within 10 feet of shore
from
June through October.
Appendix 3
Stock Status
of the
Northern Red Drum Stock
April 2007
Helen Takade
North Carolina Division of Marine Fisheries
P.O. Box 769
Morehead City, NC 28557
Lee Paramore
North Carolina Division of Marine Fisheries
P.O. Box 539
Wanchese, NC 27981
Appendix 3
Executive Summary
The current red drum assessment indicates that F has decreased and
escapement and static SPR have increased for the red drum northern stocks
during the current (late) management period. The results from the 2000 stock
assessment indicated that overfishing was occurring, with static SPR values well
below the threshold SPR. The current model estimates are all above 30% static
SPR and, therefore, indicate that overfishing is not occurring. It appears that the
condition of the northern red drum stock has improved and that the more
restrictive management measures implemented during the late period (1999-
2005) have aided in that improvement.
The northern red drum stock was assessed using commercial,
recreational, and independent data from 1986 to 2005. Results were broken into
three regulatory periods with relatively uniform regulations (early: 1986-1991,
mid: 1992-1998, and late: 1999-2005). A major assumption in this assessment
was assigning an accurate length distribution to released fish from the
recreational fishery. While several assumptions on the length distribution of
recreational releases were calculated, the preferred matrix (Tagging) used length
frequencies estimated from modeling of North Carolina Division of Marine
Fisheries (NCDMF) tag returns. Late period age-3 selectivity was estimated to
be 0.48 of fully selected fish (age-2), and was estimated from modeling of
NCDMF tag returns. Two models were used: a backward calculating virtual
population analysis (VPA) and a forward calculating spreadsheet catch-at-age
model. Both models were updated from the Vaughan and Carmichael (2000)
assessment. Fishing mortality (F) estimated from FADAPT ranged from 0.50 to
0.49, with escapement ranging from 40.6% to 41.0% and static spawning
potential ratio (SPR) ranging from 40.4% to 40.8%. The spreadsheet catch-at-
age model F estimates ranged from 0.66 to 0.63, with escapement estimated at
32.8% and static SPR estimated at 32.3%. All estimated runs using the
TAGGING matrix from both models were above the threshold of 30% static SPR
and the FADAPT estimates were above the target of 40% static SPR. All runs
showed improvements in escapement and SPR from the previous regulation
period (1992-1998).
I
Appendix 3
Table of Contents
Executive Summary...............................................................................................I
Introduction...........................................................................................................1
Commercial Fishery Description........................................................................
1
Recreational Fishery Description.......................................................................
2
General Life History...........................................................................................3
Regulations and Management History ..............................................................4
Previous Assessment Results...........................................................................6
Assessment Data..................................................................................................6
Commercial.......................................................................................................6
Recreational ......................................................................................................7
Ageing...............................................................................................................8
Fishery Independent Data.................................................................................8
North Carolina Seine Survey .........................................................................8
Pamlico Sound Independent Gill Net Survey (IGNS).....................................9
Life History Parameters.....................................................................................9
Natural Mortality.............................................................................................9
Age and Growth...........................................................................................10
Maturity at Age.............................................................................................10
Catch at Age Matrices .................................................................................10
Methods..............................................................................................................12
Separable Virtual Population Analysis (SVPA)................................................12
Spreadsheet Model .........................................................................................13
FADAPT VPA..................................................................................................14
Escapement and SPR.....................................................................................14
Model Assumptions.........................................................................................14
Data Limitations...............................................................................................15
Preferred Runs................................................................................................15
Results................................................................................................................16
Fishing Mortality (F).........................................................................................
16
FADAPT VPA ..............................................................................................16
Spreadsheet Model......................................................................................
16
Escapement and SPR.....................................................................................
16
FADAPT VPA ..............................................................................................16
Spreadsheet Model......................................................................................16
Model Fit and Configuration ............................................................................
16
FADAPT Retrospective Analysis.....................................................................17
Discussion ..........................................................................................................18
Research Recommendations..............................................................................
20
Literature Cited ...................................................................................................22
Appendix 1. Alternative discard and selectivity assumpti
on sensitivity runs .......48
Appendix 2. Relevant Equations.........................................................................55
II
Appendix 3
Introduction
Atlantic red drum (Sciaenops ocellatus) are an important marine species
with the most recent stock assessment conducted in 2000. The first
assessments were conducted using catch curves and separable virtual
population analysis (SVPA) and treated the Atlantic red drum as a single stock
(Vaughan and Hesler 1990; Vaughan 1992; Vaughan 1993). More recent
assessments (Vaughan 1996; Vaughan and Carmichael 2000) divided the
Atlantic coast into two stock regions: the northern region from North Carolina and
north and the southern region from South Carolina through the east coast of
Florida.
This assessment is an update of the northern region stock assessment
that was conducted in 2000. The 2000 assessment is the approved assessment
for Amendment 2 to the Atlantic States Marine Fisheries Commission (ASMFC)
Red Drum Fishery Management Plan (FMP). The North Carolina Division of
Marine Fisheries (NCDMF) Red Drum Plan Development Team (PDT)
consensus in the development of this stock assessment was to maintain a
methodology consistent with that used in the previous assessment. Exceptions
to the previous methodology occurred as a result of regulation changes since the
last assessment. These included assumptions about estimates of the length
composition from recreational releases and the relative selectivity at age.
Assumptions for these estimates were no longer valid primarily due to reductions
in the bag limit and the prohibition of red drum greater than 27 in from harvest
and new methods were developed to estimate these parameters. The North
Carolina Marine Fisheries Commission (NCMFC) and Red Drum Advisory
Committee will use this assessment to update the North Carolina Red Drum
FMP.
Commercial Fishery Description
A directed commercial red drum fishery does not currently exist in North
Carolina and historically red drum have made up only a small portion of North
Carolina’s total commercial landings. However, North Carolina’s red drum
landings are highest for all states along the Atlantic coast (Table 1). From 1999
to 2005, 96% of all red drum harvested commercially were landed in North
Carolina. From 1972 to 2005, commercial landings of red drum in North Carolina
fluctuated annually, averaging 161,433 pounds (lb) and ranging from 19,637 lb in
1977 to 372,942 lb in 1999 (Figure 1).
Red drum have been commercially harvested over the years using a
variety of commercial gears, with Outer Banks fishermen occasionally targeting
large red drum in Pamlico Sound (SAFMC 1990). Throughout the 1970’s long
haul seines and common haul seines were generally the most productive gears,
while gill nets, pound nets and trawls were also commonly used (Mercer 1984).
Since the 1980’s, gill nets have become the dominant gear. In the years leading
1
Appendix 3
up to the implementation of daily trip limits in 1999, nearly one-half of the total
annual commercial harvest of red drum was harvested by a small number of trips
with high landings. From 1994 to 1998, nearly half of all red drum landed
(48.5%) was taken by only 1.1% of the total number of trips that harvested red
drum. During this time, runaround gill nets became a significant contributor to
the red drum commercial harvest (Figure 2). The runaround gill net and long haul
seine fisheries typically had the largest individual red drum landings per
individual trip during this time because of their effectiveness in encircling large
schools of red drum. Pamlico Sound had the highest annual red drum landings
in the state (Table 2). Much of the harvest and the largest individual catches
occurred from Oregon Inlet to Ocracoke Inlet. Although there were a few
exceptional long haul seine catches of up to 10,000 lb, a typical catch for a
runaround gill net ranged from 100 to 1,000 lb per trip. Now that regulations
prohibit a directed fishery, red drum are most commonly encountered as bycatch
in the southern flounder estuarine gill net fishery but are also still common
bycatch in many of the gears in which they were traditionally captured.
With the changes in regulations over the years, the size structure of the
commercial harvest has also shifted towards larger fish (Figure 3). During the
initial management period of 1987 to 1991 most red drum harvested were ~14 in
total length (TL) and age-1. In 1992, when the size restrictions changed (18 – 27
in TL), the modal length for red drum harvested shifted to 19 in TL and age-2. As
a result of decreasing the available sizes that can be retained within the slot limit,
landings are now primarily from a single year class of fish and dependent on year
class strength. While the regulatory changes in 1999 removed the ability to
retain one fish over 27 in, the reductions in harvest resulting from the daily trip
limit did correspond with a shift in the modal length of harvested fish from 19 in
TL to 23 in TL. In addition, fish at the upper end of the slot limit that were once
rare in the landings are now commonly encountered.
Recreational Fishery Description
North Carolina accounts for most of the recreational landings in the
northern region (Table 3 and Table 4). Landings in Virginia can be substantial for
some years. Landings are minor North of Virginia. Angling methods used to
catch red drum include conventional, spinning, and fly tackle; using live, dead,
and artificial bait. Red drum are targeted by recreational anglers year-round
throughout the sounds, rivers and beaches of North Carolina. Red drum are
consistently reported as one of the top target species by shore-based
recreational anglers, and were the number one or two target species in 1993,
1995, 1996 and every year from 1999 to 2003.
Recreational fishermen must adhere to the same slot limit (18 – 27 in TL)
as commercial fishermen and are allowed to harvest one fish per person per day.
Similar to the commercial fishery, recreational landings vary annually in response
to changes in year-class abundance. For example, landings increased from
2
Appendix 3
38,286 lb in 1997 to 591,435 lb in 1998 (Table 3). When there was a five fish
creel limit, recreational landings averaged 286,548 lb and accounted for
approximately 60% of the total red drum harvested in North Carolina from 1992
to 1998. After the creel limit was reduced to one fish per day, annual landings
dropped to an average of 204,628 lb from 1999 to 2005 and accounted for
approximately 56% of all red drum harvested.
Undersized red drum accounted for 19% of the recreational harvest from
1994 to 1998, with a range of 1% in 1998 to 35% in 1997. Undersized red drum
only accounted for 3.4% of the harvest from 1999 to 2005, with a range of 0% in
2003 and 2005 to 5.5% in 1999. Prior to the prohibition of red drum greater than
27 in TL in 1999, North Carolina offered award citations for red drum captured
weighing 45 lb or greater. A citation could also be received for the release of a
captured red drum greater than 40 in TL. All award citations issued since 1999
are for releases only. Trends in the NCDMF citation data show an increasing
trend in the percentage of citations that were awarded for releases prior to 1999,
indicating an increasing tendency by anglers to practice catch and release ethics
(Table 5). In addition, release citations increased substantially in 1999 and
appear to be trending upward. While this appears encouraging, it is difficult to
ascertain if this is due to increases in availability of large fish, increases in fishing
effort or due to increased popularity of the citation program.
General Life History
Red drum is an estuarine-dependent species, common along the Atlantic
coast over a wide range of habitats from Chesapeake Bay to Key West, Florida.
Historically, red drum have ranged as far north as Massachusetts and there was
a moderate commercial fishery off the New Jersey coast in the 1930’s (Lux and
Mahoney 1969, Mercer 1984). There are few landings reported from areas north
of Chesapeake Bay since the 1950’s, suggesting a decline in red drum
distribution along the Atlantic coast.
Red drum spawning has been observed occurring at night in high salinity
areas in or around the major estuarine passes and inlets (Pearson 1929,
Johnson 1978). Evidence now suggests that substantial spawning activity may
take place inside the estuaries. Red drum have been collected in spawning
condition inside Hatteras and Ocracoke Inlets and near the mouths of bays and
rivers on the western side of the Pamlico Sound (Ross et al. 1995). More recent
work used passive acoustic techniques to document suspected spawning
activity. Using the drumming sounds produced by males during courtship,
Luzkovich et al. (1999) documented spawning activity along Ocracoke Inlet and
in the mouth of the Bay River in western Pamlico Sound. Barrios (2004) further
documented spawning red drum with this technique in western Pamlico Sound
near the mouth of the Neuse River.
Subsequent to spawning, larvae are distributed throughout the estuary by
wind and tidal currents. The majority of larvae will settle out in shallow, low
3
Appendix 3
salinity areas with abundant food supplies. These habitats include coastal
creeks, protected bays with sandy or mud bottoms, and grass beds (Mercer
1984, Daniel 1988, Wenner et al. 1990, Ross et al. 1992). Juvenile distribution in
the estuary varies seasonally as the fish grow and disperse. In North Carolina,
juvenile red drum are found year-round over a wide range of salinity and habitats,
although they generally prefer the shallow shorelines of various bays and rivers
and the shallow grass flats behind barrier islands (Ross and Stevens 1992). Red
drum grow rapidly during the first few years and most will reach the legal size
limit of 18 in TL by 20 months of age. Most red drum have grown beyond the
current maximum size limit of 27 in TL before they reach age-3. The earliest
mature females occur at age-3 and all are mature at age-4 (30-35 in TL). Males
mature sooner with 100% maturity occurring by age-3 around 27-32 in TL (Ross
et al. 1995).
Movement and migration of red drum in North Carolina and along the
Atlantic coast have been documented using tagging studies. Studies in North
Carolina and South Carolina indicate high site fidelity. For subadult and adult red
drum tagged in North Carolina estuaries, 99% of the red drum tag recaptures
occur in North Carolina coastal waters (Ross and Stevens 1992, Marks and
DiDomenico 1996). South Carolina tagged fish were mainly caught within nine
nautical miles of their release site (ASMFC 2002). Less than 5% of subadult
recaptures occurred outside of South Carolina coastal waters and no adults were
recovered outside coastal waters (ASMFC 2002). Further north, large red drum
schools have been reported to move from Virginia south along the beaches of
the Outer Banks during the fall as water temperatures decline. These schools
then return north in the spring (Mercer 1984). Tagging data provides evidence
for separate stocks that should be considered as separate management units.
Therefore, beginning with the 1995 assessment, red drum have been assessed
as northern and southern stocks, with the stock split occurring at the North
Carolina/South Carolina border (Vaughan 1996, Vaughan and Carmichael 2000).
Regulations and Management History
When assessing the northern stock of red drum the assessment results
can easily be segregated into three distinct management periods which will be
referred to throughout this document: early (1986-1991), mid (1992-1998), and
late (1999-2005). A regulatory summary for each period is summarized in Table
6.
Red drum regulations in North Carolina began in 1976, with a 14 in TL
minimum size limit and a limit of two fish per day exceeding 32 in TL. In
December of 1987, proclamation authority for the NCDMF director was
established for areas, seasons, quantity, means/methods and size. Management
of red drum at the federal level began in the 1980’s with red drum being
managed by multiple management entities. The first plan was developed by the
ASMFC in 1984, although this plan had no regulatory requirements. The South
4
Appendix 3
Atlantic Fishery Management Council (SAFMC) FMP was subsequently adopted
in 1990 and closed federal waters to the harvest of red drum. This plan was then
adopted as Amendment 1 to the ASMFC FMP in 1991. The goal of Amendment
1 was to obtain optimum yield from the fishery over time. Optimum yield (OY)
was defined as the amount of harvest that could be taken while maintaining a
30% spawning stock biomass per recruit (SSBPR). This goal however, was not
attainable due to a lack of information on the adult population. This led to a 30%
spawning potential ratio (SPR) being used as a proxy to SSBPR. Because the
SPR at this time was estimated to be 2 to 3%, Amendment 1 recommended that
all states implement harvest controls to attain at least a 10% SPR as a phase-in
approach to rebuilding the stocks. The result was a significant increase in
management of red drum in North Carolina during the 1990’s. In 1990, the
recreational creel limit was set at five fish per day, harvest of red drum over 32 in
TL was limited to one fish per day, and a 300,000 lb commercial cap was
established. A commercial cap was enacted to prevent North Carolina’s
commercial red drum fishery from expanding beyond historical harvest levels at a
time when other markets (i.e. Florida) were prohibiting the sale of red drum. The
commercial cap was further reduced to 250,000 lb in 1991 and the size limit was
changed to a slot limit of 18 to 32 in TL with one fish greater than 32 in. All of
these regulations constitute the ‘early’ period as defined above. By 1992, North
Carolina had in place the current 18 to 27 in TL slot limit, a five fish creel limit,
and allowed the harvest of one fish over 27 in TL. The regulations from 1992-
1998 remained unchanged and referred to as the ‘mid’ period in this report.
In 1998 the SAFMC adopted new definitions of overfishing and OY for red
drum, setting the levels at 30% SPR and 40% SPR, respectively. Later in 1998,
North Carolina, through the development of a state FMP, implemented
management measures designed to eliminate overfishing and achieve OY. As a
result, the recreational bag limit was reduced to one fish per day and a 100 lb
daily commercial trip limit (set at the Director’s discretion) was imposed, while the
previous 250,000 lb commercial cap remained in place. Harvest of any fish
outside of the slot was prohibited. After exceeding the commercial cap in 1999
and 2000, a commercial trip limit of seven fish per day was established in 2001.
In addition to the daily commercial trip limit, targeting of red drum was prohibited
by requiring that the total weight of red drum make up no more than 50% of the
total marketable catch (excluding menhaden) for each trip. The North Carolina
FMP with these regulatory changes was approved by the NCMFC in 2001.
Amendment 2 of the ASMFC FMP was adopted in 2002 and required that all
states implement management measures necessary to obtain a 40% SPR. As a
result of the North Carolina Red Drum FMP of 2001, no additional management
measures were required by North Carolina. With the exception of changing the
trip limit in the commercial fishery, regulations in North Carolina have remained
unchanged since 1999 and comprise the ‘late’ period. This assessment will
determine if the management action taken in the ‘late’ period was adequate to
obtain OY as defined in the NCFMP and Amendment 2 to the ASMFC FMP.
5
Appendix 3
Virginia’s regulatory history is similar to North Carolina’s regulations. In
1986, a 14 in TL minimum size limit was established with a possession limit of no
more than two fish greater than 32 in TL. In late 1992, the slot limit was
established at 18 - 27 in TL with a five fish bag limit, allowing only one fish
greater than 27 in TL to be harvested. In 2003, the slot limit was changed to 18 -
26 in TL with a three fish bag limit and no allowance for red drum harvest outside
of the slot limit. Virginia’s regulations apply to both commercial and recreational
fisheries.
Previous Assessment Results
Atlantic red drum have been previously assessed on five occasions, with
the most recent coastwide assessment occurring in 2000. The first assessment
was conducted using catch curve analysis and VPA. The best estimates
indicated that SPR and escapement (relative survival from age at entry into
fishery to age four) were low (Vaughan and Helser 1990). All of the estimates
were well below the SAFMC threshold of 30% SPR. Assessment updates
occurred in 1992 and 1993. For assessment purposes, the stock was split into
northern (North Carolina and north) and southern (South Carolina, Georgia, and
the east coast of Florida) regions beginning in 1995. Estimates of escapement
from 1992 to 1994 for the northern region were 10.4%, which was an increase
from the estimate of 0.6% for the early period (Vaughan 1996). The SPR
estimate increased from 0.2% for the early period to 9.0% in the 1992-1994
period, putting it just below the 10% SPR level for first phase recovery. Results
of the 2000 stock assessment used data through 1998 and indicated that
escapement had improved for the entire period of 1992 to 1998 to around 18%
(Vaughan and Carmichael 2000). This estimate however, falls short of the 30%
overfishing definition. This assessment is intended to evaluate the effectiveness
of the most recent regulatory changes in improving the red drum stocks. This
iteration of the red drum stock assessment was conducted as part of the North
Carolina Red Drum FMP update. The next coastwide assessment is scheduled
for 2009 by the ASMFC.
Assessment Data
Commercial
North Carolina commercial landings data have been collected through the
North Carolina Trip Ticket Program (NCTTP) since 1994. Between 1978 and
1993, landings information was gathered through the National Marine Fisheries
Service (NMFS)/North Carolina Cooperative Statistics program. Reporting was
voluntary during this period, with North Carolina and NMFS port agents sampling
the state’s major dealers (Lupton and Phalen 1996). Since 1994, commercial
landings reporting has been mandatory. For further information on the sampling
methodology for the NCTTP, see Lupton and Phalen (1996). Virginia has also
had mandatory commercial reporting since 1993. Like North Carolina, Virginia’s
6
Appendix 3
landings information prior to 1993 was collected on a voluntary basis through a
cooperative program with the NMFS.
Commercial length frequency data were obtained by the NCDMF
commercial dependent sampling program. Red drum lengths were collected at
local fish houses by gear, market grade (not typical for red drum) and area
fished. Individual fish were measured (mm, FL) and total weight (0.1 kg) of all
fish measured in aggregate was obtained. Subsequent to sampling a portion of
the catch, the total weight of the catch by species and market grade was
obtained for each trip, either by using the trip ticket weights or some other
reliable estimate. Length frequencies obtained from a sample were then
expanded to the total catch using the total weights from the trip ticket. All
expanded catches were then combined to describe a given commercial gear for
a specified time period. Sample sizes obtained for Virginia commercial length
frequencies were inadequate to describe the length distribution of red drum taken
by gear type and year. As a result, North Carolina length frequency distributions
from the same or similar gears were used to describe Virginia’s commercial
harvest (Table 7). Commercial length sampling intensity was determined by
number of fish sampled per thousand pounds of catch for four major gears: gill
nets, long haul seines, pound nets and winter trawls (Table 8). A rough
reference for sampling adequacy used in the 2000 assessment was a minimum
of 100 fish sampled per 200 metric tons. This converts to the current standard of
greater than 0.23 fish sampled per 1,000 lb. By this standard, the major gears of
gill net, long haul seine, and pounds nets were sampled adequately during the
late time period. It is important to note that the nature of this fishery (small
landings, large variability) likely requires larger sampling proportions. Gill nets
and long haul seines had previously been determined to be adequately sampled
for all years but 1986 and gill nets in 1987 and 1988 (Vaughan and Carmichael
2000). Commercial samples were taken throughout the year and from all areas
where red drum are landed. Combined, gill nets, long haul seines and pound
nets made up over 98% of all commercial landings for the northern region for the
period of 1999-2005. Of these, gill net landings dominated, accounting for
between 88% and 94% of all commercial harvest annually.
Recreational
The Marine Recreational Fishery Statistics Survey (MRFSS) collected the
recreational landings data. The survey has two parts: a coastal county
household telephone survey and an angler intercept survey at access sites. The
survey data were combined to estimate numbers of fish caught, released, and
harvested, harvest biomass, total trips and numbers of people fishing
recreationally. Beginning in 1987, North Carolina has supplemented the MRFSS
sampling targets for the state, increasing the sample size by nearly six times.
The supplemental sampling has greatly improved catch estimate precision.
Proportional standard error (PSE) is used to examine the precision of MRFSS
estimates. For further information on MRFSS and the recreational sampling
7

Appendix 3
methodology see
http://www.st.nmfs.gov/st1/recreational/pubs/data_users/index.html.
Trip effort estimates for 1986-2005 were generated using programs
developed by Holiman (1996). Trips where red drum were identified as a species
of interest were defined as target trips. Both successful and unsuccessful trips
were included. From this data set, two indices were generated including a catch-
per-unit effort index that used targeted trips and corresponding catch data and a
probability of success index that used the proportion of successful targeted trips
to the total number of targeted trips (Figure 4).
Ageing
Red drum sagittal otoliths were collected from the commercial and
recreational fishery, with supplemental samples collected from fishery
independent surveys. Age samples were collected monthly with sampling targets
set for specified length bins. When possible, fork and total length to the nearest
millimeter, weight to the nearest 0.1 kg, date, gear and water location were
recorded for each sample. Otoliths (sagittae) were excised from all fish and
stored dry. Dorso-ventral sections of the left sagitta were made through the core
to the nucleus perpendicular to the anterior-posterior plane with a Hillquist thin-
sectioning machine as described by Cowan et al. (1995). Sections were
mounted on slides with ultra-violet curing glue. All sections were read from a
high resolution monitor coupled to a video camera mounted on a microscope.
Otolith sections were read independently by two readers. Age determination for
red drum was based on the presence of annuli but had to be adjusted because
the first annulus is not formed until 19-21 months after the hatching date.
Validation of this technique is presented in Ross and Stevens (1992). Age-
length data for this updated assessment were provided by the NCDMF (2,917
fish from 1999-2005) and Old Dominion University (via Virginia Marine
Resources Commission (VMRC); 289 fish from 1999-2005). Old Dominion
University has been ageing red drum since 1998 from Virginia catches. Samples
from North Carolina and Virginia were combined to generate age-length keys for
the red drum catch-at-age.
Fishery Independent Data
North Carolina Seine Survey
A juvenile abundance index (JAI) was developed using data from the
NCDMF red drum beach seine survey. The program was established to
determine a red drum JAI and to evaluate habitat requirements for juvenile red
drum. The survey was first conducted in 1987 as a pilot study. Through 1990,
between 20 and 24 stations were randomly selected for sampling. Since 1991,
set stations in internal waters have been sampled twice monthly from September
to November. Seining is conducted using a bag seine measuring 18 m (60 ft) by
8

Appendix 3
1.8 m (6 ft) with 6.4 mm (1/4 in) bar mesh in the body and 3.2 mm (1/8 in) bar
mesh in the bag. A standard tow has one net end at the water’s edge while the
other end is pulled perpendicular to the shore. The end in the water is pulled a
quarter sweep in the direction of tide or flow, and then fished to shore. The
CPUE was defined as the average number of juvenile red drum captured per
tow.
The assessment included the time period from 1991 to 2005, excluding
only 1996 because of known environmental causes that decreased availability of
fish (Figure 5). The trends prior to 1999 were highly variable. It appears that
juvenile abundance was generally low from 1999 to 2001. Since 2001, the JAI
has steadily increased to present.
Pamlico Sound Independent Gill Net Survey (IGNS)
Age-1 and age-2 indices were calculated using data from the Pamlico
Sound independent gill net survey. The program began in 2001 with four
objectives: to calculate annual abundance indices for key species in Pamlico
Sound (including red drum), to provide supplemental samples for age, growth,
and reproduction studies, to evaluate catch rates and species distribution in
relation to bycatch, and to characterize habitat utilization. The survey used a
stratified-random survey design with depth (greater or less than 6 ft) and region
as strata. Regions were overlaid with a one-minute by one-minute grid system,
with sampling sites selected randomly using PROC PLAN in SAS (SAS 2006).
Each grid selected was sampled with a net array of 30-yard segments of 3, 3 ½,
4, 4 ½, 5, 5 ½, 6, and 6 ½ in stretch mesh webbing for 240 total yd of gill net
fished in each regional deep and shallow strata. For each month, random
samples were obtained from 16 shallow and 16 deep water sites. Gear was
deployed within an hour of sunset and soaked for approximately 12 hours before
retrieval. The sampling season occurred from February 15 to December 15
annually. The CPUE was defined as the number of red drum captured at age per
sample.
The short time period limits the ability to determine trends for the age-1
and age-2 indices independently, although they appear highly variable from year
to year (Figure 6). There are indications that the IGNS can follow cohorts as they
progress through time. An example is the large age-1 value in 2002, which does
appear as a high value in the age-2 index in 2003. The 2003 age-1 value is low,
which corresponds with a low age-2 index value in 2004.
Life History Parameters
Natural Mortality
The natural mortality (M) rates previously used by Vaughan and
Carmichael (2000) for the northern region were 0.20 for subadults (ages 1-5) and
9

Appendix 3
0.12 for adults (ages 6 and older) and were based on a size at age relationship
(Boudreau and Dickie 1989). These values are used in this assessment.
Age and Growth
Age and growth data were used both to estimate the von Bertalanffy-type
growth equations and to develop annual age-length keys for converting catch at
length data to catch at age. In order for the for the results to be based on a
calendar year it was necessary to adjust the ages so that the age assigned to an
individual red drum would coincide with a calendar year. Because September 1
is the theoretical birthdate for red drum in the northern region, all ages were
adjusted so an age-1 fish (based on a January-December calendar year) would
range in actual age from 5 to 16 months (Vaughan and Carmichael 2000). All
age-length keys were annual and used two-inch length bins with bin designation
using the midpoint (Table 9).
Previous red drum assessments have fitted growth data to both standard
and linear versions of the von Bertalanffy (1938) growth equations (Vaughan
1996; Vaughan and Carmichael 2000). The linear von Bertalanffy equation
assumes that L
∝
is a linear function of age rather than a constant, which is the
assumption in the standard von Bertalanffy equation. The equations were fitted
using the PROC NLIN function in SAS (SAS 2006). The preferred parameters
for the previous assessment were estimated from the linear growth equation as
opposed to the standard equation. The linear growth equation includes an extra
parameter that is significantly different from zero. The linear model is capable of
better fitting the higher growth rates at earlier ages and the slower growth rates
at later ages. For this assessment linear and standard von Bertalanffy parameter
estimates are shown in Table 10 and equations can be found in Appendix 2.
Maturity at Age
The maturity schedule used in this assessment is based on Ross et al.
(1995) and is consistent with that used in the previous update. The maturity
schedule was used to determine the percent SPR and used only the female
maturity schedule. The maturity schedule at age was as follows: age-2 was 0.01,
age-3 was 0.58, age-4 was 0.99, and age-5 was 1.00. All fish collected during
the maturity study were collected between September 1 and the end of the
calendar year and for this reason no adjustments were necessary to align the
adjusted calendar based ages with the age at maturity data.
Catch at Age Matrices
Annual catch-at-age (CAA) matrices were calculated for the period from
1999 to 2005 and followed the assumptions used by Vaughan and Carmichael
(2000). The period from 1986 to 1998 used the existing CAA calculated for the
2000 assessment. For the current period, a CAA matrix was generated for four
10
Appendix 3
major commercial gears including gill nets, long haul seines, pound nets and
winter trawl. The remaining commercial gears were not sampled and accounted
for less than 1% of the annual commercial harvest in any year. These gears
were combined with gill nets in the CAA workup. The recreational CAA matrices
were generated based on information derived from MRFSS. The age-length
keys used to in calculating the CAA are based on 12-month periods rather than
6-month periods.
Five different CAA matrices were calculated for different assumptions
about the length frequency distribution of the recreational releases (Tables 11-
13). The first, BASE0, assumed that there was no recreational discard mortality.
The BASE1 matrix assumed 10% discard mortality and that the length frequency
distribution was the same as the observed recreational harvest length frequency.
The DELTA matrix assumed a 10% discard mortality rate and assumed that the
length frequency distribution equaled the positive difference between the
observed recreational harvest length frequencies of the early period (1986-1991)
and the late period (1999-2005). The PROP catch matrix assumed a 10%
discard mortality rate and used a weighted average of the MRFSS length
frequencies from the BASE1 and DELTA catch matrices. The weights were 40%
BASE1 and 60% DELTA, based on the 40% reduction that was required by
Amendment 2. The last, TAGGING matrix, assumed a 10% discard mortality
rate and based the length frequency distribution on the estimated selectivity at
length for the B2 catch from an analysis of the North Carolina tagging data
described below (Figure 7).
Length-based selectivity patterns were estimated for recreationally
released red drum using NCDMF mark-recapture data (Burdick et al. 2006). The
differences in selectivity were examined by time periods established for fisheries
regulation changes. The selectivity of discards (fish released alive) and
harvested fish could be estimated separately for recreational tag returns.
Selectivity patterns were estimated using a generalized linear model that fitted an
expected tag return rate using the rate of tag recovery by gear (Myers and
Hoenig 1997). In this method, length-based selectivity of red drum for
recreationally released fish is estimated by fitting a model for the expected tag
return rate of tagged fish through multiplying four factors: the number of fish
tagged by tag type and length bin, the tag recovery rate for recreationally
released fish and tag type, the exploitation rate by gear type and tag type, and
the selectivity of gear type in each length bin, with the equation in Appendix 2.
The tag recovery rate is the product of the proportion of fish that survive tagging,
the proportion of tags that are not lost (shed), and the proportion of recovered
tags that are reported. This method assumes that tag loss, tagging mortality, M,
and tag reporting are independent of length and age for recapture. It also
assumes exploitation and recovery did not change and that fish did not grow out
of their assigned length bin before recapture. For length-based analysis, the
maximum allowed time at-large and length bin designations were adjusted to
achieve the optimum combination given available data. If fish grew out of
11
Appendix 3
assigned length bins before recapture, the resultant selectivity curves could be
biased and the optimal combination was 100-mm length bins and 90-day time
periods (Burdick et al. 2006). The GENMOD procedure in SAS was use to
perform the analysis (SAS 2006) and data were log transformed with an
assumed binomial error distribution. The GENMOD procedure was modified to
scale to the length bin with the maximum selectivity.
Commercial discard estimates were not available for this assessment and
have not been available for previous assessments. Research is currently being
conducted to determine commercial discard estimates for the 2009 coastwide
assessment.
Methods
Separable Virtual Population Analysis (SVPA)
Previous red drum assessments used SVPA to estimate fishing mortality
(F) and population numbers. For this assessment, an SVPA was employed
solely to estimate the terminal year selectivity vectors for the FADAPT analyses.
For the SVPA, catch-at-age data (ages 1-5 and years 1986-2005) were divided
into the three previously defined management time periods. The catch-at-ages
were analyzed separately for each management period and B2 calculation.
The SVPA computer program requires specification of a fully recruited
reference age and relative selectivity for a second age (Clay 1990). Typically,
the selectivities of the first fully recruited age and the oldest age are equal; within
the model both would be equal to 1.0. This is not appropriate for this
assessment because of the decreased availability of older fish from harvest. In
the previous assessment, as well as this assessment, the age at full recruitment
was age-2 and the second age to be determined was age-3. How this selectivity
was determined varies by time period. For the early period, selectivity for age-2
and age-3 was considered equal. The selectivity of age-3 fish during the mid
period was initially estimated to be 0.43. This estimation was based on an
investigation of the size distribution of age-3 fish relative to age-2 fish that fell
within the 18 to 27 in TL slot limit for the northern region. This value was
considered inappropriate because the selectivity of 0.43 assumes no harvest of
red drum outside the slot limit and during the mid period harvest of one red drum
greater than 27 in TL was allowed. As a result an age-3 selectivity assumption of
0.7 was used in the 2000 stock assessment. This assumption is no longer
appropriate for the late period, as fish can no longer be harvested above the slot
limit.
For the late period, two selectivities were initially investigated. Because
the slot limit remained unchanged from the mid to late periods and harvest of red
drum greater than 27 in TL was prohibited, the 0.43 selectivity estimated for age-
3 red drum during the last assessment was considered for this assessment. A
second selectivity was estimated for age-3 red drum based on tag return
12
Appendix 3
analyses conducted on the NCDMF tagging data for red drum (Nathan Bacheler,
NCSU, unpublished data). A total of 22 years of tagging data from the NCDMF
were used to assess the effect of two previous regulation changes, occurring in
1991 and 1998, on F and selectivity patterns of red drum in North Carolina. The
model chosen was an age-dependent tag return model (Brownie et al. 1985;
Hoenig et al. 1998a; Hoenig et al. 1998b) that accounted for both harvest and
catch-and-release fishing by separating mortality of the tags (where the fish are
released alive but the tags are removed and reported) from mortality experienced
by the fish (Jiang et al. 2006). This model was very similar to the Jiang et al.
(2006) model, but age-dependent M values were input, and the model estimated
the tag reporting rate. Related equations can be found in Appendix 2. Tag
retention of less than 100% was accounted for the two different tag types. Red
drum were placed into four age groupings (age-1, age-2, age-3, and age-4+) at
tagging based on a 6-month age-length key provided by NCDMF, which provided
very good separation of length groupings. Hooking mortality was accounted for
using Jiang et al.’s (2006) method of adjusting F upwards given a previously
reported hooking mortality rate for red drum (10%; Jordan 1990) and an estimate
of F’, the tag mortality defined above. Burdick et al.’s (2006) estimate of annual
tag retention of dart tags (0.74) was used based on double tagging analyses and
annual tag retention of internal anchor tags (0.91). Age-dependent natural
mortality rates (0.30 for age-1, 0.22 for age-2, 0.16 for age-3, and 0.10 for age-4+
fish) were fixed based on a life history estimator that related M to body size
(Boudreau and Dickie 1989). The selectivity was allowed to vary by age and
regulation period in our model, and model parameters were estimated using
maximum likelihood estimators. Fish recovered within 7 days of tagging were
excluded to allow time for mixing to occur. Assumptions were: (1) no deaths
occurred from the tagging process, (2) tagged fish are independent, (3) equal
reporting rates whether harvested or released, (4) no ageing errors, (5) selectivity
of harvested and caught-and-released fish are equal, and (6) 7 days was enough
time to allowed fish to mix adequately. Overall, the model produced robust
estimates of age- and regulation period-specific selectivity that were usable in the
North Carolina red drum stock assessment. The age-3 specific selectivity
produced by this model for the late period was 0.48.
Spreadsheet Model
A forward projecting catch-age analysis was performed using Microsoft
Excel and iteratively solved using the Solver function to produce estimates of F
(Carmichael et al. 1999). This formulation allows for the inclusion of auxiliary
information. The data included in this model were the catch-at-age matrix for
1986-2005, the JAI for the NCDMF from 1991 to 2005, which was used to tune
recruitment estimates, and two MRFSS target indices, a CPUE and a probability
of success, which was used to tune total annual abundance from 1987 to 2005.
A second data configuration added the Pamlico Sound IGNS CPUE that was
used to tune ages 1 and 2 from 2001 to 2005. Three selectivity periods were
used to correspond to regulatory changes in the fishery. Each model run was
13
Appendix 3
restarted from several points to determine if the model had reached a global
solution and uses a lognormal error structure. Basic equations can be found in
Appendix 2.
FADAPT VPA
The FADAPT program is a modification of Gavaris (1988) by Restrepo
(1996) and was the preferred assessment model from the 2000 assessment.
This program does not assume separability and does allow for tuning by
abundance indices at age. The model requires that a terminal year selectivity be
input, which was determined by the SVPA runs (Table 14). Basic equations can
be found in Appendix 2.
Data inputs include the catch-at-age matrix from 1986 to 2005, the
NCDMF JAI from 1991 to 2005 and two MRFSS indices: a target CPUE from
1987 to 2005; and a probability of targeted trip successes from 1987 to 2005.
This configuration was an update of the 2000 assessment. Additional runs were
made including the Pamlico Sound IGNS CPUE for ages 1 and 2.
Escapement and SPR
The spawning stock biomass (SSB) for red drum cannot be directly
estimated because data on adult fish are lacking. Overfishing thresholds and
targets are determined through percent escapement and spawning potential ratio
(SPR). The SPR benchmarks set by the ASMFC Amendment 2 were a 30%
SPR threshold and a 40% SPR target. Escapement is determined as the
percentage of fish recruiting to the adult population at age-4.
SPR is calculated using the %Maximum Spawning Potential (%MSP)
method from Gabriel et al. (1989). Additional data required to calculate static
SPR are a female maturity schedule and the growth estimates from the von
Bertalanffy equation. Both escapement and SPR use the average F at age for
each time period, recreational B2 discard assumption, and selectivity
assumption. Basic equations can be found in Appendix 2.
Model Assumptions
The VPA models assume that the catch is aged without error. The
forward projecting spreadsheet model does not have that assumption. Both the
spreadsheet and FADAPT models tune to the catch-at-age matrix and the
incorporated indices. Indices are assumed to reflect the actual population
abundance and influences on abundance measurements (i.e. regulation changes
in a dependent index) must be kept in mind when including the indices and
analyzing the results. VPA models tend to exhibit some degree of retrospective
bias, where the estimates are initially either over or underestimated. As the
terminal year is replaced by subsequent terminal years, the estimates converge
14
Appendix 3
to a ‘true’ value. Concern about retrospective bias has resulted in the previous
assessments omitting the terminal year estimates from the average F at age
results, which was continued for this assessment. A limited retrospective
analysis was also conducted to determine the extent and possible effects of the
bias.
Data Limitations
Data limitations impact the assessment. There are no commercial
discards included in the catch estimates. Available data are inadequate to
estimate commercial discard levels. Therefore it is likely that model results are
optimistic, though to what extent is unknown. The length characteristics of the
B2 catch were estimated, as the MRFSS does not sample the fish that are
caught and released. The MRFSS sampling can be limited in particular areas. A
particular deficiency is the absence of intercepts for fisheries prosecuted at night.
There is a notable catch-and-release fishery for over the slot limit red drum that
occurs at night, though no extra red drum lengths would be observed, as fish
greater than 27 in should be released. The adult spawning population cannot be
estimated, therefore SSB is unknown and condition of the adult stock is inferred
through the escapement estimates. There is also limited independent data on
relative abundance of exploited ages (1-5).
Preferred Runs
The model configurations differed due to various assumptions and the
inclusion or exclusion of various indices. The major assumptions were for
selectivity and the assumed length frequencies of recreational discards. The red
drum PDT met and determined the preferred runs that would be considered for
the stock status determination. The decision was made to include runs with
selectivity vectors of 0.48 for the late period. Sensitivity runs using the 0.43
selectivity vectors were conducted and are detailed in Appendix 1. These runs
do indicate that lower selectivity vectors result in lower F estimates and higher
estimates of escapement and SPR and that the FADAPT model is more sensitive
to different selectivity vectors. While there are differences, 0.48 was selected as
the appropriate value because it was estimated quantitatively through the tagging
data and is more conservative than 0.43. The mid period used runs with a
selectivity vector of 0.7, which was used in the previous assessment to determine
stock status. The second major decision was selecting a preferred method to
estimate the size distribution of recreational discards. A decision was made to
solely use the TAGGING catch matrix in the late period as the preferred run. The
PDT selected the TAGGING catch matrix because the results are based on
analysis of observed recreational releases from the red drum fishery. In addition,
because the data are based on observed lengths, the TAGGING matrix includes
fish lengths not typically obtained by the MRFSS (the large fish released above
slot limit fish during a predominantly night time fishery). The remaining other
model runs for the late period using the various B2 discard assumptions can be
15

Appendix 3
found in Appendix 1. The mid period used the DELTA assumption for the
preferred run for both this and the previous assessments.
Results
Fishing Mortality (F)
FADAPT VPA
The inclusion or exclusion of the IGNS showed little difference in the
estimated F. Estimates of F for the late period ranged from 0.50 to 0.49 at age-2
for the TAGGING run (Table 15). Estimates of F at age-3 ranged from 0.24 to
0.23 and decreased dramatically for ages 4 and 5. The late period F vectors
were lower than the mid period F Delta vectors.
Spreadsheet Model
When compared to the FADAPT results, the spreadsheet model had
slightly greater variability in estimated F. Estimates of F for the late period were
higher in the spreadsheet VPA than were exhibited by the FADAPT estimates.
The TAGGING F ranged between 0.66 and 0.63 at age-2 (Table 16). Age-3
estimated F ranged from 0.32 to 0.30 then decreased dramatically at ages 4 and
5.
Escapement and SPR
FADAPT VPA
The escapement estimates for the TAGGING configurations ranged from
40.6% to 41.0% and the static SPR estimates were 40.4% to 40.8% (Table 15).
All of the TAGGING configurations were just above the 40% static SPR target.
Runs that included the IGNS indices were slightly lower than those runs that
were strict updates of the 2000 assessment.
Spreadsheet Model
The escapement estimates for the TAGGING configurations were 32.8%
and the static SPR estimates were 32.3% (Table 16). All the TAGGING
configurations were above the 30% static SPR threshold and below the 40%
static SPR target. Runs that included the IGNS indices were identical to those
runs that were strict updates of the 2000 assessment.
Model Fit and Configuration
The residual sum of squares (RSS) was examined to determine the
goodness of fit. The FADAPT runs including the IGNS indices fit slightly better
16
Appendix 3
than those that were strict updates of the 2000 assessment. When compared to
PROP runs (see Appendix 1), TAGGING runs had consistently smaller RSS,
indicating that TAGGING runs were better fits.
Residual plots for the tuning indices were examined (Figures 8-11).
Plotted values are the difference between the observed survey value and the
survey value predicted from the estimated catchability (q) and abundance. A
‘good’ residual plot shows a random scattering of points with no trends over time.
For TAGGING run, regardless of inclusion or exclusion of the IGNS index, the
MRFSS (CPUE and proportional) indices showed increasing trends through time
for the late period (Figures 8 and 9). This could indicate changes in catchability
over time. The residuals are only slightly different in magnitude between the
IGNS included and excluded runs. For the JAI indices, the scatter of points
appeared to be random (Figure 10). The IGNS indices also appear to be
randomly distributed (Figure 11). For all of these analyses, the time period is
fairly short as they have been constrained to the late period only and long-term
trends cannot be determined.
The spreadsheet analysis goodness of fit was determined using a
minimized sum of squares error for the catch and indices. The strict updates of
the 2000 assessment had lower values than did those runs with the IGNS index
included. Generally, the MRFSS CPUE and probability index estimates fit fairly
well with a few notable departures in 1990, 1998, and 2002 (Figure 12). While
the JAI estimates prior to 1996 were consistently over estimates and the IGNS
index fit fairly well, except for 2002, which was much higher than the population
estimate (Figure 13). Between IGNS included and excluded runs, predicted
values were quite similar (Figure 14).
FADAPT Retrospective Analysis
A retrospective analysis was conducted to examine the uncertainty in the
data for the assessment and the performance of the model configuration. The
preferred runs did exhibit some degree of retrospective pattern. However, while
the direction was relatively consistent, the magnitude and the duration did not
exhibit clear consistency. Generally, F is overestimated and, as time passes, the
estimates decrease (Figures 15 and 16). This is particularly true in 2002. The F
overestimation in the 2002 terminal year was the highest of any years examined
in the retrospective analysis. Typically, the bias is resolved within two to four
years. The convergence is not perfect and there are some years in some
configurations (2005 in the TAGGING configuration) that remain lower
throughout the converged time series (Figures 15 and 16). The variation
between runs was largely without pattern, except that 2002 consistently had the
highest F values at ages two and three.
17

Appendix 3
Discussion
The current red drum assessment indicates that F has decreased and
escapement and static SPR have increased for the red drum northern stocks
during the current (late) management period. The results from the 2000 stock
assessment indicated that overfishing was occurring; with static SPR values
were well below the threshold SPR. The current model estimates are all above
30% static SPR and, therefore, indicate that overfishing is not occurring. In
general, it appears that the condition of the northern red drum stock has
improved and that the more restrictive management measures implemented
during the late period have aided in that improvement.
Results for both models, including and excluding the IGNS indices, over
the entire assessment time period are summarized below:
Period Model/Run F Escapement SPR
Early FADAPT/BASE1 1.39 1.0 1.1
Spreadsheet/TAGGING IGNS 1.31 2.3 2.4
Spreadsheet/TAGGING 1.32 2.2 2.3
Mid FADAPT/DELTA 0.75 18.3 18.7
Spreadsheet/TAGGING IGNS 0.59 30.3 30.4
Spreadsheet/TAGGING 0.60 30.1 30.3
Late FADAPT/TAGGING IGNS 0.50 40.6 40.4
FADAPT/TAGGING 0.49 41.0 40.8
Spreadsheet/TAGGING IGNS 0.66 32.8 32.3
Spreadsheet/TAGGING 0.63 32.8 32.3
Assumptions of table runs (above)
: The B2 assumptions in the early and mid
periods were the same across both models (early used BASE1 and mid used
DELTA). The notation of TAGGING in the early and mid periods denotes the B2
assumption made in the late period only. Highlighted rows in early and mid
periods denote preferred model runs. The early period age-2 to age-3 selectivity
was 1.0 and 1.0. The mid period age-2 to age-3 selectivity was 1.0 to 0.7 and
the late period age-2 to age-3 selectivity was 1.0 to 0.48. The external review
also recommended using the TAGGING as the preferred run.
When compared with the 2000 stock assessment results, the average F
values in the current assessment do not appear to be greatly different than those
in the previous assessment, yet the estimates of SPR were improved (Tables 15-
16). This may be the result of changes in selectivity between the two periods.
During the mid period, the harvest of a single red drum over the slot limit was
allowed. During the late period, possession of red drum over the slot was
prohibited. This prohibition likely decreased F on the older fish and thus would
have resulted in higher SPR estimates. Other possible reasons are the overall
18
Appendix 3
decrease in harvest, which occurred at basically all ages and may have had a
more considerable cumulative effect.
The spreadsheet model indicated few differences in terms of F,
escapement, and static SPR between the mid and late regulation periods. It
should be noted that during the previous assessment, the red drum TC
considered the results of the spreadsheet model to be optimistic and that may
continue to be true for the period. This was not true of the late period, as both
models gave more similar results with the spreadsheet estimating static SPR
values that were less optimistic than the FADAPT. The mid period has remained
highly divergent between the two models. It may be the result of the significant
change in regulation that occurred between the early and mid periods, as the
FADAPT estimates were determined in discrete periods while the spreadsheet
estimated the entire time period with the selectivity fixed by period. It is not clear
why the differences still exist but the spreadsheet mid period estimates may still
be considered high.
The retrospective analysis indicated that the model configurations or data
exhibit some uncertainty. The 2000 assessment did not include the terminal year
in the average F at age calculation from the FADAPT because of retrospective
bias concerns. The bias tendency is to overestimate F and to converge within
two to four years. Therefore, estimates for the late management period may be
conservative in nature. However, while there appears to be direction in the bias,
it is important to note that the estimates are clearly uncertain in the most recent
years.
The other source of uncertainty is discard characterization for, both the
commercial and recreational fisheries. Commercial discards are not included in
the assessment because reliable estimates are not available. The length
frequencies could be inferred in a similar manner as the DELTA method, but the
magnitude, unlike the B2 estimates, is unknown. While the quantity of loss due to
discards in the gill net fisheries continues to be unknown, the NCDMF has taken
steps to minimize the loss of undersized red drum. In October of 1998, as part of
the North Carolina Red Drum FMP, measures were taken requiring the attendance
of small mesh gill nets (<5” stretch mesh). Gill nets of this mesh size select for red
drum less than 18” TL and are a significant source of the bycatch mortality,
particularly in months when water temperatures are high. Current North Carolina
regulations require the attendance of small mesh gill nets from May 1 through
October 31 in areas known to be critical for juvenile red drum. These include all
primary and secondary nursery areas, areas within 200 yd of any shoreline, and
the extensive area of shallow grass flats located behind the Outer Banks.
Because commercial discard mortalities were not included, the overall fishing
mortality is likely underestimated and the escapement and SPR are likely
overestimated to an unknown degree. Recreational discards are estimated, but
the length and age characterization must be inferred, as it cannot be directly
measured. The red drum PDT believed that the assumed TAGGING discard
19
Appendix 3
length frequency distributions most accurately reflected the current recreational
fishery releases.
Current and ongoing research using tagging data from North Carolina fish
was explored in this assessment. The age-3 selectivity for the current regulation
period estimated from the tagging model was 0.48, which was similar to 0.43, the
estimate from the length frequency analysis done for the 2000 assessment. The
analysis of the NCDMF tagging data that was incorporated into the TAGGING
run was capable of examining fish that were captured and released for regulatory
reasons. It found that the late regulatory period had the highest estimate of older
fish in the CAA of any of the discard assumptions (Table 13). This may be a
reflection of a catch-and-release fishery that exists for red drum over the slot
limit. The sizes and ages of fish captured in the over the slot limit fishery could
not be captured in MRFSS and therefore could not be appropriately factored into
the CAA. The tagging studies had returns from the over the limit fishery, which
were the basis for the TAGGING CAA.
Research Recommendations
The previous assessment listed the following as the three primary needs
for future assessments: 1) Catch statistics (sampling of at-sea discards in
particular), 2) Length frequency distributions by gear, and 3) age-length keys. Of
these, commercial at-sea discards and discard size frequencies remain data
gaps for this update.
The lack of at-sea commercial discard sampling continues to be a data
limitation in the northern region. The needed data include the amount of fish
discarded, the discard mortality by gear type, and the size distribution of those
discarded fish. The data on recreational discards continue to be limited in terms
of characterizing the fish size distribution. The tagging model estimates may be
a step in the direction of observed size distributions. All the methods for
recreational B2 size distribution continue to be limited because a common size
distribution is used throughout a regulation period. Methods for determining size
distribution on an annual basis should be investigated. Also, as recreational
landings represent the majority of landings coastwide, the MRFSS intercepts
should be increased to accurately characterize this large segment of the total
fishery.
The VPA models that were used for this update can be sensitive to M.
Better estimates of both subadult M and adult M should be investigated. The
model was also demonstrated to be sensitive to changes in the selectivity vector.
Research should continue to determine vectors that most closely represent the
fishery selectivity and the migration pattern of the fish. Maturity at age was last
investigated in 1995 and that data should be updated to reflect the current
population conditions as much as possible.
20
Appendix 3
The current TAGGING configuration is based analysis of tagging data that
allowed for the combined selectivity of harvest and released fish to be estimated.
Updated tagging models conducted during the completion of the assessment
allow for separate selectivity estimates for harvested and released fish (Bacheler
et al., In progress). Altering the models to accommodate two selectivities based
on the fate of the fish was beyond the scope of this update, but should be
investigated for future assessments.
The previous assessment called for continued standardized sampling of
the subadults. The northern region had a single fishery-independent index at the
time of the last assessment (the North Carolina JAI). Currently, there is also the
North Carolina IGNS, which was included as a tuning index for this assessment.
Though the time series is short (2001-2005), the IGNS index could track the
large 2001 cohort and may be a good indicator of recruitment to the fishery.
Future assessment should thoroughly examine the index for its use in those
assessments.
There is still a need for the monitoring of adult red drum to provide a
fishery-independent spawning stock index. As was discussed in the previous
assessment, applying a VPA to the entire age structure, which would extend
through ages 50 to 55, is functionally impractical. There are currently very few
adult fish age samples and because of the extremely slow adult growth there are
too many ages that could be applied to a given length. However, information on
the adult population abundance, length, and age structure could provide some
indication of the condition of the spawning red drum stock.
21
Appendix 3
Literature Cited
Atlantic States Marine Fisheries Commission (ASMFC). 2002. Amendment 2 to
the Interstate Fishery Management Plan for Red Drum. Fisheries
Management Report No. 38. ASFMC, Washington, DC, 142 pp.
Bacheler, N.M., J.E. Hightower, L.M. Paramore, J.A. Buckel, and K.H. Pollock. In
progress. Changes in fishing mortality and selectivity of North Carolina red
drum due to fishery regulations: estimates from an age-dependent tag
return model. North American Journal of Fisheries Management.
Barrios, A.T. 2004. Use of passive acoustic monitoring to resolve spatial and
temporal patterns of spawning activity for red drum, Sciaenops ocellatus,
in the Neuse River Estuary, North Carolina. M.S. Thesis, North Carolina
State University, 97 pp.
Boudreau, P.R. and L.M. Dickie. 1989. Biological model of fisheries production
based on physiological and ecological scalings of body size. Can. J. Fish.
Aquat. Sci. 46: 614-623.
Brownie, C., D.R. Anderson, K.P. Burnham, and D.S. Robson. 1985. Statistical
inference from band-recovery data – a handbook, 2
nd
edition. United
States Department of the Interior Fish and Wildlife Service, Resource
Publication 156.
Burdick, S.M., J.E. Hightower, J.A. Buckel, L. Paramore and K.H. Pollock. 2006.
Movement and selectivity of red drum and survival of adult red drum: an
analysis of 20 years of tagging data. NCDMF, Final Report, Morehead
City, North Carolina.
Carmichael, J.T., J.E. Hightower, and S.E. Winslow. 1999. Spreadsheet based
catch at age assessment of blueback herring in the Chowan River, North
Carolina. Abstracts for American Fisheries Society, 129
th
Annual Meeting,
Charlotte, NC.
Clark, W.G. 1991. Groundfish exploitation rates based on life history
parameters. Can. J. Fish. Aquat. Sci. 38: 297-307.
Clark, W.G. 1993. The effect of recruitment variability on the choice of a target
level of spawning biomass per recruit. Univ. Alaska Sea Grant College
Program, Rep. No. 93-02: 233-246.
Clay, D. 1990. TUNE: a series of fish stock assessment computer programs
written in FORTRAN for microcomputers (MS DOS). International
22
Appendix 3
commission for the conservation of Atlantic Tunas, Coll. Vol. Sci. Pap. 32:
443-460.
Cowan, J.H., Jr., R.L. Shipp, H.K. Bailey, IV, and D.W. Haywick. 1995.
Procedure for rapid processing of large otoliths. Trans. Am. Fish. 124(2):
280-282.
Daniel, L.B. III. 1988. Aspects of the biology of juvenile red drum, Sciaenops
ocellatus and spotted seatrout, Cynoscion nebulosus (Pisces: Sciaenidae)
in South Carolina. M.S. Thesis, College of Charleston, 58 pp.
Gabriel, W.L., M.P. Sissenwine, and W.J. Overholtz. 1989. Analysis of
spawning stock biomass per recruit: an example for Georges Bank
haddock. N. Am. J. Fish. Manage. 9: 383-391.
Gavaris, S. 1988. An adaptive framework for the estimation of population size.
Can. Atl. Fish. Sci. Adv. Comm. (CAFSAC) Res. Doc. 88/29, 12 pp.
Hoenig, J., N. Barrowman, W. Hearn, and K. Pollock. 1998a. Multiyear tagging
studies incorporating fishing effort data. Canadian Journal of Fisheries and
Aquatic Sciences 55:1466-1476.
Hoenig, J., N. Barrowman, K. Pollock, E. Brooks, W. Hearn, and T. Polacheck.
1998b. Models for tagging data that allow for incomplete mixing of newly
tagged animals. Canadian Journal of Fisheries and Aquatic Sciences
55:1477-1483.
Holiman, S.G. 1996. Estimating recreational effort using the Marine
Recreational Fisheries Statistics Survey Data. NOAA Tech. Mem. NMFS-
SEFSC-389, 53 pp.
Jiang, H. 2005. Age-dependent tag return models for estimating fishing mortality
natural mortality and selectivity. Doctoral dissertation. North Carolina
State University, Raleigh, North Carolina.
Jiang, H., K.H. Pollock, C. Brownie, J.M. Hoenig, R.J. Latour, B.K. Wells, and
J.E. Hightower. 2006. Tag return models for catch-and release fisheries:
Striped bass natural mortality estimates change with age and calendar
year. North American Journal of Fisheries Management, In Press.
Johnson, G.D. 1978. Development of fishes of the mid-Atlantic Bight. An atlas
of egg, larval and juvenile stages. Vol IV. U.S. Fish and Wildlife Service,
Biological Services Program. FSW/OBS-78/12: 190-197.
Jordan, S.R. 1990. Mortality of hook-caught red drum and spotted seatrout in
Georgia. Georgia Department of Natural Resources, Brunswick, Georgia.
23
Appendix 3
Lupton, B.Y. and P.S. Phalen. 1996. Designing and Implementing a Trip Ticket
Program. North Carolina Division of Marine Fisheries, Morehead City,
NC. 32 pp + appendices.
Luczkovich, J.J., L.B. Daniel, III, and M.W. Sprague. 1999. Characterization of
critical spawning habitats of weakfish, spotted seatrout and red drum in
Pamlico Sound using hydrophone surveys. Completion Report F-62, 1-
128. NCDMF, Morehead City, NC.
Lux, F. F. and J. V. Mahoney. 1969. First record of the channel bass Scianops
ocelltaus (Linnaeus), in the Gulf of Maine. Copeia 3: 632-633
Marks, R.E. and G. DiDomenico. 1996. Life history aspects of selected marine
recreational fishes in North Carolina. Tagging studies, maturity, and
spawning of red drum (Sciaenops ocellatus) in North Carolina.
Completion report F-43, Segment 1, North Carolina Division of Marine
Fisheries, Morehead City, NC. 38 pp.
Mercer, L.P. 1984. A biological and fisheries profile of red drum, Sciaenops
ocellatus. North Carolina Division of Marine Fisheries. Special Scientific
Report 41. Morehead City, NC.
Murphy, M.D. 2005. A stock assessment of red drum, Sciaenops ocellatus, in
Florida: status of the stocks through 2003. In-House Report 2005-XXX,
Florida Fish and Wildlife Commission Fish and Wildlife Research Institute,
St. Petersburg, 31 p. see:
http://www.floridamarine.org/features/view_article.asp?id=14056
Myers, R.A. and J.M. Hoenig. 1997. Direct estimates of gear selectivity from
multiple tagging experiments. Canadian Journal of Fisheries and Aquatic
Science 54:1-9.
Pearson, J.C. 1929. Natural history and conservation of the redfish and other
commercial sciaenids on the Texas coast. Bull. U.S. Bureau of Fish. 44:
129-214.
Restrepo, V.R. 1996. FADAPT Version 3.0, A guide. University of Miami,
RSMAS, 4600 Rickenbacker Causeway, Miami, FL. 21 pp.
Ross, J.L. and T.M. Stevens. 1992. Life history and population dynamics of red
drum (Sciaenops ocellatus) in North Carolina waters. Marine fisheries
Research completion Report, Project F-29. North Carolina DMF,
Morehead City, NC.
24
Appendix 3
Ross, J.L., T.M. Stevens, and D.S. Vaughan. 1995. Age, growth, and
reproductive biology of red drums in North Carolina waters. Trans. Am.
Fish. Soc. 124: 37-54.
SAS. 2006. SAS System fro Windows V9.1. Cary, North Carolina.
South Atlantic Fishery Management Council (SAFMC). 1990. Profile of the
Atlantic Coast Red Drum Fishery and Source Document for the Atlantic
Coast Red Drum Fishery Management Plan. Charleston, SC: 144 pp.
Vaughan, D.S. 1992. Status of the red drum stock of the Atlantic coast: Stock
assessment report for 1991. NOAA Tech. Mem NMFS-SEFC-297. 58 pp.
Vaughan, D.S. 1993. Status of the red drum stock of the Atlantic coast: Stock
assessment report for 1992. NOAA Tech. Mem. NMFS-SEFC-313. 60
pp.
Vaughan, D.S. 1996. Status of the red drum stock of the Atlantic coast: Stock
assessment report for 1995. NOAA Tech. Mem. NMFS-SEFC-380. 50
pp.
Vaughan, D.S. and J.T. Carmichael. 2000. Assessment of Atlantic Red Drum
for 1999: Northern and Southern Regions. NOAA Tech. Mem. NMFS-
SEFSC-447.
Vaughan, D.S. and T.E. Helser. 1990. Status of the red drum stock of the
Atlantic coast: Stock assessment report for 1989. NOAA Tech. Mem.
NMFS-SEFC-263. 50 pp.
von Bertalanffy, L. 1938. A quatitative theory of organic growth. Human Biol.
10: 181-213.
Wenner, C.A., W.A. Roumillat, J.E. Moran, Jr., M.B. Maddox, L.B. Daniel, III, and
J.W. Smith. 1990. Investigations of the life history and population
dynamics of marine recreational fishes in South Carolina: Part 1. Final
Rep., Proj. F-37, SC Wildl. Mar. Resour. Dept., Mar. Resour. Res. Inst.,
180 pp.
25

Appendix 3
Table 1. Annual commercial landings (lb) of red drum by state along the mid-
Atlantic coast.
Year RI NY NJ DE MD VA NC SC GA FL* Total
1972 - - - - - 5,900 42,919 1,200 3,400 128,400 181,819
1973 - - - 900 - 6,200 70,264 600 3,700 166,500 248,164
1974 - - - - - 15,700 142,437 2,300 3,100 137,300 300,837
1975 - - - 200 - 19,600 214,236 12,400 10,000 83,300 339,736
1976 - - - - - 18,600 168,259 2,600 7,300 106,000 302,759
1977 - - - 200 - 300 19,637 800 5,000 103,500 129,437
1978 - - - 300 - 2,100 21,774 4,325 328 104,696 133,523
1979 - - - - 100 1,900 126,517 1,767 935 92,684 223,903
1980 - - - - - 400 243,223 4,107 1,493 191,222 440,445
1981 - - - - - 200 93,420 - 261 258,374 352,255
1982 - - - - - 1,700 52,561 2,228 251 139,170 195,910
1983 - - - - 100 41,700 219,871 2,274 1,126 105,164 370,235
1984 - - - - - 2,600 283,020 3,950 1,961 130,885 422,416
1985 - - - - - 1,100 152,676 3,512 3,541 88,929 249,758
1986 - - - - 1,000 5,400 249,076 12,429 2,939 77,070 347,914
1987 - - - - - 2,600 249,657 14,689 4,565 42,993 314,504
1988 - - - - 8,100 4,000 220,271 - 3,281 284 235,936
1989 - - - - 1,000 8,200 274,356 165 3,963 - 287,684
1990 - - - - 29 1,481 183,216 - 2,763 - 187,489
1991 - - - - 7,533 24,771 96,045 - 1,637 - 129,986
1992 - - - - 1,087 2,352 128,497 - 1,759 - 133,695
1993 - - - - 55 8,637 238,099 - 2,533 - 249,324
1994 5,094 ---859 4,080 142,119 - 2,141 - 154,293
1995 - 668 - - 6 2,992 248,122 - 2,578 - 254,366
1996 - 8 - - 215 2,073 113,338 - 2,271 - 117,905
1997 43 - - - 22 4,049 52,502 - 1,395 - 58,011
1998 165 57 311 - 336 6,436 294,366 - 672 - 302,343
1999 - 47 241 6 504 12,368 372,942 - 1,115 - 387,223
2000 - 1,215 - - 843 11,457 270,953 - 707 - 285,175
2001 - 58 14 - 727 5,318 149,616 - - - 155,733
2002 - 116 - - 1,161 7,752 81,364 - - - 90,393
2003 - 43 - - 631 2,716 90,525 - - - 93,915
2004 - - - - 12 638 54,086 - - - 54,736
2005 - - - - 37 656 128,770 - - - 129,463
Total 5,302 2,212 566 1,606 24,357 235,976 5,488,734 69,346 76,715 1,956,471 7,861,285
*Florida landings are for the East coast of Florida only.
26

Appendix 3
Table 2. Percentage of commercial landings of red drum in North Carolina by
water area.
Year
Total
1972 0.70 40.39 20.07 0.23 34.32 4.04 0.24 - 100
1973 0.24 46.69 31.79 0.31 19.41 1.21 0.35 - 100
1974 0.65 24.87 29.06 5.61 36.57 2.22 1.02 - 100
1975 6.17 50.97 10.58 2.54 25.12 4.23 0.39 - 100
1976 18.22 16.56 3.01 2.46 32.57 26.28 0.89 - 100
1977 - 31.84 20.81 0.96 33.13 12.54 0.72 - 100
1978 - 71.69 8.97 - 14.97 4.37 - - 100
1979 0.08 21.06 39.47 0.40 27.86 10.87 0.27 - 100
1980 - 29.26 27.12 0.06 36.44 6.78 0.34 - 100
1981 - 29.85 12.97 - 53.39 3.41 0.39 - 100
1982 0.33 58.57 17.32 0.21 14.43 5.61 3.54 - 100
1983 0.82 31.54 26.87 0.53 24.27 3.33 12.65 - 100
1984 0.25 58.39 19.68 0.85 7.16 2.60 11.08 - 100
1985 0.03 47.78 21.47 0.02 9.45 0.76 20.48 - 100
1986 1.68 27.81 20.78 0.23 24.65 11.19 13.66 - 100
1987 13.03 16.78 19.51 2.17 28.85 8.26 11.41 - 100
1988 5.02 23.19 26.03 0.60 24.96 9.12 11.08 - 100
1989 3.57 19.31 23.02 1.50 35.68 7.14 9.77 - 100
1990 0.43 26.04 21.79 1.16 35.34 1.88 13.37 - 100
1991 5.56 13.95 22.44 1.03 36.94 1.57 18.51 - 100
1992 9.37 10.75 13.32 3.19 47.02 1.99 14.34 - 100
1993 19.07 15.08 6.65 5.75 41.23 2.54 9.68 - 100
1994 6.74 24.39 4.76 0.71 51.75 4.02 7.63 - 100
1995 1.75 10.73 8.51 1.33 63.39 6.73 7.56 - 100
1996 1.26 15.20 12.71 0.46 42.75 7.33 20.28 <0.01 100
1997 0.70 13.39 22.77 2.73 40.02 6.83 13.56 - 100
1998 6.94 2.27 3.39 5.29 76.40 2.84 2.87 - 100
1999 19.64 1.90 6.17 11.42 50.06 7.16 3.66 - 100
2000 9.38 10.40 5.92 15.73 46.14 7.65 4.77 - 100
2001 7.82 4.83 9.01 20.65 43.00 9.53 5.15 - 100
2002 9.68 2.68 10.28 14.09 32.02 20.01 11.24 - 100
2003 6.31 3.62 8.88 16.63 33.86 15.13 15.55 - 100
2004 3.09 5.73 10.48 12.71 47.16 6.35 14.47 - 100
2005 6.11 2.37 14.71 5.33 40.05 18.55 12.87 - 100
Pamlico
Sound
Pamlico/
Neuse
River
Bogue
Sound
south Unknown
Albermarle
Sound
Atlantic
Ocean
Core
Sound
Croatan
and
Roanoke
Sounds
27

Appendix 3
Table 3. North Carolina red drum catches for recreational anglers (MRFSS), for
1989 – 2005 with PSE. All weights are in pounds. Commercial weights are
included as a reference with combined weights reported.
A + B1* B2*
A
+ B1 Commercial Total
Y
ear # Landed PSE # Released PSE
Weight (lb)
PSE Weight (lb) Weight (lb)
1986 17,501 66 - . 31,594 67 249,076 280,670
1987 61,100 20 18,499 37 166,031 28 249,657 415,688
1988 142,626 18 24,874 58 451,979 29 220,271 672,250
1989 62,359 16 7,566 34 214,851 20 274,356 489,207
1990 33,149 28 12,452 38 302,996 64 183,216 486,212
1991 38,658 15 121,178 14 108,269 16 96,045 204,314
1992 23,593 19 60,230 18 109,136 20 128,497 237,633
1993 49,493 12 182,301 20 266,461 14 238,099 504,560
1994 28,953 16 107,662 14 192,062 21 142,119 334,181
1995 83,686 11 155,421 10 382,431 11 248,122 630,553
1996 35,061 13 34,286 18 194,136 14 113,338 307,474
1997 8,580 26 254,219 11 38,286 28 52,502 90,788
1998 114,638 12 199,701 11 591,435 13 294,366 885,801
1999 64,739 14 247,146 10 326,307 15 372,942 699,249
2000 61,618 13 203,967 14 316,032 12 270,953 586,985
2001 23,142 16 238,552 14 132,580 17 149,616 282,196
2002 42,541 15 640,857 11 182,227 17 81,364 263,591
2003 25,481 16 75,561 15 118,809 18 90,525 209,334
2004 30,165 19 191,593 10 114,435 19 54,086 168,521
2005 53,154 21 327,859 15 242,021 21 128,770 370,791
Numbers
Recreational
Definitions of recreational catch type:
*A = fish brought ashore in whole form which can be identified, enumerated,
weighed, and measured by interviewers.
*B = fish not brought ashore that can be separated into: B1 = fish caught used as
bait, filleted, or discarded & B2 = those released alive.
28

Appendix 3
Table 4. Northern region red drum catches for recreational anglers (MRFSS), for
1989 – 2005 with PSE. All weights are in pounds. Commercial weights are
included as a reference with combined weights reported.
A + B1* B2*
A
+ B1 Commercial Total
Y
ear # Landed PSE # Released PSE
Weight (lb)
PSE Weight (lb) Weight (lb)
1986 58,444 27 7,595 68 931,280 55 255,476 1,186,756
1987 63,286 19 18,499 37 191,830 24 252,257 444,087
1988 146,938 18 28,832 51 461,009 29 232,371 693,380
1989 75,381 14 17,521 30 244,434 18 283,556 527,990
1990 34,427 27 13,386 36 305,674 64 184,726 490,400
1991 58,522 16 140,071 15 144,486 14 128,349 272,835
1992 36,867 19 75,914 17 164,462 20 131,936 296,398
1993 63,498 14 232,736 18 311,967 12 246,791 558,758
1994 30,331 16 118,346 13 195,746 20 152,152 347,898
1995 87,350 10 187,699 11 448,449 10 251,788 700,237
1996 35,631 13 36,712 17 195,643 14 115,634 311,277
1997 10,495 24 366,469 13 40,081 27 56,616 96,698
1998 127,709 11 296,129 10 626,296 12 301,671 927,967
1999 77,164 14 482,187 16 419,102 15 386,108 805,210
2000 84,222 12 401,966 19 411,628 12 284,468 696,096
2001 30,384 15 268,917 13 184,471 13 155,733 340,204
2002 98,131 14 1,461,896 9 353,455 15 90,393 443,848
2003 39,088 17 122,606 17 176,023 17 93,915 269,938
2004 35,140 19 224,809 10 146,183 19 54,736 200,919
2005 55,827 20 359,005 14 249,387 21 129,463 378,850
Recreational
Numbers
Definitions of recreational catch type:
*A = fish brought ashore in whole form which can be identified, enumerated, weighed,
and measured by interviewers.
*B = fish not brought ashore that can be separated into: B1 = fish caught used
as bait, filleted, or discarded & B2 = those released alive.
29

Appendix 3
Table 5. The number of NCDMF award citations issued on an annual basis for
catches of red drum. Citations are awarded for releases ≥ 40 in and weigh-ins* ≥
45 lb.
Yea
r
# Citations # Released % Released
1987 215 150 70
1988 324 266 82
1989 335 275 82
1990 419 374 89
1991 335 308 92
1992 451 427 95
1993 644 627 97
1994 876 868 99
1995 622 607 98
1996 685 655 96
1997 737 704 96
1998 515 483 94
1999 1,073 1,073 100
2000 1,200 1,200 100
2001 1,156 1,156 100
2002 1,330 1,330 100
2003 1,030 1,030 100
2004 1,337 1,337 100
2005 1,520 1,520 100
*Due to regulations all citations since 1999 are for release only.
Table 6. Primary size and bag limits for recreational and commercial fisheries
within each of the regulatory periods for North Carolina.
Regulation period Recreational regulations Commercial regulations
1987-1991 14 in TL minimum size limit
Only 2 fish over 32 in TL
14 in TL minimum size limit
1992-1998 18-27 in TL slot limit
5 fish bag limit
1 fish >27 in TL allowed
250,000 lb commercial cap
18-27 in TL slot limit
1 fish >27 in TL allowed (no sale)
1999-2004 18-27 in TL slot limit
1 fish bag limit
18-27 in TL slot limit
7 fish daily trip limit
30

Appendix 3
Table 7. Commercial length frequencies by regulation period sampled from major North Carolina fisheries. TL measured
in inches.
Total
Early Mid Late
Length
Gill Haul Pound Trawl Gill Haul Pound Trawl Gill Haul Pound Trawl
70.000.000.000.000.000.010.000.000.000.000.000.00
80.005.340.000.000.000.140.000.000.000.000.000.00
90.000.000.000.000.000.150.000.000.000.000.000.00
10 0.00 8.68 0.00 0.00 0.00 0.38 0.00 1.24 0.00 0.00 0.00 0.00
11 0.13 12.24 0.00 0.00 0.03 0.02 0.00 1.24 0.00 0.00 0.00 0.00
12 0.13 14.57 27.83 0.00 0.07 0.27 0.51 2.48 0.00 0.00 0.44 0.00
13 2.96 6.34 1.74 0.00 0.08 0.59 0.00 1.24
0.05
0.00 0.00 0.00
14 17.37 4.67 5.22 0.00 0.12 0.51 0.51 1.24
0.05
0.00 0.00 0.00
15 24.58 7.23 12.17 9.52 0.10 0.15 0.51 0.00 0.00 0.00 0.00 0.00
16 11.58 3.56 9.57 0.00 0.32 0.10 1.02 0.00
0.05
0.00 0.00 0.00
17 14.41 10.68 9.57 9.52 4.15 2.34 2.54 0.00
1.81 2.86 0.89
0.00
18 15.32 5.90 14.78 0.00 12.79 25.01 3.55 0.00
12.16 10.71 7.11
0.00
19 7.21 1.11 6.96 9.52 20.03 16.56 2.03 0.00
8.81 17.14 6.67
0.00
20 1.42 0.67 1.74 4.76 17.85 7.06 1.52 0.00
7.12 14.29 0.44
0.00
21 1.67 13.90 0.87 0.00 8.56 5.72 0.51 3.73
8.54 9.29 3.11 44.44
22 0.39 0.22 0.00 0.00 4.96 14.17 5.08 0.00
12.719.296.67
0.00
23 0.13 2.56 0.00 0.00 9.93 9.38 11.68 11.18
14.55 7.86 11.11 6.67
24 0.51 0.11 0.87 0.00 7.59 11.57 14.72 18.63
14.76 5.71 23.11 8.89
25 0.26 0.33 1.74 0.00 5.10 4.41 25.38 22.36
10.42 7.14 18.22 6.67
26 0.00 0.22 0.87 0.00 5.53 0.89 20.30 16.77
6.08 3.57 14.22 22.22
27 0.00 0.22 0.00 0.00 2.08 0.06 6.60 14.91
1.95 3.57 5.78
0.00
28 0.13 0.00 2.61 0.00 0.37 0.00 0.51 0.00
0.55 5 1.78 4.44
29 0.26 0.00 0.87 0.00 0.13 0.00 0.51 0.00
0.29 2.14 0.44 4.44
30 0.13 0.00 0.00 0.00 0.03 0.00 0.00 0.00
0.02 0.71
0.00 0.00
31 0.00 0.00 0.00 0.00 0.06 0.00 0.51 0.00
0.07 0.71
0.00 0.00
32 0.00 0.00 0.00 0.00 0.06 0.51 1.02 0.62 0.00 0.00 0.00
2.22
33 0.26 0.00 0.00 0.00 0.02 0.00 0.00 0.00 0.00 0.00 0.00 0.00
34 0.00 0.00 0.00 4.76 0.02 0.00 0.00 0.00 0.00 0.00 0.00 0.00
35 0.00 0.00 0.00 0.00 0.00 0.00 0.00 0.00 0.00 0.00 0.00 0.00
36 0.00 0.00 0.00 0.00 0.00 0.00 0.00 0.62 0.00 0.00 0.00 0.00
37 0.00 0.00 0.00 0.00 0.00 0.00 0.00 0.62 0.00 0.00 0.00 0.00
38 0.00 0.00 0.00 0.00 0.00 0.00 0.00 2.48 0.00 0.00 0.00 0.00
39 0.00 0.11 0.00 0.00 0.00 0.00 0.51 0.00 0.00 0.00 0.00 0.00
40 0.13 0.11 0.00 0.00 0.01 0.00 0.00 0.00 0.00 0.00 0.00 0.00
41 1.03 1.22 2.61 61.90 0.03 0.00 0.51 0.62 0.00 0.00 0.00 0.00
31

Appendix 3
Table 8. Commercial sampling intensity of major gears, determined by numbers
of fish sampled per thousand lb of catch, 1999-2005. Gill net includes estuarine
gill nets, sink nets, beach seines, and others.
1999 2000 2001 2002 2003 2004 2005
Gill net 2.6 2.6 2.7 5.6 4.3 6.2 6.2
Pound net 6.0 2.6 6.1 6.9 0.8 3.2 7.8
Long haul seine 8.7 13.2 4.0 31.5 16.9 6.0 3.4
Ocean Trawl 0 21.2 16.8 0 0 0 0
Table 9. Age-length key for the northern red drum stock, 1999-2005.
Age by period 7 9 11 13 15 17 19 21 23 25 27 29 31 33 35 37 39 41 Total
1999
1 100 100 56.6 49.17 33.64 25 10.2 2.53 0 0 0 0 0 0 0 173
2 0 0 43.4 50.83 66.36 75 75.51 77.22 83.78 50 22.22 33.33 0 0 0 391
3 0 0 0 0 0 0 14.29 20.25 16.22 50 77.78 66.67 0 0 0 51
6 0 0 0 0 0 0 0 0 0 0 0 0 100 100 100 14
2000
1 100 100 100 63 43.93 43.53 12.9 0 0 0 0 0 0 0 0 0 0 133
20003756.0756.47 85.7 90.63 73.68 48.94 6.9 7.14 0 0 0 0 0 289
3000 0 0 01.43 9.38 26.32 51.06 90 85.71 78.57 50 0 0 0 98
4000 0 0 0 0 0 0 03.57.1421.43 50 100 100 0 10
6000 0 0 0 0 0 0 0 0 0 0 000 100 7
2001
1 100 94 40.4 33.77 27.78 15.2 0 0 0 0 0 0 0 0 0 0 91
2 0 5.9 59.6 66.23 72.22 84.9 71.74 44.44 14.52 8.3 0 0 0 0 0 0 247
3 0 0 0 0 0 0 28.26 55.56 85.48 83 53.85 0 25 0 0 0 129
4 0 0 0 0 0 0 0 0 0 8.3 46.15 100 75 50 0 0 20
5 000000000000050100 0
6 000000000000000100
2002
1 94 60 63.29 44.23 30.9 4.76 0 0 0 0 0 0 0 0 0 150
2 6.3 40 36.71 55.77 69.1 95.24 92.86 92.31 70 0 0 0 0 0 0 243
3 0 0 0 0 0 0 7.14 7.69 20 16.67 0 100 33 0 0 9
4 0 0 0 0 0 0 0 0 10 83.33 100 0 0 0 0 11
5 000000000000671000
6 0000000000000 0100
2003
1 0 24 17.54 5.17 0 0 0 0 0 0 19
2 100 76 82.46 94.8 100 88.71 67.74 0 0 0 237
3 0 0 0 0 0 11.29 32.26 88 60 0 27
4 00000001340 0
6 000000000 100
2004
1 100 100 100 100 98.15 65.5 0 0 0 0 0 0 0 245
2 0 0 0 0 1.85 34.5 83.33 50 3.03 21 12.5 0 0 33
3 0 0 0 0 0 0 16.67 50 96.97 79 75 50 0 65
4 000000000012.550 0
6 000000000000 100
2005
1 100 93.3 74.32 37.84 7.89 0 0 0 0 0 0 0 0 151
2 0 6.67 25.68 62.16 92.1 100 98.11 98.25 85 0 0 0 0 318
3 0 0 0 0 0 0 1.89 1.75 15 100 0 0 0 6
5 0000000000 10000
6 0000000000 0100100
Length Bin
3
5
3
9
3
1
2
3
1
7
32

Appendix 3
Table 10. Estimated von Bertalanffy parameters for the northern red drum stock,
standard and linear.
Standard Linear
L
max
47.1615
b
0
40.8008
k 0.1539
b
1
0.1541
t
0
-1.7434 k 0.3161
t
0
0.1095
Table 11. Catch-at-age matrices in numbers of fish with the recreational B2
length frequency assumptions included for the early period, 1986-1991.
Base0
123456+
1986 101,938 24,874 2,452 74 91 21,382
1987 116,635 28,332 3,578 2,174 149 2,264
1988 141,765 60,424 25,013 146 94 3,031
1989 126,086 44,436 7,492 66 53 3,648
1990 85,935 15,926 4,621 182 27 1,974
1991 80,141 20,584 1,211 824 28 394
Base1
123456+
1986 102,376 24,951 2,452 74 92 21,627
1987 118,127 28,617 3,584 2,233 153 2,267
1988 143,310 61,301 25,453 148 96 3,046
1989 127,161 44,977 7,601 66 54 3,673
1990 87,017 16,079 4,694 187 28 2,001
1991 91,236 23,176 1,369 973 31 407
Early (1986-1991)
33

Appendix 3
Table 12. Catch-at-age matrices in numbers of fish with the recreational B2
length frequency assumptions included for the mid period, 1992-1998.
Base0
123456+
1992 4,064 64,480 4,746 306 51 266
1993 4,837 76,259 31,366 47 20 419
1994 7,401 29,995 20,006 3,416 45 1,327
1995 11,718 114,051 11,038 1,135 520 294
1996 18,487 30,534 10,983 985 37 399
1997 18,516 8,043 4,116 371 77 75
1998 12,056 209,647 5,076 388 350 1,156
Base1
123456+
1992 4,594 70,976 5,301 306 53 271
1993 6,241 92,744 36,644 51 24 514
1994 8,960 34,862 23,977 4,373 60 1,787
1995 13,822 128,965 12,407 1,366 629 336
1996 19,853 31,921 11,774 1,071 40 435
1997 37,768 15,700 12,359 1,426 331 262
1998 12,436 237,416 6,125 471 430 1,405
Delta
123456+
1992 6,725 68,879 4,773 338 58 729
1993 14,459 88,284 31,452 143 42 1,836
1994 15,160 33,230 20,061 3,466 56 2,046
1995 25,789 117,440 11,118 1,194 547 1,436
1996 21,411 31,024 10,995 1,002 40 622
1997 49,485 10,933 4,469 536 112 2,308
1998 25,918 223,329 5,174 514 421 2,926
Prop
123456+
1992 6,150 69,445 4,915 329 57 605
1993 12,240 89,488 32,854 118 37 1,479
1994 13,486 33,671 21,118 3,711 57 1,976
1995 22,558 120,552 11,466 1,241 569 1,139
1996 20,990 31,266 11,206 1,021 40 572
1997 46,322 12,220 6,599 776 171 1,756
1998 22,278 227,132 5,431 502 423 2,515
Mid (1992-1998)
34

Appendix 3
Table 13. Catch-at-age matrices in numbers of fish with the recreational B2
length frequency assumptions included for the late period, 1999-2005.
Base0
123456+
1999 12,233 117,782 30,517 1,747 0 0
2000 3,776 74,179 62,195 1,372 0 0
2001 1,518 20,709 34,263 4,129 40 234
2002 24,625 88,979 3,104 1,943 797 0
2003 915 48,706 10,621 641 0 0
2004 9,214 17,783 18,675 323 0 0
2005 1,377 82,195 2,097 43 0 0
Base1
123456+
1999 15,990 150,989 40,858 2,667 0 0
2000 4,860 93,698 81,298 1,867 0 0
2001 2,288 28,486 49,120 7,375 76 439
2002 57,431 195,351 6,310 4,575 1,982 0
2003 1,092 58,337 12,909 806 0 0
2004 13,958 27,335 26,721 463 0 0
2005 1,576 116,967 3,025 43 0 0
Delta
123456+
1999 32,348 141,615 30,679 2,077 372 3,403
2000 21,236 93,304 62,383 1,647 310 2,837
2001 10,348 36,387 34,353 4,313 248 2,132
2002 97,967 148,884 3,596 2,943 1,926 10,319
2003 4,336 56,459 10,662 725 95 865
2004 28,832 18,654 18,751 477 174 1,587
2005 19,891 96,401 2,217 289 277 2,534
Prop
123456+
1999 25,805 145,365 34,751 2,313 223 2,042
2000 14,685 93,462 69,949 1,735 186 1,702
2001 7,124 33,226 40,260 5,538 179 1,455
2002 81,753 167,471 4,682 3,596 1,948 6,191
2003 3,038 57,210 11,561 757 57 519
2004 22,882 22,126 21,939 471 104 952
2005 12,565 104,627 2,540 191 166 1,520
Tagging
123456+
1999 31,221 136,541 33,049 2,637 1,138 5,919
2000 19,013 89,540 65,028 2,249 949 4,935
2001 10,424 31,317 36,734 5,104 675 3,534
2002 86,809 143,062 5,139 8,446 4,248 17,946
2003 4,592 54,673 11,103 981 289 1,505
2004 23,235 20,741 20,385 828 531 2,759
2005 17,753 94,683 2,907 1,016 847 4,407
Late (1999-2005)
Table 14. SVPA estimated selectivity vectors for the FADAPT modeling runs.
35

Appendix 3
Period/Configuration123456+
Early 0.781 1.000 1.000 0.184 0.074 0.074
Mid/Delta 0.173 1.000 0.701 0.080 0.015 0.015
Late/Prop 0.134 1.000 0.481 0.038 0.005 0.005
Late/Tagging 0.184 1.000 0.481 0.070 0.030 0.030
Table 15. FADAPT estimates of average F, escapement, and static SPR by
regulation period for TAGGING runs.
TAGGING without IGNS TAGGING with IGNS
Age-1 1.05 1.05
Age-2 1.39 1.39
Age-3 1.72 1.72
Age-4 0.41 0.41
Age-5 0.21 0.21
escapement 1.0 1.0
SPR 1.1 1.1
TAGGING without IGNS TAGGING with IGNS
Age-1 0.21 0.21
Age-2 0.75 0.75
Age-3 0.39 0.39
Age-4 0.03 0.03
Age-5 0.005 0.005
escapement 18.3 18.3
SPR 18.7 18.7
TAGGING without IGNS TAGGING with IGNS
Age-1 0.13 0.13
Age-2 0.49 0.50
Age-3 0.23 0.24
Age-4 0.03 0.03
Age-5 0.015 0.016
escapement 41.0 40.6
SPR 40.8 40.4
Early (1986-1991)
Mid (1992-1998)
Late (1999-2004)
36

Appendix 3
Table 16. Spreadsheet model estimates of average F, escapement, and static
SPR by regulation period for TAGGING runs.
TAGGING without IGNS TAGGING with IGNS
Age-1 0.97 0.97
Age-2 1.32 1.31
Age-3 1.32 1.31
Age-4 0.20 0.20
Age-5 0.07 0.07
escapement 2.2 2.3
SPR 2.3 2.4
TAGGING without IGNS TAGGING with IGNS
Age-1 0.13 0.13
Age-2 0.60 0.59
Age-3 0.42 0.41
Age-4 0.05 0.05
Age-5 0.014 0.014
escapement 30.1 30.3
SPR 30.3 30.4
TAGGING without IGNS TAGGING with IGNS
Age-1 0.13 0.13
Age-2 0.63 0.66
Age-3 0.30 0.32
Age-4 0.05 0.05
Age-5 0.032 0.032
escapement 32.8 32.8
SPR 32.3 32.3
Early (1986-1991)
Mid (1992-1998)
Late (1999-2004)
37

Appendix 3
0
50,000
100,000
150,000
200,000
250,000
300,000
350,000
400,000
1972
1974
1976
1978
1980
1982
1984
1986
1988
1990
1992
1994
1996
1998
2000
2002
2004
Year
Commercial Landings (lbs)
Figure 1. Annual commercial landings of red drum in North Carolina.
0
10
20
30
40
50
60
70
80
90
100
Anchored
Gill Net
Runaround
Gill Net
Pound Net Long Haul
Seine
Beach
Seine
Shrimp
Trawl
Fish Trawl Other
Gears
Gear
Percent of Total Catch
1987-1991
1992-1998
1999-2005
Figure 2. Percent landings of red drum by gear type for each harvest period.
38

Appendix 3
0
5
10
15
20
25
30
35
40
7 9 11 13 15 17 19 21 23 25 27 29 31 33 35 37 39 41 43 45 47 49 51 55
Total Length (in)
Percent Frequency
1987-1991
1992-1998
1999-2005
Figure 3. Length frequency of red drum sampled from the North Carolina
commercial harvest (all gears combined) for the periods 1987-1991 (n=462),
1992-1998 (n=1,216), and 1999-2005 (n=4,174).
0.00
1.00
2.00
3.00
4.00
5.00
6.00
1987
198
8
1
989
1990
1991
1
992
1993
1994
1995
199
6
1
997
1998
1999
2000
2001
2002
2003
200
4
2
005
Year
MRFSS CPUE (catch in numbers/effort in
trips)
0
0.05
0.1
0.15
0.2
0.25
0.3
0.35
MRFSS probability index (successful target
trips/total targeted trips)
CPUE
PROB
Figure 4. Target MRFSS catch per unit effort (CPUE) and MRFSS probability
(PROB) indices for the northern red drum stock, 1987-2005.
39

Appendix 3
0
2
4
6
8
10
12
14
16
18
1
9
9
1
1
9
9
2
19
9
3
1
9
9
4
19
9
5
19
9
6
1997
1998
1
9
9
9
20
0
0
20
0
1
2002
20
0
3
2004
2005
Year
JAI (mean number of juveniles/tow)
Figure 5. North Carolina JAI calculated from a state seine survey, 1992-2005.
The 1996 value is excluded because of environmental conditions.
igure 6. North Carolina IGNS age-1 and age-2 indices of abundance, 2001-
2005.
0.0
0.5
1.0
1.5
2.0
2.5
3.0
3.5
4.0
4.5
5.0
2001 2002 2003 2004 2005
Year
CPUE (number/sample)
Age-1
Age-2
F
40

Appendix 3
0.000
0.200
0.400
0.600
0.800
1.000
1.200
<299 300-
399
400-
499
500-
599
600-
699
700-
799
800-
899
900-
999
1000-
1099
1100-
1199
1200
+
Length (mm TL)
Selectivity
Figure 7. Recreational release length selectivity curve from tag analysis, from
Burdick et al. 2006.
-0.5
0
0.5
1
1.5
1998 1999 2000 2001 2002 2003 2004 2005
Year
Residual
Without IGNS
With IGNS
Figure 8. Residual plots of the MRFSS CPUE index for TAGGING FADAPT
model runs including the IGNS indices and excluding the indices for the late
period (1999-2005).
41

Appendix 3
-1
-0.5
0
0.5
1
1.5
1998 1999 2000 2001 2002 2003 2004 2005
Year
Residual
Without IGNS
With IGNS
Figure 9. Residual plots of the MRFSS probability index for TAGGING FADAPT
model runs including the IGNS indices and excluding the indices for the late
period (1999-2005).
-2
-1.5
-1
-0.5
0
0.5
1
1998 1999 2000 2001 2002 2003 2004 2005
Year
Residual
Without IGNS
With IGNS
Figure 10. Residual plots of the JAI for TAGGING FADAPT model runs including
the IGNS indices and excluding the indices for the late period (1999-2005).
42

Appendix 3
-1.5
-1
-0.5
0
0.5
1
1.5
2000 2001 2002 2003 2004 2005 2006
Year
Residual
Age-1
Age-2
Figure 11. Residual plots of the IGNS age-1 and age-2 indices for TAGGING
FADAPT model runs.
43

Appendix 3
0
300,000
600,000
900,000
1,200,000
1,500,000
1,800,000
1986 1988 1990 1992 1994 1996 1998 2000 2002 2004
Year
Abundance in number
s
Total Pop
PROB
estimate
CPUE
estimate
A
0
300,000
600,000
900,000
1,200,000
1,500,000
1,800,000
1986 1988 1990 1992 1994 1996 1998 2000 2002 2004
Year
Abundance in number
s
Total Pop
PROB
estimate
CPUE
estimate
B
Figure 12. Estimated fits of the MRFSS CPUE and PROB indices for TAGGING
spreadsheet model runs including the IGNS indices (A) and excluding the indices
(B).
44

Appendix 3
0
100,000
200,000
300,000
400,000
500,000
600,000
1985 1990 1995 2000 2005
Year
Abundance in number
s
Pred Age1
JAI
IGNS Age1
A
0
100,000
200,000
300,000
400,000
500,000
600,000
1985 1990 1995 2000 2005
Year
Abundance in number
s
Pred Age1
JAI
B
Figure 13. Estimated fits of the JAI and IGNS age-1 index for TAGGING
spreadsheet model including (A) and excluding the IGNS indices (B).
45

Appendix 3
0
100,000
200,000
300,000
400,000
500,000
1986
1988
1
990
1992
1994
199
6
1998
2000
2
002
2004
Year
Abundance in numbers
Age2
IGNS age2
Figure 14. Estimated fits of the IGNS age-2 index for TAGGING spreadsheet
model runs.
46

Appendix 3
0
0.5
1
1.5
2
2.5
3
3.5
1992 1993 1994 1995 1996 1997 1998 1999 2000 2001 2002 2003 2004 2005
Year
F at age-2
2005
2004
2003
2002
2001
2000
Figure 15. FADAPT retrospective analysis for the TAGGING configuration
without the IGNS indices, 1992-2005.
0
0.5
1
1.5
2
2.5
3
1992 1993 1994 1995 1996 1997 1998 1999 2000 2001 2002 2003 2004 2005
Year
F at age-2
2005
2004
2003
2002
2000
Figure 16. FADAPT retrospective analysis for the TAGGING configuration with
the IGNS indices, 1992-2005. The 2001 run could not be completed due to
model errors.
47

Appendix 3
Appendix 1. Alternative discard and selectivity assumption sensitivity runs
Introduction
The previous assessment (2000) investigated four different discard
assumptions. For this assessment, the same assumptions were examined and
were not considered as preferred runs. The Base0, Base1, Delta, and Prop
assumptions were all considered unlikely to represent the red drum fishery for
the most recent regulation period. Also, the 2000 assessment used a slightly
lower relative age-3 selectivity, 0.43 as well as the 0.7 selectivity vectors. These
values were not used in favor of the 0.48 age-3 selectivity vectors that were
estimated from tag returns.
This appendix contains the results and discussion of the assumptions that
were not considered preferred runs. These results should be considered
sensitivity runs to further understand model output in light of extreme model
configurations compared to the preferred runs.
The methods used were the same as those described in the methods
section of the assessment. These results were also conducted using the 0.48
selectivity assumption unless otherwise noted.
Results
FADAPT VPA
Base0 FADAPT runs had a fully recruited F ranging from 0.90 to 0.92
(Table A1). Full recruitment occurred at age-3, which differed from the results of
the preferred runs. Escapement values ranged from 3.2% to 3.4% and static
SPR values ranged from 3.2% to 3.3% (Table A1). Runs that included the IGNS
indices had lower F values and higher percent escapement and static SPR.
Base1 FADAPT runs had a fully recruited F ranging from 0.99 to 1.02
(Table A1). Full recruitment occurred at age-3, which was different from the
results of the preferred runs. Escapement values ranged from 2.5% to 2.8% and
static SPR values ranged from 2.3% to 2.5% (Table A1). Runs that included the
IGNS indices had lower F values and higher percent escapement and static
SPR.
Delta FADAPT runs had a fully recruited F ranging from 0.67 to 0.71
(Table A1). Full recruitment occurred at age-2. Escapement values ranged from
26.4% to 30.1% and static SPR values ranged from 26.6% to 30.3% (Table A1).
Runs that excluded the IGNS indices had lower F values and higher percent
escapement and static SPR.
48

Appendix 3
Prop FADAPT runs had a fully recruited F ranging from 0.69 to 0.70
(Table A1). Full recruitment occurred at age-2. Escapement values ranged from
27.6% to 28.4% and static SPR values ranged from 27.9% to 28.7% (Table A1).
Runs that excluded the IGNS indices had lower F values and higher percent
escapement and static SPR.
The 0.43 selectivity vector FADAPT runs had a fully recruited F of 0.44
(Table A2). Full recruitment occurred at age-2. Escapement values ranged from
45.4% to 45.6% and static SPR values ranged from 45.3% to 45.5% (Table A2).
The runs that included the IGNS indices had slightly higher estimates of F,
escapement, and SPR when compared to those without the indices. All of the
estimates of fully recruited F were lower and the escapement and SPR estimates
were higher than the comparable estimates with the higher 0.48 selectivity vector
(see Table 13).
Spreadsheet VPA
Base0 spreadsheet runs had a fully recruited F ranging from 0.55 to 0.65
(Table A3). Escapement values ranged from 35.8% to 42.0% and static SPR
values ranged from 36.2% to 42.3% (Table A3). Runs that excluded the IGNS
indices and used the 0.48 selectivity vector had lower F values and higher
percent escapement and static SPR.
Base1 spreadsheet runs had a fully recruited F ranging from 0.67 to 0.75
(Table A3). Escapement values ranged from 30.3% to 34.3% and static SPR
values ranged from 30.7% to 34.7% (Table A3). Runs that excluded the IGNS
indices and used the 0.48 selectivity vector had lower F values and higher
percent escapement and static SPR.
Delta spreadsheet runs had a fully recruited F ranging from 0.68 to 0.75
(Table A3). Escapement values ranged from 27.3% to 34.3% and static SPR
values ranged from 27.4% to 34.7% (Table A3). Runs that excluded the IGNS
indices and used the 0.48 selectivity vector had lower F values and higher
percent escapement and static SPR.
Prop spreadsheet runs had a fully recruited F ranging from 0.68 to 0.72
(Table A3). Escapement values ranged from 29.8% to 32.6% and static SPR
values ranged from 30.0% to 32.8% (Table A3). Runs that included the IGNS
indices and used the 0.48 selectivity vector had lower F values and higher
percent escapement and static SPR.
The 0.43 selectivity vector spreadsheet runs had a fully recruited F
ranging from 0.62 to 0.65 (Table A4). Full recruitment occurred at age-2.
Escapement values ranged from 33.2% to 34.7% and static SPR values ranged
from 32.8% to 34.2% (Table A4). The runs that included the IGNS indices had
lower estimates of escapement and SPR and higher estimates of F than those
49
Appendix 3
that did not include those indices. All of the estimates of fully recruited F were
lower and the escapement and SPR estimates were higher than the comparable
estimates with the higher 0.48 selectivity vector (see Table 14).
Discussion
The Base0, Base1, Delta, and Prop runs were not retained as preferred
runs because the red drum PDT determined that they were unlikely to be
reflections of the existing recreational fishery. Base0 assumed that there was no
discard mortality in the recreational fishery, which seemed to be extremely
unlikely. The Base1 discards are assumed to have a length frequency that is the
same as those fish that are caught and retained. Given the slot limit that has
been in place since 1992, it was believed to be unlikely that anglers would only
catch fish within the slot. The pre-slot limit period regularly caught fish both
above and below the limits. The Delta assumption had many more smaller and
younger fish than occurred in the Base1 length frequencies and did allow for
regulatory releases. However, Delta essentially assumed that all fish released
were regulatory releases due to fish captured outside the slot limit and with the
current bag limit set at one, it is likely that some releases are occurring within the
slot limit. The PROP catch matrix assumed a 10% discard mortality rate and
used a weighted average of the MRFSS length frequencies from the BASE1 and
DELTA catch matrices, with the weights 40% BASE1 and 60% DELTA. The
Tagging assumption does contain observed lengths of released fish. Generally,
the Base0 and Base1 catch-at-age has a very high peak at age-2 and few fish at
ages one, three, and four. Both catch-at-ages only rarely had fish ages 5 and 6+.
The Delta catch-at-age had fish at ages five and 6+ and higher proportions of fish
at ages one and four. The PROP run distribution falls between the Base1 and
Delta runs. The Tagging catch-at-age distribution falls between Base1 and Delta
up through age-3. At age-4 and greater, there are more fish than any of the
other assumptions.
Both models estimated more optimistic results with the 0.43 selectivity
vector. The spreadsheet model consistently estimated a level of SPR that meet
or exceed the SPR threshold of 30%. For the spreadsheet model, these
estimates may be related to the lower levels of F at ages greater than three,
which would allow for more fish to escape to reproduce (Table A4). The
FADAPT estimates of F were generally lower through all ages, which likely
resulted in the higher estimates of escapement and SPR.
The FADAPT model was much more sensitive to the B2 assumptions than
was the spreadsheet model. It appears that the extremely small numbers of fish
at the oldest ages had a significant impact on the assessment results. Zeros that
occur between non-zero values in a cohort cannot be handled in the model
calculations. In fact, where there were zeros in catch-at-ages, the zeros were
replaced with ones to prevent the model from failing to solve. The FADAPT
model interpretation of the low catch numbers assumes that the population
50
Appendix 3
numbers were low. The Delta and Prop runs were similar to each other, though
still estimating lower levels of escapement and SPR than the Tagging runs.
The spreadsheet model was much less sensitive to differences in the B2
discards. The highest escapement and static SPR percentages consistently
occurred for the Base0 assumption of no discards. Spreadsheet model runs only
showed slight improvements in escapement and SPR from the mid to late
periods, except for the Delta assumption. The full Delta and Prop runs including
the IGNS indices estimated higher levels of escapement and static SPR in the
mid period than in the late period. It is important to note that the previous
assessment indicated that escapement and SPR in that time period was much
higher than the estimates from the FADAPT model. The spreadsheet model
results were similar to those results from the preferred runs.
51

Appendix 3
Table A1. FADAPT estimates for the late regulatory period for the Base0, Base1,
Delta, and Prop discard assumptions using 0.48 selectivity vectors.
Base0 Base1 Delta Prop Base0 Base1 Delta Prop
Age-1 0.080.110.240.150.080.100.180.15
Age-2 0.921.020.710.700.900.990.670.69
Age-3 1.371.490.360.411.351.450.320.40
Age-4 1.061.060.030.031.061.050.030.03
Age-5 0.55 0.79 0.007 0.004 0.54 0.77 0.007 0.004
escapement 3.2 2.5 26.4 27.6 3.4 2.8 30.1 28.4
SPR 3.2 2.3 26.6 27.9 3.3 2.5 30.3 28.7
Without IGNS With IGNS
Late (1999-2004)
Table A2. FADAPT estimates for the late regulatory period for the TAGGING
discard assumptions using the 0.43 selectivity vectors.
TAGGING with IGNS TAGGING without IGNS
Age-1 0.12 0.12
Age-2 0.44 0.44
Age-3 0.20 0.20
Age-4 0.03 0.03
Age-5 0.012 0.012
escapement 45.6 45.4
SPR 45.5 45.3
Late (1999-2004)
52

Appendix 3
Table A3. Spreadsheet catch-age model estimates for the late regulatory period
for the Base0, Base1, and Delta discard assumptions using 0.48 selectivity
vectors.
Base0 Base1 Delta Prop Base0 Base1 Delta Prop
Age-1 1.001.010.970.971.001.010.970.98
Age-2 1.411.411.341.331.421.421.341.33
Age-3 1.411.411.341.331.421.421.341.33
Age-4 0.220.230.210.210.230.230.210.21
Age-5 0.08 0.08 0.07 0.074 0.08 0.08 0.08 0.074
escapement 1.7 1.7 2.1 2.2 1.7 1.7 2.1 2.1
SPR 1.8 1.8 2.2 2.2 1.8 1.8 2.2 2.2
Base0 Base1 Delta Prop Base0 Base1 Delta Prop
Age-1 0.060.110.130.120.060.110.130.12
Age-2 0.620.640.610.570.640.650.620.57
Age-3 0.430.450.430.400.450.450.430.40
Age-4 0.050.060.060.050.050.060.060.05
Age-5 0.014 0.017 0.015 0.014 0.014 0.017 0.015 0.014
escapement 31.3 28.5 29.3 32.0 30.2 27.9 29.2 31.9
SPR 31.5 28.7 29.5 32.1 30.4 28.1 29.3 31.9
Base0 Base1 Delta Prop Base0 Base1 Delta Prop
Age-1 0.040.050.150.110.040.050.160.11
Age-2 0.550.670.680.660.650.750.750.72
Age-3 0.260.320.330.320.310.360.360.35
Age-4 0.020.030.030.030.020.030.040.03
Age-5 0.0002 0.0002 0.012 0.007 0.0002 0.0002 0.012 0.007
escapement 42.0 34.3 30.3 32.6 35.8 30.3 27.3 29.8
SPR 42.3 34.7 30.4 32.8 36.2 30.7 27.4 30.0
Early (1986-1991)
Mid (1992-1998)
Late (1999-2004)
Without IGNS With IGNS
Without IGNS With IGNS
Without IGNS With IGNS
53

Appendix 3
Table A4. Spreadsheet catch-age model estimates for the late regulatory period
for the PROP and TAGGING discard assumptions using the 0.43 selectivity
vectors.
TAGGING with IGNS TAGGING without IGNS
Age-1 0.97 0.97
Age-2 1.30 1.31
Age-3 1.30 1.31
Age-4 0.20 0.20
Age-5 0.07 0.07
escapement 2.3 2.3
SPR 2.4 2.4
TAGGING with IGNS TAGGING without IGNS
Age-1 0.12 0.13
Age-2 0.56 0.57
Age-3 0.39 0.40
Age-4 0.05 0.05
Age-5 0.013 0.013
escapement 32.4 31.8
SPR 32.5 32.0
TAGGING with IGNS TAGGING without IGNS
Age-1 0.13 0.13
Age-2 0.65 0.62
Age-3 0.28 0.27
Age-4 0.05 0.05
Age-5 0.029 0.029
escapement 33.2 34.7
SPR 32.8 34.2
Early (1986-1991)
Mid (1992-1998)
Late (1999-2004)
54

Appendix 3
Appendix 2. Relevant Equations
von Bertalanffy (1938):
Standard:
(
)
(
)
(
)
0
*exp1 ttkLL
t
−
−
−
=
∞
Where L
t
is the length at time t and L
∝
, k, and t
0
are estimated parameters.
Linear:
tbbL *
0
+
=
∞
Burdick et al. (2006):
[
]
lggigililgi
SURNCE
,,,,,,
=
Where
[
]
lgi
CE
,,
is the expected tag return rate, is the number of fish tagged,
is rate of tag recovery for gear type g for fish tagged in experiment i , is
the exploitation rate of fish tagged in experiment and recaptured by gear type g,
and is the selectivity of gear type g in length (or age) bin l.
li
N
,
gi
R
, gi
U
,
i
lg
S
,
Bacheler et al. (in review):
[
]
ijkikijk
PNRE
=
()
()
()
⎪
⎪
⎩
⎪
⎪
⎨
⎧
=
++
−
>
++
−
⎟
⎟
⎠
⎞
⎜
⎜
⎝
⎛
=
−+
−+
−
=
∏
i)j (when
)'(
1
i)j (when
'
1
1
λ
λ
MSelFF
SelF
S
MSelFF
SelF
SS
P
kjj
kj
ijk
ijkjj
ijkj
ijk
j
iv
ivk
ijk
(
)
[
]
MSelFFS
ijkjjijk
−
+
−
=
−+
'exp
Where E[R
ijk
] is the expected number of tag returns from fish tagged at age k,
released in year i, and harvested in year j. N
ik
is the number of fish tagged at
age k and released in year i, P
ijk
is the probability a fish tagged at age k and
released in year i is harvested in year j, S
ijk
is the annual survival rate of fish
tagged at age k and released in year i then harvested in year j, F
j
is the
instantaneous fishing mortality in year j, F
j
’ is the instantaneous fishing mortality
55

Appendix 3
on tags taken from caught and released fish in year j, M is natural mortality, Sel
k
is the selectivity of age k, and
λ
is the tag-reporting rate of harvested fish.
[
]
''
ijkikijk
PNRE
=
()
()
()
⎪
⎪
⎩
⎪
⎪
⎨
⎧
=
++
−
>
++
−
⎟
⎟
⎠
⎞
⎜
⎜
⎝
⎛
=
−+
−+
−
=
∏
i)j (when '
)'(
'
1
i)j (when '
'
'
1
'
1
λ
λ
MSelFF
SelF
S
MSelFF
SelF
SS
P
kjj
kj
ijk
ijkjj
ijkj
ijk
j
iv
ivk
ijk
Where E[R
ijk
’] is the expected number of tag returns from fish tagged at age k,
released in year i, and caught and released in year j. P
ijk
is the probability a fish
tagged at age k and released in year i is caught and released in year j and
λ
’ is
the tag-reporting rate of caught and released fish.
Spreadsheet catch-at-age model:
yaya
FsF
ˆ
,
=
(
)
(
)
yayaya
FsMNN
ˆ
exp
,1,1
+−=
++
()()()
yaya
ya
ya
ya
FMN
FM
F
C
,,
,
,
,
exp1
ˆ
+−−
+
=
Where F
a,y
is the fishing mortality at age a in year y, s
a
is the selectivity at age a,
is the fitted fishing mortality in year y, N
y
F
ˆ
a+1,y+1
is the population abundance at
age a+1 and year y+1, N
a,y
is the population abundance at age a and year y, M is
natural mortality, and is the predicted catch at age a and year y.
ya
C
,
ˆ
FADAPT model:
(
)
()
ta
ta
ta
ta
ta
ta
Z
Z
F
Z
C
N
,
,
,
,
,
1,1
exp1
exp
*
−−
−
=
++
MFZ
tata
+
=
,,
()
ta
ta
ta
ta
ta
Z
C
F
Z
N
,
,
,
,
,
exp1
*
−−
=
56

Appendix 3
(
)
(
)
2
expexp
,1,1,
M
CMNN
tatata
+=
++
Where N
a+1,t+1
is the population abundance at age a+1 and time t+1, C
a,t
is the
catch at age a and time t, Z
a,t
is the total mortality at age a and time t, F
a,t
is the
fishing mortality at age a and time t, N
a,t
is the population abundance at age a
and time t, and M is natural mortality.
% SPR from Gabriel et al. (1989):
∑
=
aaaa
PWSNB
Where B is female biomass, N
a
is the cohort numbers at age a, S
a
is the
proportion of females, W
a
is the mean weight of females at age a, and P
a
is the
proportion of mature females at age a.
57
