
Kidne
y
Care
Better Kidney Care for All
Chronic Kidney
Disease in England:
The Human and
Financial Cost
Marion Kerr, Insight Health Economics

Contents
Acknowledgements.............................................................................................................03
Abbreviations .....................................................................................................................04
Executive Summary........................................................................................................05–07
Introduction ................................................................................................................08–09
Section I: Prevalence and Impact..........................................................................................10
Chapter 1 – Prevalence .......................................................................................10–12
Chapter 2 – Impact on Mortality and Quality of Life............................................13–15
Section II: NHS Expenditure Attributable to CKD ..................................................................16
Chapter 3 – Direct Costs...........................................................................................17
Primary care.............................................................................................17–21
Outpatient care .............................................................................................22
Inpatient care ................................................................................................23
Renal replacement therapy ......................................................................24–26
Chapter 4 – Indirect Costs ........................................................................................27
Excess length of hospital stay.........................................................................27
Stroke and myocardial infarction..............................................................28–30
Infection........................................................................................................31
Chapter 5 – Summary of Costs ..........................................................................32–33
Section III: Discussion ....................................................................................................34–35
Appendices
Appendix 1 – Conservative care ................................................................................36
Appendix 2 – Social care...........................................................................................37
Appendix 3 – Cost impact of ACEI/ARBs for hypertension and proteinuria ................38
References ................................................................................................................39–42

03
ACKNOWLEDGEMENTS
Acknowledgements
This paper was written for NHS Kidney Care by Insight Health Economics. We would like to thank the
following individuals and organisations for their help (though any errors are the responsibility of the author):
Maria Alva, Health Economics Research Centre, University of Oxford
John Bradley, Consultant Nephrologist, Cambridge University Hospitals NHS Foundation Trust
Benjamin Bray, NHS Kidney Care
Matthew Brealey, UK Renal Registry
Fergus Caskey, UK Renal Registry
Clare Castledine, UK Renal Registry
Alistair Chesser, Consultant Nephrologist, Barts and The London NHS Trust
Simon de Lusignan, Professor of Primary Care and Clinical Informatics, University of Surrey
Chris Farmer, Consultant Renal Physician, East Kent University Hospitals NHS Foundation Trust
Alastair Gray, Director, Health Economics Research Centre, University of Oxford
Claire Hudson, Renal Audit Manager, Royal Sussex County Hospital
Rosemary Matheson, Prescribing and Primary Care, The NHS Information Centre for health and social care
Beverley Matthews, Director, NHS Kidney Care
James Medcalf, Consultant Nephrologist, University Hospitals of Leicester NHS Trust
Donal O’Donoghue, National Clinical Director for Kidney Care, Department of Health
Paul Roderick, Professor of Public Health, University of Southampton
Paul Stevens, Consultant Nephrologist, East Kent University Hospitals NHS Foundation Trust
Charlie Tomson, President, Renal Association
© 2012 Insight Health Economics Ltd. All rights reserved.

04
ACEI: angiotensin-converting enzyme inhibitor
ACR: albumin:creatinine ratio
ARB: angiotensin II receptor blocker
CI: confidence interval
CKD: chronic kidney disease
eGFR: estimated glomerular filtration rate
EPO: erythropoietin
ESA: erythropoiesis-stimulating agent
ESRD: end-stage renal disease
GFR: glomerular filtration rate
HES: Hospital Episode Statistics
HR: hazard ratio
HRG: Healthcare Resource Group
HSE: Health Survey for England
KDOQI: US National Kidney Foundation Kidney Disease Outcomes Quality Initiative
MDRD: Modification of Diet in Renal Disease
MI: myocardial infarction
MRSA: meticillin-resistant Staphylococcus aureus
NEOERICA: New Opportunities for Early Renal Intervention by Computerised Assessment
NHANES: National Health and Nutrition Examination Surveys
ONS: Office for National Statistics
PCR: protein:creatinine ratio
PCT: primary care trust
QICKD: Quality Improvement in CKD
QOF: Quality and Outcomes Framework
RRT: renal replacement therapy
Abbreviations

05
Executive Summary
EXECUTIVE SUMMARY
1. More than 1.8 million people in England have diagnosed chronic kidney disease (CKD). In
addition, there are thought to be around a million people who have the condition but are
undiagnosed. CKD can substantially reduce quality of life, and leads to premature death for
thousands of people each year.
2. People with CKD have a gradual loss of kidney function over time. The kidneys become less
effective at filtering waste products from blood; water, waste and toxic substances therefore
accumulate in the body. A minority of people with CKD suffer complete kidney failure, and require
renal replacement therapy (RRT): dialysis or transplant. People with CKD are also at increased risk of
stroke, heart attack, bone disease and other conditions.
3. CKD is classified in five stages, according to the level of kidney damage and function. The focus
in this paper is on stages 3–5, which cover moderate to severe kidney disease. People with CKD are
at greater risk of death than people of the same age and sex with healthy kidneys. The risk increases
as the disease progresses, and is far greater than the risk of progression to RRT. It is estimated that
there are 40,000–45,000 premature deaths each year in people with CKD. A large proportion of
deaths in people with CKD are due to cardiovascular events such as strokes and heart attacks.
4. CKD is associated with reductions in health-related quality of life. A number of studies have
reported that people receiving RRT experience significantly reduced quality of life, relative to those
with normal kidney function. Less severe kidney disease also reduces quality of life.
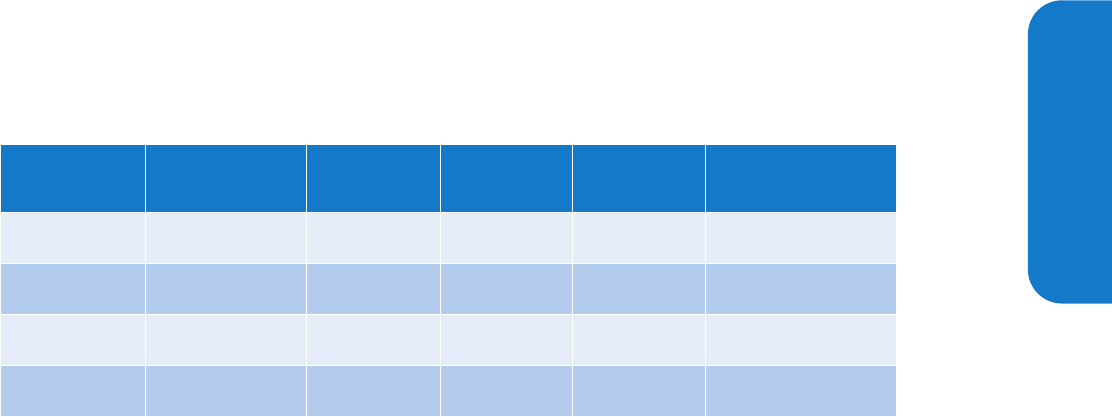
5. The NHS in England spent an estimated £1.45 billion on CKD in 2009–10, equivalent to £1 in
every £77 of NHS expenditure. This spending estimate covers both treatment directly associated
with CKD (renal care and prescribing to prevent disease progression), and also treatment for
excess non-renal problems such as strokes, heart attacks and infections in people with CKD. In the
case of non-renal problems, costs are estimated only for excess events, over and above the
expected number for people of the same age and sex who do not have CKD. The distribution of
NHS spending on CKD is shown in Figure 1.
6. There were an estimated 7,000 extra strokes and 12,000 extra myocardial infarctions (MIs) in
people with CKD in 2009–2010, relative to the expected number in people of the same age and
sex without CKD. The cost to the NHS of health care related to these strokes and MIs is estimated
at £174–178 million.
7. People with CKD have longer hospital stays than people of the same age without the condition,
even when they go into hospital for treatments unrelated to CKD. We estimate that the average
length of stay is 35% longer for people with CKD, and that the cost to the NHS of excess hospital
bed days for patients with CKD was £46 million in 2009–10.

06
8. Infections such as meticillin (methicillin)-resistant Staphylococcus aureus (MRSA) are more common in
people with CKD, in particular in those receiving haemodialysis. The risk of MRSA is more than 100 times
greater in people receiving haemodialysis than in the general population. The cost to the NHS of MRSA in
haemodialysis patients is estimated at £1.4 million.
9. The costs in this paper cover only health care provision. In addition, there is likely to be considerable
expenditure on social care services. It was not possible to produce robust estimates of most social care
costs associated with CKD. In the case of excess strokes in CKD, social care costs have been estimated
(see Appendix 2). The estimated cost of social care in stroke is more than 1.5 times the health care cost.
10. In addition to health and social care costs, CKD can place a financial burden on individuals with
the disease and on their carers through lost working days and morbidity. These work and morbidity effects
also entail costs to the public purse through reductions in tax revenue and increases in benefit payments.
If all these impacts were taken into account the total cost of CKD, both to society and to the public sector,
would be higher than the costs set out in this paper.
11. The estimate of total expenditure is more than twice the sum that would be produced by
extrapolating from the figures in the 2002 Wanless report, Securing our Future Health: Taking a
Long-term View. In that report, spending on kidney care in 2002–03 was estimated at £445 million
(£580 million in 2009–10 prices). The number of people receiving RRT increased by 29% between 2002
and 2008. The total prevalence of CKD (diagnosed and undiagnosed) is also believed to be increasing.
12. Programme Budgeting analysis by the Department of Health estimated total NHS expenditure on
renal problems at £1.64 billion in 2009–10. However, the Programme Budgeting renal category is broader
than CKD. The Programme Budgeting estimates therefore include expenditure on other renal conditions
such as acute kidney injury. Programme Budgeting data on renal problems do not include indirect costs
(which contribute £211–£225 million to the total estimated in this paper). The total direct costs estimated
here are £1.23 billion.
13. In the Programme Budgeting data, 5% of PCT expenditure on renal problems was attributed to
primary care and 95% to secondary care. The proportion of direct costs attributed to primary care in
this paper is considerably higher (12% without prescribing costs, 26% if prescribing costs are included).
There are a number of reasons for this: as indicated above, the renal category considered in this paper is
narrower than that used for Programme Budgeting; some of the prescribing costs included here (such as
those for anti-hypertensive therapies in CKD) are likely to be attributed to non-renal categories in
Programme Budgeting; and a more detailed examination of primary care resource use for CKD has been
undertaken here than is generally possible in the context of Programme Budgeting.
Executive Summary

07
Executive Summary
EXECUTIVE SUMMARY
Figure 1. Direct and indirect NHS expenditure on CKD, England 2009–10
Renal Replacement Therapy
Renal Primary Care
Dialysis
£505m
Transplantation
£225m
Anti-hypertensive
prescribing
£152m
Primary care
tests and
consultations
£143m
Excess Non-Renal Care
in CKD
Renal Secondary
Care
BMD
and
anaemia
£27m
Dialysis
Transport
£50m
Excess
stroke
£82m
Renal
admissions
£75m
Nephrology
Consultations
(Non-RRT) £53m
Excess MRSA
£1m
BMD: bone mineral density
Excess
MI
£95m
Excess length
of stay
£46m

08
14. The purpose of this paper is to examine the impact of chronic kidney disease (CKD) and associated
complications and comorbidities on quality of life, mortality and NHS costs in England.
15. The paper is divided into three sections: section I examines the prevalence of CKD and its impact on
quality of life and mortality; section II examines expenditure on CKD; and section III discusses the
implications of the study findings.
16. Costs are categorised here as direct and indirect. Direct costs are defined as those associated with
the disease itself and its progression, including end-stage renal disease (ESRD). Indirect costs are defined
as those incurred for non-renal care in cases where people with CKD have excess risk or consume excess
health care resources relative to the non-CKD population. These indirect costs include those arising from
excess adverse events (such as stroke) in people with CKD, from excess bed days in general hospital
admissions and from excess infections.
17. CKD is classified in five stages, according to the level of kidney damage and the ability of the kidneys
to filter blood. The glomerular filtration rate (GFR) measures the amount of blood that passes through the
tiny filters in the kidneys, called glomeruli, each minute. As the disease progresses, the GFR falls.
18. The National Service Framework for Renal Services defines normal renal function as estimated GFR
(eGFR) at or above 90 ml/min/1.73 m
2
with no evidence of kidney damage, and classifies CKD in five
stages using the US National Kidney Foundation Kidney Disease Outcomes Quality Initiative (KDOQI)
system. The National Institute for Health and Clinical Excellence (NICE) recommends sub-division of stage
3, as shown in Table 1. The focus in this paper is on stages 3–5 CKD, defined as GFR <60 ml/min/1.73 m
2
for at least 3 months.
Table 1. Definition and stages of CKD
1
Introduction
CKD stage
a
GFR (ml/min/1.73 m
2
) Description
1 ≥90
Normal or increased GFR, but with other evidence of kidney
damage
2 60–89 Slight decrease in GFR, with other evidence of kidney damage
3A 45–59
Moderate decrease in GFR, with or without other evidence
of kidney damage
3B 30–44
4 15–29
Severe decrease in GFR, with or without other evidence of kidney
damage
5 <15 Established renal failure
a
Use the suffix (p) to denote the presence of proteinuria when
staging CKD

09
Introduction
INTRODUCTION
19. Stage 5 CKD is also known as ESRD. Most patients at this disease stage require renal replacement
therapy (RRT): dialysis or transplant.
20. While the focus in this paper is on NHS spending, it is important to recognise that there are, in
addition, substantial costs to individuals with CKD and to their carers through lost working days and
morbidity. These work and morbidity effects also entail costs to the public purse through reductions in
tax revenue and increases in benefit payments. If all these effects were taken into account the total cost
of CKD, both to society and to the public sector, would be higher than the costs set out in this paper.

10
Chapter 1 – Prevalence
21. The Quality and Outcomes Framework (QOF) register indicates that, in 2009–10, 1,817,871 adults in
England had stages 3–5 CKD, a diagnosed prevalence rate of 4.3% of the population over the age of
18.
2
It is considered likely, however, that the total prevalence is higher, as there are thought to be a
substantial number of undiagnosed cases.
22. Study evidence produces a range of estimates of total CKD prevalence. These are sensitive to the
method used to detect prevalence and to the population on which the estimate is based. While CKD
classifications are based on GFR levels over a 3-month period, most studies use only one measurement,
thus tending to overestimate prevalence. Most recent studies estimate GFR from serum creatinine levels,
adjusted for age, sex and ethnicity using a formula known as Modification of Diet in Renal Disease
(MDRD). It is known, however, that this formula underestimates GFR in patients with normal renal
function, thus also tending to overestimate prevalence.
23. The Health Survey for England (HSE) 2010 report estimated that 6% of men and 7% of women
(aged ≥16 years) had stage 3–5 CKD, based on eGFR levels.
3
This was a nationally representative,
population-based study on the prevalence of CKD in England using laboratory measures calibrated to
allow use of MDRD to estimate GFR. The HSE 2010 report combines data from HSE 2009 and HSE 2010.
By applying the HSE prevalence estimate to the 2009 population of England, as recorded by the Office for
National Statistics (ONS), it is estimated that 2.71 million people have stage 3–5 CKD. If these estimates
are accurate, they would suggest that only around two-thirds of people with CKD are included on QOF
registers.
24. The New Opportunities for Early Renal Intervention by Computerised Assessment (NEOERICA) project
estimated the age-standardised prevalence of stage 3–5 CKD in the UK adult population at 8.5% (10.6%
for females and 5.8% for males).
4
It found, however, that only 1.6% of patients had a recorded renal
diagnosis. The NEOERICA prevalence estimates were derived from an examination of primary care records
covering 130,226 adults in Kent, Manchester and Surrey over a 5-year period ending in 2003. The eGFR
was calculated from the MDRD equation using calibrated creatinine levels.
25. The NEOERICA age-standardised rates for the overall population were calculated with reference to
the UK 2001 census population. Application of the NEOERICA prevalence findings, by age and sex, to the
2009 ONS population estimates for England suggests that approximately 3.6 million people are likely to
have CKD stages 3–5. In the NEOERICA study, 95.5% of those with eGFR <60 ml/min/1.73 m
2
were at
stage 3 CKD. The study did not produce separate prevalence estimates for stages 4 and 5. Unlike the
HSE, the NEOERICA sample is not nationally representative with respect to socioeconomic and ethnic
factors.
Section I:
Prevalence and Impact
11
Section I:
Prevalence and Impact
PREVALENCE
AND IMPACT
26. The Quality Improvement in CKD (QICKD) study recently estimated the prevalence of stage 3–5
CKD in 129 general practices in England, covering 930,997 patients with an age and sex distribution
similar to the national average.
5
The prevalence was estimated at 5.41% of the entire (as opposed to
adult-only) population (7.34% in females and 3.48% in males). In this study, the criterion for stage
3–5 CKD diagnosis was two consecutive laboratory-reported measurements, at least 3 months apart,
of eGFR <60 ml/min/1.73m
2
. The study argued that estimates based on a single eGFR reading tend
to inflate CKD prevalence as they ignore the impact of creatinine fluctuation within individuals. Using
these prevalence estimates it can be estimated that 2.81 million people have stage 3–5 CKD. Of the
CKD population in this study, 97% were at stage 3 of the disease.
27. Estimates of the number of people with stage 3–5 CKD drawn from QOF, HSE, QICKD and
NEOERICA are summarised in Table 2.
Table 2. Estimated prevalence and population numbers, CKD stages 3–5, based on QOF,
HSE 2010, QICKD and NEOERICA
2-5
28. The estimates of total prevalence derived from the HSE, QICKD and NEOERICA studies indicate
that there may be 900,000 to 1.8 million people in England who have undiagnosed stage 3–5 CKD.
29. The QICKD, NEOERICA and HSE estimates may be compared with estimates from international
studies, though care must be taken when comparing results across studies because of differences in
methodology. Age-standardised rates for CKD stages 3–5 from a population-based study in Iceland
were estimated at 11.55% for women and 4.71% for men.
6
Prevalence estimates from other studies
range from 5.84% in the Netherlands,
7
and 8% in Northern Ireland (published in abstract only),
8
to
11.2% in Australia.
9
Estimates for the US, based on the National Health and Nutrition Examination
Surveys (NHANES), show 8.04% prevalence for stages 3 and 4 only.
10
The NHANES excluded people
living in care homes, and the prevalence of CKD in the care home population may be higher than in
the general population. If so, the NHANES prevalence is likely to be an underestimate.
Source Denominator Male Female All
Estimated CKD
stage 3–5
QOF 18+ 4.3% 1,817,871
HSE 16+ 6% 7% 2,710,575
QICKD
Whole
population
3.5% 7.3% 5.4% 2,817,104
NEOERICA 18+ 5.8% 10.6% 8.5% 3,640,321

12
30. We do not have accurate time-series data on the prevalence of CKD in England, but it is likely that
prevalence is rising. The population is ageing and a number of CKD risk factors – obesity, type 2 diabetes
and hypertension – are increasing in prevalence. Comparison of data from consecutive US NHANES
studies shows an increase in population prevalence of stages 3–4 CKD from 5.63% in 1988–94 to 8.04%
in 1999–2004
10
.
31. The diagnosed prevalence of CKD in England, as measured by QOF, has grown from 2.4% in
2006–07 to 4.3% in 2009–10. A substantial part of this observed growth, however, is likely to reflect
increased detection rather than increased burden of disease.
32. When estimating the economic burden of CKD, reference is made both to diagnosed prevalence and
to estimated total prevalence. In some contexts, diagnosed prevalence is the more appropriate
denominator, while in others it is necessary to take account of the estimated total prevalence. For
example, regular serum creatinine tests are likely to be provided for the majority of the diagnosed
population, but are less likely to be provided for the undiagnosed group. When estimating expenditure
on such tests, the QOF prevalence figure is likely to be the more appropriate denominator. The excess risk
of adverse events such as stroke, however, is applicable to the entire CKD population. Indeed, the risk
may be higher in an undiagnosed group than in a matched diagnosed group that is receiving preventive
care. Therefore, estimated total prevalence is likely to be the more appropriate denominator when
estimating expenditure on such excess adverse events.
Section I:
Prevalence and Impact

13
PREVALENCE
AND IMPACT
Chapter 2 – Impact on Mortality and Quality of Life
33. People with CKD have a substantially increased mortality risk relative to the age-adjusted
non-CKD population. The risk of death is far greater than the risk of progression to ESRD. A large
proportion of deaths in the CKD population are due to cardiovascular events. The risk of
cardiovascular events rises substantially as GFR falls.
34. A recent meta-analysis by the CKD Prognosis Consortium found that eGFR and albuminuria
were associated with all-cause mortality and cardiovascular mortality independently of each other
and of traditional cardiovascular risk factors (age, ethnic origin, sex, history of cardiovascular disease,
systolic blood pressure, diabetes, smoking, and total cholesterol concentration).
11
The analysis
included more than 100,000 individuals with albumin:creatinine ratio (ACR) measurements and 1.1
million people with dipstick measurements from 14 countries in Europe, North America, Asia and
Oceania. Unlike some previous studies, this analysis suggested that mild to moderate reduction in
eGFR was associated with adverse clinical outcomes.
35. A retrospective cohort study of all new cases of CKD from Southampton and South-West
Hampshire Health Authority found that 69% of 1,076 individuals identified had died at the end of a
mean follow-up period of 5.5 years.
12
(CKD was determined by a persistently increased serum
creatinine level ≥1.7 mg/dl [≥150 μmol/l] for 6 months, identified from chemical pathology records.)
The cause of death was cardiovascular in 46% of cases. Standardised mortality ratios were 36-fold in
those aged 16–49 years, 12-fold in those aged 50–64 years, and more than twofold in those older
than 65. Only 4% of the cohort had progressed to RRT by the end of follow-up.
36. A prospective cohort study of 3,240 individuals with a median GFR of 28.5 ml/min/1.73m
2
not
known to renal services found that 39.5% died within a median follow-up period of 31.3 months.
13
The cause of death was cardiovascular in 39.7% of cases. Only 8.3% of the cohort experienced an
annual decline in GFR >5 ml/min/1.73m
2
during the follow-up period.
37. A longitudinal US study of 1,120,295 adults found that a reduced GFR was associated with
increased risks of death, cardiovascular events and hospital admission that were independent of
known risk factors, a history of cardiovascular disease and the presence of documented proteinuria.
14
The adjusted HRs for adverse events increased sharply with an eGFR <45 ml/min/1.73 m
2
.
38. ONS data indicate that, in 2008, chronic renal failure (another term for CKD) or hypertensive
renal disease was shown as the underlying cause of death on 2,232 death certificates in England.
15
In addition, chronic renal failure was mentioned as a factor contributing to death on 13,895 death
certificates. (Hypertensive renal disease was mentioned on 3,401 certificates, but multiple conditions
are often cited as contributory factors so it is possible that some of these certificates also mentioned
chronic renal failure.)
Section I:
Prevalence and Impact

14
39. It is possible, however, that official data substantially underestimate the contribution of CKD to
premature mortality. In view of the prevalence of comorbidities in people with CKD, and the high risk of
cardiovascular events in this population, it is likely that CKD is under-recorded on death certificates.
40. ONS mortality data for England in 2009 were used to estimate the number of deaths in a general
population group of the same age and sex distribution as the CKD population (aged 16+), using HSE and
QICKD estimates of CKD prevalence.
3,5,16
It was assumed that the proportion of the CKD population at
each stage of the disease was as described in the QICKD population. Applying the HRs for death from
any cause from a recent US study
14
to these populations, it is estimated that there were 40,000–45,000
more deaths in people with CKD in 2009, relative to the expected number for a population sample of the
same size, age and sex without CKD, as shown in Table 3.
Table 3. Estimated deaths in the CKD population, and in a matched population without
CKD, 2009
41. CKD is also associated with reductions in health-related quality of life. A number of studies have
reported that people with ESRD experience significantly reduced quality of life relative to those with
normal kidney function. Quality of life in CKD varies depending on disease stage, treatment modality and
the presence of complications and comorbidities such as anaemia, diabetes and cardiovascular disease.
42. Many different questionnaires and interview techniques are used for the assessment of quality of life,
and utility scores for individual health states can vary widely depending on the technique adopted. If
cost-utility analyses are used to inform health care resource allocation decisions, it is important that there
is comparability across the studies used. For this reason, NICE has specified that EQ-5D is the preferred
measure for cost-effectiveness analysis in the NHS in England.
17
EQ-5D scores are derived from patient
questionnaires covering five domains: mobility, pain/discomfort, anxiety/depression, ability to care for
oneself, and ability to perform usual tasks. An index score between 0 and 1 is derived, with 1
representing perfect health, by attaching weights to each level in each domain. These weights are derived
from valuations of health states in general
population surveys.
Source
Estimated CKD
population
Expected deaths,
non-CKD
Estimated
deaths, CKD
population
Estimated
premature
deaths, CKD
HSE 2,710,575 109,576 149,191 39,615
QICKD 2,816,710 125,060 170,273 45,213
Section I:
Prevalence and Impact

15
43. A recent (2006) review of published utilities for health states associated with CKD identified two
studies that were considered suitable for use in UK economic evaluation (as they used EQ-5D and a
weighting system derived from UK population preferences).
18
Both of these studies focused on
quality of life in patients with ESRD. Utility scores ranged from 0.62 to 0.81 for patients undergoing
haemodialysis and from 0.55 to 0.81 for patients receiving peritoneal dialysis. Neither of these
studies was based on delivery of care in the English NHS. The range in utility scores for both
haemodialysis and peritoneal dialysis suggests that quality of life may be very sensitive to local
conditions, including models of delivery of care. Care must therefore be taken in interpreting these
results.
44. Quality of life scores for transplant patients are generally higher than scores for those receiving
dialysis. The 2006 review of published utilities for health states in CKD identified two studies that
used EQ-5D and population-based preference weights to measure quality of life in transplant
patients.
18
A German study showed quality of life scores of 0.73 at 14 days after kidney
transplantation, 0.78 at 1 month after transplantation and 0.88 at 2–20 years after transplantation.
19
This compared with 0.76 in the same study for patients with ESRD on dialysis. A Swedish study
reported a score of 0.86 for kidney transplant recipients, compared with scores of 0.42 to 0.65 for
patients receiving dialysis.
20
The review authors considered that these studies were not appropriate
for UK economic evaluation as it was not clear whether the scoring mechanism was based on UK
population preferences.
45. Quality of life in stages 3 and 4 CKD is less commonly studied. No studies using EQ-5D and UK
population preferences have been identified. A recent Japanese study, however, estimated EQ-5D
scores for stage 3–5 CKD patients using Japanese population weights. Measured quality of life scores
were 0.88 for stage 3, 0.84 for stage 4, and 0.80 for stage 5.
21
PREVALENCE
AND IMPACT
Section I:
Prevalence and Impact

16
46. There is considerable uncertainty as to the cost to the NHS of CKD. The 2002 Wanless report
estimated spending on kidney care in 2002–03 at £445 million.
22
This is equivalent to £580 million in
2009–10 prices (adjusting for Hospital and Community Health Services (HCHS) pay and prices inflation).
However, in the years since the Wanless report was produced there have been changes in CKD
prevalence, detection and treatment, and in the real cost of care. Robust estimates of current costs
cannot therefore be produced simply by updating the Wanless figures in line with health
service inflation.
47. Programme Budgeting data from the Department of Health estimated total NHS expenditure on
renal problems at £1.64 billion in 2009–10.
23
Approximately 5% of PCT expenditure on renal problems
was attributed to primary care and 95% to secondary care. Prescribing costs relating to kidney problems
were estimated at £43.5 million in 2009–10.
24
There is uncertainty, however, regarding prescribing costs
as a number of medications can be prescribed for more than one condition and attribution is difficult. It
should also be noted that the Programme Budgeting renal category is broader than CKD. The Programme
Budgeting estimates are therefore likely to include expenditure on other renal conditions such as acute
kidney injury.
48. The costing approach in this paper is based on routine data sets where possible, supplemented by
modelling based on earlier costing exercises (for NHS Kidney Care, NICE and other bodies), data supplied
directly by NHS organisations, academic literature and expert opinion.
49. In order to estimate NHS expenditure arising from CKD, both direct and indirect costs are examined.
Direct costs are defined here as those arising from health events and health care needs directly associated
with CKD and its progression. In the main, these are the costs of renal care. Indirect costs are defined as
those arising from excess bed days in general hospital admissions and from non-renal conditions for
which CKD carries increased risk. Costs are counted for excess cardiovascular events and infections
occurring in the CKD population, relative to a comparable population without CKD. The nature of the
relationship between CKD and cardiovascular disease is not fully understood. Estimations of expenditure
on excess adverse events in the CKD population should not be taken as implying that these excess events
are caused by CKD. (It is possible, for example, that a third factor increases the risks of both CKD and
cardiovascular events.)
50. The focus in this paper is on health care costs. However, it is likely that CKD also entails additional
costs for social care. In most areas of care it has not been possible to estimate expenditure on social care.
In the case of excess strokes in CKD, social care costs have been estimated. These are shown in
Appendix 2.
51. All costs are expressed in 2009–10 prices. Costs for activity that would take place in the absence of
CKD are not included.
Section II
NHS Expenditure Attributable to CKD

17
Chapter 3 – Direct Costs
52. This chapter focuses on the direct costs of CKD. These may be classified as arising from:
primary care•
outpatient attendances•
inpatient care•
RRT (dialysis and transplant)•
53. There is obviously some overlap between these areas. For example, dialysis patients incur some
admitted patient costs for dialysis-related complications. Decisions about the classification of costs
have been taken in a pragmatic way, according to data availability. Care has been taken not to
double-count costs, so these classification issues do not have an impact on the overall expenditure
estimates. If the focus is on cost by category, however, it will be important to recognise that the costs
shown here for RRT do not represent the entire cost of care for patients receiving RRT.
54. It was not possible to produce robust estimates of the cost of conservative care, owing to
uncertainties regarding patient numbers and unit costs. Illustrative figures are provided in Appendix 1.
Primary care
55. The QOF sets out management indicators for CKD, and NICE clinical guidelines 73 and 114
provide recommendations for treatment and care.
1,25
This section will estimate costs for routine tests
recorded in the QOF, and for prescribing in primary care arising from the NICE guidelines.
56. The QOF contains four CKD management indicators. Underlying achievement and exception
rates for these indicators in 2009–10 are set out in Table 4.
Table 4. QOF CKD indicators, achievement and exception rates, 2009–10 (The NHS
Information Centre)
EXPENDITURE ON CKD
Section II:
NHS Expenditure Attributable to CKD
CKD management indicators
Underlying
achievement
Exception
rates
CKD 2
The percentage of patients on the CKD register whose
notes have a record of blood pressure in the previous 15
months
97.6% 0.57%
CKD 3
The percentage of patients on the CKD register in whom
the last blood pressure reading, measured in the previous
15 months, is 140/85 or less
73.9% 7.47%
CKD 5
The percentage of patients on the CKD register with
hypertension and proteinuria who are treated with an
angiotensin converting enzyme inhibitor (ACEI) or
angiotensin receptor blocker (ARB) (unless a
contraindication or side effects are recorded)
91.8% 9.28%
CKD 6
The percentage of patients on the CKD register whose
notes have a record of a urine albumin: creatinine ratio (or
protein:creatinine ratio) test in the previous 15 months
77.7% 4.51%

18
57. Annual costs have been estimated for the tests covered by the QOF CKD indicators for the 2009–10
diagnosed QOF population. It is assumed that patients with prevalent CKD who are recorded as having
blood pressure tests have these tests once every 15 months at a single 20-minute consultation with a GP
practice nurse. It is assumed that urine samples for ACR or protein:creatinine ratio (PCR) tests are taken at
the same consultation. Therefore, no additional costs are estimated for urine tests. It is likely that many
patients are tested more frequently than 15-monthly. These costs may therefore be underestimated.
58. It is also assumed that diagnosed CKD patients have two GP consultations a year in addition to those
they would have in the absence of CKD.
26
59. For newly diagnosed cases, it is assumed that there are two additional GP visits and that two
additional ACR or PCR tests are performed in the year of diagnosis. In 2009–10 the QOF register of CKD
prevalence showed an increase of 78,428 over the 2008–09 prevalence. Adjustments for mortality, based
on mortality rates from a 2004 US study,
14
suggest that approximately 119,000 new cases were
diagnosed in 2009–10.
60. Laboratory costs for ACR and PCR tests are taken from NICE,
1
and have been updated to 2009–10
prices. Unit costs for staff inputs are taken from the Personal Social Services Research Unit.
27
Costs are
calculated for the percentage of patients who received the tests in 2009–10, as indicated by the QOF
underlying achievement rates, adjusted for the exception rates. The underlying achievement rate for
blood pressure testing in 2009–10 was 97.6%, with an exception rate of 0.57%. For ACR or PCR tests,
the underlying achievement rate was 77.7% and the exception rate was 4.5%. Total expenditure on
primary care tests and consultations for CKD is estimated at £143 million, as shown in Table 5.
Expenditure would be higher if all patients with CKD received these tests and consultations.
Table 5. Expenditure on primary care tests and consultations for CKD, as specified in QOF, 2009-2010
Intervention
Number of
patients
Unit cost Frequency Annual cost
GP consultation 1,817,871 £32.00 6 months £116,343,744
Additional GP
consultations for
newly diagnosed
cases
119,359 £32.00 Two in first year £7,639,004
Consultation with
practice nurse
1,760,581 £10.00 15 months £14,084,647
ACR or PCR
laboratory test
1,347,584 £3.46 15 months £3,730,112
Additional tests for
newly diagnosed
cases
119,000 £3.46 Two in first year £823,480
£142,620,986
Section II:
NHS Expenditure Attributable to CKD

19
61. Estimates of the cost of anti-hypertensive medications for people with CKD have been derived
from a longitudinal population cohort study undertaken at East Kent University Hospitals NHS
Foundation Trust.
28
This study found that 82.6% of 7,170 patients with CKD stages 3–5 were
hypertensive in 2004–06, before the introduction of QOF points for CKD care; 91.2% of this group
were hypertensive in 2006–08 and 89.4% of patients were hypertensive in 2008–10. Patients were
considered hypertensive if they had a recorded mean blood pressure ≥140/85 mmHg or were
prescribed anti-hypertensive medication.
62. The average annual cost of anti-hypertensive medications per hypertensive patient was
estimated at £132 in 2008–10.
63. If the national prevalence of hypertension in CKD is similar to East Kent levels, it is estimated
that 1.7 million people with CKD have hypertension (based on the diagnosed CKD population, as
recorded through QOF). If anti-hypertensive medications are prescribed in the same quantities and
proportions as for the East Kent cohort, the total annual cost for England is estimated at £215
million. (The East Kent CKD population is known to differ from the England population in certain
respects. The average age is older in East Kent and the population is less ethnically diverse. However,
expert opinion suggests that both the prevalence of hypertension and anti-hypertensive prescribing
practices are likely to be similar to the CKD population in England.)
EXPENDITURE ON CKD
Section II:
NHS Expenditure Attributable to CKD

20
64. It is likely, however, that some of this expenditure would be incurred in the absence of CKD.
Modelling suggests that expected hypertension prevalence in a non-CKD population with the age and sex
profile of the CKD population is approximately 26%, based on HSE data.
29
Age and sex distributions are
taken from the NEOERICA findings, as these are not available in QOF data.
65. Excess hypertension in the CKD population is therefore estimated at 63%. This suggests that around
1.2 million people in the CKD population are prescribed anti-hypertensive medications, over and above
the number expected in a non-CKD population of the same age and sex profile. The cost of this excess
prescribing is estimated at £152 million, as shown in Table 6.
66. This cost does not include any expenditure on anti-hypertensive medication for the 26% of people
with CKD who are expected to have hypertension in the absence of CKD. Expert opinion suggests that
the cost of anti-hypertensive medications is higher for those with both CKD and hypertension than for
those with hypertension alone owing to greater use of ACE inhibitors in the CKD group. However, no
robust comparative data on anti-hypertensive prescribing for matched populations with and without CKD
has been identified. Therefore, no costs are counted for this group here.
67. It is important to note that hypertension is both a cause and a complication of CKD. In estimating
excess hypertension in the CKD population it is not suggested that hypertension in this group is
necessarily caused by CKD.
Table 6. Estimated numbers of people with CKD and hypertension, England, and costs of
anti-hypertensive medications
68. The number of people with CKD recorded in QOF as receiving hypertensive medications is very much
lower than the numbers suggested by the East Kent study. QOF data show that, in 2009–10, 82,834
people on the CKD register with hypertension and proteinuria were treated with an
angiotensin-converting enzyme inhibitor (ACEI) or angiotensin II receptor blocker (ARB).
2
This represents
4.6% of those on the CKD register. In the East Kent study, 36.7% of patients with CKD were prescribed
ACEIs and 18.7% were prescribed ARBs in 2008–10 However, the QOF indicator covers only patients
with proteinuria. (The QICKD study estimated the prevalence of proteinuria in stages 3–5 CKD at 4.0% to
10.1%, depending on the methods used to diagnose CKD and proteinuria.
5
)
Population Prevalence Number of patients Annual cost
CKD patients with hypertension
(estimate derived from Farmer C. et al.)
89.4% 1,625,260 £214,566,790
Expected hypertension without CKD 26.0% 472,369
Excess hypertension in CKD 63.4% 1,152,890 £152,204,595
Section II:
NHS Expenditure Attributable to CKD

21
69. In addition to anti-hypertensive medications, NICE clinical guideline 73 recommends that vitamin
D supplements should be prescribed for those with stages 3–5 CKD, according to need.
1
Data
supplied by the NHS Information Centre indicate that expenditure on vitamin D supplements
prescribed in primary care in England was £7.4 million in 2009–10. NICE recommends that
erythropoiesis-stimulating agents (ESAs) should be offered to people with anaemia of CKD who are
likely to benefit in terms of quality of life and physical function.
25
Expenditure on primary care
prescribing of erythropoietin (EPO) and ESAs was £9.7 million in 2009–10. Phosphate binders are
also frequently prescribed for people with CKD to prevent intestinal absorption of phosphate.
Primary care expenditure on phosphate binders in 2009–10 was £9.4 million.
30
70. These expenditure figures are based on estimates by The NHS Information Centre of the actual
price paid (as opposed to the list price), allowing for any applicable discounts. While prescribing data
are not available at disease level, expert opinion suggests that virtually all primary care expenditure
on vitamin D supplements, EPOs/ESAs and phosphate binders is likely to be for people with stages
3–5 CKD. This expenditure is summarised in Table 7.
71. NICE recommends bisphosphonates for osteoporosis prevention in CKD, and iron supplements
for those with functional iron deficiency.
1
However, these drugs are also prescribed for many patients
who do not have CKD and it has not been possible discretely to identify expenditure for those with
CKD. No costs are therefore included for bisphosphonates or iron supplements.
72. NICE also recommends diabetes management, smoking cessation and exercise programmes for
people with CKD, according to need.
1
No costs are estimated here for these interventions as it is
considered likely that in most cases eligibility for these treatments is determined by factors other
than CKD status.
Table 7. Primary care prescribing of vitamin D, EPO/ESAs and phosphate binders, 2009–10
(The NHS Information Centre)
EXPENDITURE ON CKD
Section II:
NHS Expenditure Attributable to CKD
Product Items Primary care expenditure (£)
Vitamin D 662,006 7,420,039
EPO/ESAs 45,797 9,723,189
Phosphate binders 59,225 9,413,957
Total £26,557,185

22
Outpatient care
73. NHS Reference Costs indicate that there were 679,538 nephrology outpatient consultations in
2009–10.
31
The total cost of this activity is estimated at £106 million (based on average unit costs in
Reference Cost returns). Not all of these consultations relate to stages 3–5 CKD. Some are likely to be for
stages 1–2 CKD and some for other renal conditions such as acute kidney injury and renal cancer. Owing
to the lack of detailed coding in outpatients, it is not possible to identify discretely consultations for CKD
in national datasets. Figures supplied by The North Bristol NHS Trust and University Hospitals of Leicester
NHS Trust indicate that approximately 50% of nephrology outpatient consultations are for stages 3–5
CKD (excluding RRT, which is counted separately in the RRT section, below). Expert opinion suggests that
this is a reasonable estimate of the national proportion. Costs for this proportion of activity are estimated
at £53 million, as shown in Table 8.
Table 8. Activity and expenditure, nephrology outpatients 2009–10 (NHS Reference Costs) and
estimated activity and expenditure for stages 3–5 CKD (excluding RRT)
Section II:
NHS Expenditure Attributable to CKD
First attendances Follow-up attendances All
Activity Cost Activity Cost Cost
All nephrology 84,305 £17,986,030 595,233 £88,341,995 £106,328,025
CKD 50% 42,128 £8,987,692 297,440 £44,144,851 £53,132,543

23
Inpatient care
74. A number of admitted patient Healthcare Resource Groups (HRGs) are specific to CKD or are
likely to contain almost exclusively CKD activity. Together, these HRGs accounted for 63,504 hospital
admissions in 2009–10, and expenditure of £75 million. Expenditure by HRG is shown in Table 9. It
should be noted that the CKD HRGs may include some activity for patients with stages 1–2 CKD. No
adjustment has been made as such admissions cannot be discretely identified and it is thought that
activity levels for these patients are likely to be small. Cost estimates are based on average unit costs
in Reference Cost returns.
Table 9. Cost of hospital admissions for CKD HRGs and dialysis-associated HRGs,
NHS Reference Costs 2009–10, (Department of Health)
CC: Complications or comorbidities
EXPENDITURE ON CKD
Section II:
NHS Expenditure Attributable to CKD
HRG v.4 Elective Non-elective
Regular
day/night
admissions
All
LA08A
Chronic kidney disease with
length of stay 2 days or more
with major CC
£2,292,303 £13,472,983 £37,671 £15,802,957
LA08B
Chronic kidney disease with
length of stay 2 days or more
with intermediate CC
£6,089,497 £12,015,613 £13,381 £18,118,492
LAO8C
Chronic kidney disease with
length of stay 2 days or more
without CC
£3,882,167 £2,968,166 £6,021 £6,856,354
LAO8E
Chronic kidney disease with
length of stay 1 day or less
associated with renal dialysis
£2,225,771 £1,970,598 £2,424 £4,198,793
LAO8F
Chronic kidney disease with
length of stay 1 day or less not
associated with renal dialysis
£6,402,344 £4,079,259 £121,872 £10,603,475
LAO5Z
Renal replacement peritoneal
dialysis associated
procedures
£1,676,815 £702,318 £18,336 £2,397,469
QZ13A
Vascular access for renal
replacement therapy with CC
£9,495,732 £3,636,710 £12,912 £13,145,355
QZ13B
Vascular access for renal
replacement therapy without
CC
£3,584,605 £175,882 £7,739 £3,768,226
Total £35,649,236 £39,021,530 £220,356 £74,891,121

24
Renal Replacement Therapy
75. The UK Renal Registry report for 2010 indicates that, in 2009, RRT prevalence was 40,962 in
England.
32
Of this number, 47% were transplant recipients, 44% were receiving haemodialysis and the
remainder were receiving peritoneal dialysis.
76. The costs of care for adult-recipient transplant were recently estimated by NHS Kidney Care.
33
A
bottom-up costing exercise was conducted, covering costs relating to initial assessment, maintenance on
the kidney transplant waiting list, the acute transplant episode, and post-transplant outpatient
consultations. Overheads and capital charges were excluded. Immunosuppression costs were included for
the first 12 weeks after transplantation only.
77. Table 10 sets out estimated expenditure related to kidney transplants, derived from the NHS Kidney
Care analysis. Costs from NHS Kidney Care have been adjusted upwards by 15%, as an estimate of the
impact of overheads. The number of patients receiving transplants in England is taken from NHS Blood
and Transplant (2,329 in 2009–10), as is the number of patients on the waiting list for a transplant (6,178
in 2009–10).
34
The number attending initial assessment clinics has been estimated based on UK figures
from a recent study by the NHS West Midlands Specialised Commissioning team.
35
(Of all UK transplants
in 2009–10, 86% were in England, and 86% of people on the kidney transplant list were in England.
34
This proportion has therefore been used to estimate the number of UK initial assessments that occur in
England.) The number of patients receiving ongoing post-transplant care (after year 1) is estimated from
UK Renal Registry data. (The prevalence in England at the end of 2009 was 19,418.
32
Deducting 2,329
people who received their transplants in 2009–10, the number of patients receiving ongoing
post-transplant care after year 1 is estimated at 17,089. No costs are counted for patients who died or
experienced graft failure during the year.) Costs of immunosuppression beyond 12 weeks and of ongoing
care are taken from a recent study by the NHS West Midlands Specialised Commissioning team.
35
78. Donor costs were not included in the NHS Kidney Care estimates. NHS Reference Costs for 2009–10
record expenditure of £59,112 on live kidney donor screening, pre-transplantation work-up and
post-transplantation examination.
31
It is likely, however, that this is a substantial underestimate. There are
81 episodes of live donor pre-transplantation work-up recorded in Reference Costs, nine donor screening
episodes and seven post-transplant examinations. NHS Blood and Transplant figures indicate that more
than 900 living donors gave kidneys for transplant in England in 2009–10.
34
79. No cost estimates were available for the retrieval and transportation of kidneys from deceased
donors. Therefore, these costs are excluded. The NHS Kidney Care costing exercise related to adult
transplant recipients. It is recognised that costs for paediatric recipients are likely to be different. However,
in the absence of detailed cost estimates for children, the estimates for adult care have been applied to
all transplants. The total annual cost of transplant is estimated at £225 million.
Section II:
NHS Expenditure Attributable to CKD

25
Table 10. Estimated annual expenditure on kidney transplants, England
80. According to the 2010 Renal Registry report, 21,544 people were receiving dialysis in England at
the end of 2009.
32
Of these, 18,191 were receiving haemodialysis and 3,353 were receiving
peritoneal dialysis. NHS Reference Costs for 2009–10 show dialysis activity valued at £505 million. Of
this sum, approximately £56 million was recorded for outpatient activity.
31
81. Implied annual per patient costs are £24,043 for haemodialysis and £20,078 for peritoneal
dialysis, as shown in Table 11.
82. In principle, NHS Reference Costs are calculated on a full cost absorption basis. The cost of
drugs such as EPO should therefore be included if provided by the acute trust at the time of dialysis,
at outpatient appointments or during a hospital admission. For this reason, no further costs are
counted here for drugs provided to dialysis patients by acute providers. Expenditure on EPO and ESAs
prescribed in primary care is estimated at £9.7 million, as shown in Table 7, above.
Table 11. Estimated expenditure on dialysis, 2009–10
EXPENDITURE ON CKD
Section II:
NHS Expenditure Attributable to CKD
Annual
cost per
patient
Patients
Annual
expenditure
Initial assessment clinic £2,537 2,531 £6,421,018
Waiting list clinic attendances (four times per year) £2,971 6,178 £18,356,775
Acute transplant episode £14,731 2,329 £34,307,984
Post-transplant outpatient visits, year 1 £12,884 2,329 £30,007,668
Immunosuppression after week 12 (year 1) £4,810 2,329 £11,201,675
Ongoing care (after year 1) £7,318 17,089 £125,050,287
Live donor costs (from 2009–10 Reference Costs) £59,112
Total £225,404,520
Haemodialysis
Peritoneal
dialysis
Patients 18,191 3,353
Implied unit cost £24,043 £20,078
Total cost £437,359,152 £67,321,076
All dialysis: £504,680,228

26
83. The implied annual cost per patient of haemodialysis may be compared with an estimated annual
cost of £28,074, derived from estimates in the 2002 NICE report on home versus hospital
haemodialysis.
36
(The figures in the NICE report have been updated to 2009–10 prices and a weighted
average has been calculated, based on data from the Renal Registry on the proportion of haemodialysis
patients treated in hospital, in satellite units and at home.)
84. Hospital admissions for complications arising from RRT are not included in these tables, though some
at least of these costs are captured in Table 12 above. Of the expenditure in Table 9, £24 million is in
HRGs specifically associated with RRT. It is likely that some of the remaining activity in Table 9 is also
related to RRT.
85. Although expenditure on non-health areas, such as benefit payments, is not within the scope of this
paper, it is important to recognise that it in many cases ESRD will significantly reduce an individual’s
mobility and ability to perform usual tasks. This is likely to entail both public and private costs. Public
costs include both benefit payments and lost tax revenue. These costs are likely to vary considerably
across RRT modalities.
86. The dialysis costs in Table 11 do not include patient transport costs. A 2010 audit found that
NHS-funded transport was provided for 61% of patient journeys in England for hospital and satellite
haemodialysis.
37
If these results are representative, they suggest that approximately 3.3 million
NHS-funded journeys are taken each year for dialysis. This estimate is based on the assumption that the
average patient travels to the dialysis centre three times a week, 52 weeks a year.
87. Costs of £50 million have been estimated for these journeys, using the average transport cost for a
patient attendance from NHS Reference Costs 2009–10. This is equivalent to £2,792 for each
haemodialysis patient, bringing the estimated annual mean cost of haemodialysis to £26,835 per patient.
No transport costs are estimated for transplant or peritoneal dialysis patients.
Section II:
NHS Expenditure Attributable to CKD

27
EXPENDITURE ON CKD
Chapter 4: Indirect Costs
88. Indirect costs are counted for excess length of hospital stay in people with CKD and for excess
adverse events occurring in the CKD population.
Excess length of hospital stay
89. Analysis of Hospital Episode Statistics (HES) data indicates that, in 2009–10, there were 86,488
ordinary hospital admissions (i.e. admissions in which the patient stayed in hospital for at least one
night) for which a CKD diagnosis (ICD 10 N18) was recorded. This figure excludes the activity covered in
CKD-specific HRGs, as outlined in Chapter 3. Maternity admissions and non-emergency hospital
transfers were also excluded.
90. Generalised linear model regression was conducted to estimate the impact of CKD diagnosis on
the length of stay in these admissions. Covariates were selected through pairwise analysis using
p<0.05 as the benchmark. Covariates used in the regression were CKD diagnosis, patient age, sex,
index of multiple deprivation decile, admission method (elective or emergency), and specialty type
(surgical or non-surgical).
91. Six model specifications were tested: normal, gamma and inverse Gaussian using both identity
and log links. Candidate models were ranked according to their Akaike information criterion (AIC)
values. The model with the lowest information criterion was the log-gamma model. The log-gamma
model results were therefore used to estimate parameters. The coefficient for CKD diagnosis in the
log model was 0.298 (95% CI 0.286–0.310). The value of the exponentiated coefficient was 1.35
(95% CI 1.33–1.36).
92. Using the mean length of stay for patients without a recorded CKD diagnosis (6.78 days) as a
baseline, the number of excess bed days in CKD was estimated at 203,625. The NHS Institute has
estimated the cost of an inpatient bed day at £225.
38
Expenditure on excess bed days for people with
CKD is estimated at £46 million. It should be noted, however, that the NHS Institute estimate is not
specific to CKD patients. As many people with CKD have substantial healthcare needs, it is possible
that the mean cost of an inpatient bed day for people with CKD is higher than the NHS Institute
estimate. If so, expenditure on excess length of stay will be higher than the figure estimated here.
Section II:
NHS Expenditure Attributable to CKD

28
Stroke and Myocardial Infarction
93. CKD is associated with increased risk of cardiovascular disease. A number of studies have shown
that stage 3–4 CKD is an independent risk factor for stroke, MI, fatal coronary heart disease and
death.
14,39
The risk of cardiovascular events is greater in stage 5 CKD than at earlier stages.
94. An economic model was constructed to estimate excess strokes and MIs in people with CKD. The
model estimated the expected incidence of strokes and MIs in a non-CKD population with the age and
sex distribution of the CKD population, and the incidence of strokes and MIs in the CKD population.
Costs were estimated for strokes and MIs in excess of the number that would be expected in the absence
of CKD. While costs are estimated here for excess adverse events in the CKD population, a causal
relationship between CKD and these adverse events is not asserted.
95. Estimates of CKD prevalence derived from the QICKD study and from the HSE were used.
3,5
The
estimated number of people in England with stages 3–5 CKD based on these prevalence estimates is
higher than the number of people recorded with CKD on the QOF register, as shown in Chapter 1.
96. For the HSE, CKD was directly diagnosed by means of blood and urine samples from survey
participants, thus identifying people with previously undiagnosed CKD. In the case of QICKD, the
prevalence estimate was based on eGFR measurements in primary care records. However, the difference
between prevalence estimates in this study and in QOF may suggest that not all of those who have
recorded eGFR measurements indicating CKD stages 3–5 are recognised by GPs as having the disease.
97. QICKD and HSE prevalence estimates were used to estimate excess adverse events as it is considered
likely that the risk of such events applies to the total CKD population. Indeed, the risk may be higher in
the undiagnosed than in the diagnosed population, owing to the lack of risk-ameliorating treatment.
98. The age distribution of people with CKD was taken from the NEOERICA study.
4
The number of
patients on dialysis in England was taken from the UK Renal Registry.
32
No excess strokes or MIs were
estimated for the transplant population.
Section II:
NHS Expenditure Attributable to CKD

29
EXPENDITURE ON CKD
Stroke
99. A recent meta-analysis has found that stage 3–4 CKD independently predicts incident stroke
with an adjusted HR of 1.22 (95% CI 1.02–1.44).
40
A Japanese study found a relative risk of stroke in
people receiving dialysis of 5.2 (p<0.001).
41
This figure may be compared with the results of a US
study which found an age-adjusted relative risk of stroke hospitalisation in people receiving dialysis
of 6.1 (95% CI 5.1–7.1) for Caucasian males, 4.4 (95% CI 3.3–5.5) for African–American males, 9.7
(95% CI 8.2–11.2) for Caucasian females, and 6.2 (95% CI 4.8–7.6) for African–American females.
42
No estimate of relative risk for the English dialysis population has been identified. As the US study
did not produce a CKD-population-level estimate of relative risk, the figure from the Japanese study
is used here. It is recognised, however, that the estimate of excess strokes in people receiving dialysis
is subject to uncertainty as the relative risk appears to vary with ethnicity. Excess strokes in the
dialysis population represent 13-14% of all excess strokes estimated here.
100. The expected number of strokes in a non-CKD population of the same size as the CKD
population, and with the same age and gender profile, was derived from WHO estimates of UK
stroke incidence.
43
The number of strokes in the CKD population was estimated using the
meta-analysis results for stages 3-4 and the Japanese study results for dialysis. The number of excess
strokes was estimated by deducting the expected number from the CKD estimate.
101. The economic model estimates the incidence of stroke in a non-CKD population with the age
and sex profile of the CKD population at 9.6 per 1,000 patient years. The incidence of stroke in the
CKD population is estimated at 12.0 per 1,000 patient years. Using QICKD prevalence estimates for
CKD, the number of excess strokes per year in the CKD population, relative to an age- and
sex-matched population without the condition, is estimated at 6,734. Excess strokes are estimated
for the population aged 25 and above. The number of excess strokes per year in the CKD population
is estimated at 6,533, based on HSE prevalence.
102. The cost to the NHS of health care related to these strokes is estimated at £80 million to £82
million a year, as shown in Table 12. Costs are derived from the National Audit Office 2005 report on
stroke care, and updated to 2009–10 prices.
44
Estimated social care costs for these strokes are shown in
Appendix 2.
Section II:
NHS Expenditure Attributable to CKD

30
Myocardial Infarction
103. The adjusted HR for MI in people with stage 3–4 CKD is taken from a population-based study of
7,534 adults who took part in the World Health Organisation’s MONICA Augsburg survey.
45
The adjusted
HR for MI in women with stage 3–4 CKD, compared with those with eGFR ≥60 ml/min/1.73 m
2
, was
1.67 (95% CI 1.07–2.61). The adjusted HR for men was 1.51 (95% CI 1.09–2.10).
104. The baseline population risk has been taken from the Oxford Record Linkage Study (data supplied
to the British Heart Foundation).
46
Population risk is estimated for the population aged 35 and above.
Excess MIs in the CKD population have therefore been estimated for this patient group only. No robust
estimate of the excess risk of MI in people on dialysis was identified. The HR for stage 3–4 CKD has
therefore been applied to this patient group. It is possible, therefore, that excess MIs are underestimated.
No excess MIs have been estimated for transplant patients.
105. The economic model estimates the incidence of MI in a non-CKD population of the age and sex
profile of the CKD population at 7.4 per 1,000 patient years (10.5 for men and 6.0 for women). The
incidence for the CKD population is estimated at 11.9 (15.9 for men and 10.0 for women).
106. Using the QICKD prevalence estimate, the model suggests that 12,334 excess MIs a year occur in
people with CKD. The number of excess MIs in CKD based on the HSE prevalence estimate is 12,189.
107. The first year cost of each MI is estimated at £7,734. This figure is derived from cost estimates
produced by NICE, adjusted to 2009–10 prices.
47
The total cost to the NHS is estimated at £94–95
million, as shown in Table 12.
Table 12. Estimated excess strokes and MIs in the CKD population and associated expenditure, 2009–10
108. CKD also entails excess risk of other conditions, such as chronic ischaemic heart disease, heart
failure and fragility fractures.
48
The cost estimates shown here are therefore likely to be an underestimate
of total indirect costs.
Section II:
NHS Expenditure Attributable to CKD
QICKD HSE
Unit costs Events Expenditure Events Expenditure
Stroke £12,200 6,734 £82,155,382 6,533 £79,703,607
MI £7,734 12,334 £95,391,156 12,189 £94,269,590

31
Infection
109. Patients with CKD have an increased rate of infection compared with the non-CKD population.
In England, the Health Protection Agency (HPA) collects data on MRSA infections in RRT patients. In
2008-09 there were 153 reported and verified cases of MRSA in haemodialysis patients.
63
(No episodes
of bacteraemia were reported in people receiving peritoneal dialysis.) The median centre-specific rate of
MRSA bacteraemia was 0.64 (range 0–3.49) episodes per 100 haemodialysis patients per year.
110. The total number of MRSA infections reported in England (among renal and non-renal
patients) was 2,935 in 2008–09, or approximately 0.006 per 100 people. Given these figures, the
expected number of infections in 17,349 people (the number of people receiving haemodialysis) is
0.98, so approximately 152 of the 153 reported cases among haemodialysis patients can be
attributed to CKD. (This figure is not adjusted for age or comorbidity as MRSA data are not available
by population sub-group. As it is known that the risk of MRSA increases with age and comorbidity,
and CKD prevalence also increases with age and comorbidity, this attribution figure may be a slight
overestimate. Sensitivity analysis was therefore conducted using the population aged 65 and over as
the denominator to calculate MRSA incidence. If it were the case that all MRSA cases occurred in this
age cohort, the expected number of infections in 17,349 people would be six. The number of cases
in the haemodialysis population attributable to CKD would therefore be 147.)
111. The average cost of a bacteraemia infection is not known with confidence. A study conducted
for the Department of Health estimated the hospital costs of a bloodstream infection at £5,397 in
1994–95 prices.
49
This is equivalent to £9,316 in 2009–10 prices. The total cost of 152 infections, at
£9,316 per infection, is £1.4 million.
112. However, it is likely that MRSA infections related to haemodialysis are a relatively small
proportion of total CKD-related infections. There is evidence that the incidence of a wide range of
infections is greater for people with CKD than for those without CKD, and that this effect holds for
the general CKD population (stages 3–5), not just for those receiving haemodialysis. The HPA does
not report CKD status for patients who are not receiving dialysis. It is therefore not possible to
estimate from these data the number of MRSA infections attributable to CKD in the non-dialysis
population.
113. There is evidence that dialysis patients are at particular risk of Clostridium difficile infection.
50
A study in an Irish hospital showed that rates of Clostridium difficile were four times as high among
patients in the nephrology unit (10.7 per 1,000 admissions) as in other areas of the hospital (2.7 per
1,000 admissions).
51
114. The United States Renal Data System provides evidence that hospital admissions for
bacteraemia/septicaemia, pneumonia and urinary tract infection are higher in patients with stage
3–5 CKD than in the non-CKD population.
52
115. It was not possible to estimate the cost of CKD-related infections other than MRSA in
haemodialysis as no robust data sources were identified.
EXPENDITURE ON CKD
Section II:
NHS Expenditure Attributable to CKD

32
Chapter 5: Summary of Costs
116. Total expenditure attributable to CKD in 2009–10 is estimated at £1.45 billion, as shown in
Table 13. This is equivalent to 1.3% of NHS expenditure in England.
Table 13. Summary of CKD-associated expenditure, 2009–10
Section II:
NHS Expenditure Attributable to CKD
Category of care Expenditure
Primary Tests and consultations £142,620,986
Anti-hypertensive medications £152,204,595
Osteoporosis prevention and vitamin
D supplements
£26,557,185
Primary £321,382,767
Acute Outpatient attendances £53,132,543
Admitted patient care £74,891,121
Acute £128,023,664
ESRD Transplantation £225,404,520
Dialysis £504,680,228
Transport for dialysis £49,521,157
ESRD £779,605,905
Indirect costs Excess length of hospital stay £45,815,625
Excess strokes £79,703,607–£82,155,382
Excess MIs £94,269,590–£95,391,156
Excess MRSA £1,416,108
Indirect costs £221,204,929–£224,778,271
£1,450,217,265–
£1,453,790,607

33
117. These costs are likely to be an underestimate of total NHS spending on CKD as there are a
number of areas in which it has not been possible to estimate costs. No costs have been included for
conservative care, or for prescribing in areas where it was not possible to identify discrete costs for
the CKD population. Transplant donor costs are likely to be underestimated as they are
under-reported in NHS Reference Costs and no robust alternative cost estimates were identified.
118. Where there is uncertainty regarding the level of costs, a conservative approach has been
adopted. For example, it is assumed that primary care urine and blood pressure tests for the CKD
population take place at 15-month intervals, as specified in the QOF, but it is likely that many
patients are tested more frequently.
119. People with CKD have longer hospital stays than an age-matched population without the
condition, and are at increased risk of adverse cardiovascular events and infections. Indirect costs are
estimated for excess strokes, MIs and hospital bed days in the CKD population, and for excess MRSA
infections in those receiving haemodialysis.
120. It is known that CKD is also associated with increased incidence of conditions such as heart
failure and fragility fractures, which are not considered here.
48
There is also evidence that people
with CKD are at increased risk of infections other than MRSA, and that this effect holds for the
general CKD population (stages 3–5), not just for those receiving haemodialysis.
51
121. All estimates are based on current practice rather than on optimal care.
122. The estimate of total expenditure is more than twice the sum that would be produced by
extrapolating from the costs in the 2002 Wanless report, Securing our Future Health: Taking a
Long-term View. Spending on kidney care in 2002–03 was estimated at £445 million (£580 million in
2009–10 prices).
22
Costing methodology was not set out in the Wanless report, so it is not possible
to make a detailed comparison of our estimates with the earlier figures. However, a substantial rise in
expenditure in recent years would not be surprising, as there have been significant increases in
diagnosed prevalence and changes in the management of CKD and associated risks. The total
prevalence (diagnosed and undiagnosed) is also believed to be increasing.
123. Programme Budgeting data from the Department of Health estimated total NHS expenditure
on renal problems at £1.64 billion in 2009–10.
23
However, the Programme Budgeting renal category
is broader than CKD. The Programme Budgeting estimates therefore include expenditure on other
renal conditions. Programme Budgeting data for renal problems do not include indirect costs (which
contribute £221–£225 million to the total estimated in this paper). Total direct costs estimated here
are £1.23 billion.
124. In Programme Budgeting data, 5% of PCT expenditure on renal problems was attributed to
primary care and 95% to secondary care. The proportion of direct costs attributed to primary care in
this paper is considerably higher (12% without prescribing costs, 26–27% if prescribing costs are
included).
EXPENDITURE ON CKD
Section II:
NHS Expenditure Attributable to CKD

34
125. The evidence presented in this paper suggests that CKD leads to thousands of premature deaths
each year, diminishes quality of life for many people and represents a significant financial burden for the
NHS. The risk of death, the impact on quality of life, and the cost to the NHS are very much higher for
people with advanced kidney disease than for those with moderate CKD.
126. More than half of total estimated expenditure on CKD is for RRT, although the RRT population
comprises only one in 50 of the diagnosed CKD population. The mean annual cost of direct CKD care per
patient receiving dialysis can be crudely estimated at £27,000, the cost per transplant recipient at
£12,000 and the cost per patient not receiving RRT at £235, as shown in Figure 2.
Figure 2. Estimated annual cost of CKD care per patient, non-RRT, transplant and dialysis
127. Given the impact of ESRD on survival and quality of life, and the high level of expenditure on RRT,
there is a need for further analysis on the potential for improved outcomes and cost savings through
enhanced strategies to reduce progression rates to ESRD. For example, modelling based on the costs in
this paper suggests that ACEI/ARB prescribing for patients with hypertension and proteinuria produces a
mean annual net saving to the NHS of approximately £470 per treated patient over a 5-year perspective.
This saving arises through reduced ESRD, stroke and MI risk.
53
QOF data indicate that, in 2009–10,
82,834 people with hypertension and proteinuria (6.1% of those who had an ACR or PCR test) were
treated with ACEI/ARBs. The net annual saving for this group, over a 5-year perspective, is estimated at
£39 million. Further details of this economic model are given in Appendix 3.
Section III:
Discussion
£30,000
£25,000
£20,000
£15,000
£10,000
£5,000
£0
Non-RRT
Transplant Dialysis
Estimated annual cost of CKD care

35
DISCUSSION
128. However, approximately 468,000 people on CKD registers did not have an ACR or PCR test in
the 15 months before the 2009–10 QOF data collection. If the joint prevalence of hypertension and
proteinuria were at the same level in the untested group as in the tested CKD population, there
could be an additional 29,000 patients who would benefit from ACEI/ARB prescribing. The net
annual saving from ACEI/ARB prescribing for a group of this size is estimated at £13 million over a
5-year perspective. (In 2010-11, there was an increase in the percentage of patients who received
these tests. Based on 2010-11 data, it is estimated that there could be 26,000 patients who did not
receive these tests and might benefit form ACEI/ARB prescribing). There may also be undiagnosed
hypertension and proteinuria in the 900,000 to 1.8 million people who are believed to have
undiagnosed CKD.
3,4,5
129. There is also a need for further work on the relative costs and benefits of RRT modalities. The
implied annual per patient cost for peritoneal dialysis presented in this paper is lower than that for
haemodialysis. However, these figures are derived from NHS Reference Costs, and do not include the
full impact of infections and complications. Most recent UK studies have found that mean costs are
lower for peritoneal dialysis than for haemodialysis,
54-56
though one study reported that it may be
more cost-effective to manage patients starting RRT with hospital haemodialysis than continuous
ambulatory peritoneal dialysis, given the existence of the haemodialysis infrastructure.
57
Home
haemodialysis may be less expensive than peritoneal dialysis.
56
There is also uncertainty regarding the
relative clinical effectiveness of different modalities.
55
130. Because of the paucity of data on resource use by people with CKD in the English NHS,
cost-effectiveness and cost–benefit studies have often been based on international data. However, it
is known that care delivery and associated expenditure vary substantially across countries. It is hoped
that this paper will provide a robust foundation for cost analysis in future studies and for tackling
questions such as the cost-effectiveness of screening for CKD and of strategies for early detection
and disease management.
Section III:
Discussion

36
Conservative Care
1. It is not known how many renal patients are receiving conservative care in England. Numbers are
likely to vary from unit to unit depending on patient preferences and on local provision of conservative
care. Estimates from one centre (Barts and The London NHS Trust) suggest that approximately 5% of
those with renal failure choose conservative care rather than RRT.
58
A recent Renal Registry survey of all
renal units in the UK found that the mean percentage of prevalent stage 5 CKD patients over the age of
75 said to be receiving conservative care was 16.7%.
59
2. A 2009 retrospective cohort study of 396 stage 4 CKD patients in Scotland and Northern Ireland
found that 89 commenced RRT while 20 chose conservative care.
60
Most patients died before being
offered RRT. The percentage of the entire cohort opting for conservative care was 5.1%. The percentage
of the combined RRT and conservative care group who chose conservative care was 18.3%. The study
population was elderly, however, with 71.7% of patients aged ≥65, and it may be that preference for
conservative care increases with age.
3. The cost per patient of conservative care provided by a renal unit has been estimated at £397 per
month (£4,764 per year).
58
However, expert opinion suggests that not all conservative care patients are
likely to receive such resource-intensive care. In the early stages of conservative care, resource use may be
similar to that of a stage 3–4 CKD patient, with care (and expenditure) increasing over time with disease
progression.
4. Survival rates with conservative care are estimated at 68% and 47% for 1 and 2 years, respectively.
61
5. Using these cost and survival estimates (and assuming that 3-year survival is 25% and 4-year survival
is 0), prevalence figures and costs have been estimated for three scenarios: 5% uptake of conservative
care (of those choosing between dialysis and conservative care); 10% uptake; and 18% uptake. Annual
expenditure estimates range from £3 million for the 5% scenario to £13 million for the 18% scenario, as
shown in Table A1. The costs shown are only for renal units. It is possible that conservative care patients
will also incur costs in primary and community care, in excess of those set out in Chapter 3.
Table A1. Estimated conservative care costs, for 5%, 10% and 18% uptake
Appendix 1
Scenarios
Estimated conservative
care prevalence
Annual renal unit cost
5% uptake 643 £3,061,990
10% uptake 1,363 £6,491,939
18% uptake 2,692 £12,825,537

37
APPENDIX
Appendix 2
Social Care Costs
1. In most areas of CKD care it has not been possible to estimate social care costs. In the case of
stroke, social care costs have been estimated.
2. The cost of stroke was derived from the 2005 report from the National Audit Office on stroke
care, and updated to 2009–10 prices.
44
Annual stroke costs are shown here for health care and social
care (Table A2), based on QICKD and HSE estimates of CKD prevalence. Social care accounts for more
than 60% of stroke expenditure.
3. Unit costs are mean costs across the incident and prevalent stroke population. Total expenditure
estimates cover both first year costs for incident strokes and long-term care costs for those whose
strokes occurred in earlier years.
Table A2. Estimated health and social care costs of excess strokes in CKD, 2009–10
4. When the cost of social care for excess strokes in CKD is added to the health costs estimated in
this paper, the total cost of CKD in 2009–10 rises to £1.66–£1.67 billion.
Health Social care Total
CKD
prevalence
estimate
Strokes Unit cost Expenditure Unit cost Expenditure Expenditure
QICKD 6,734
£12,200
£82,155,382
£19,435
£130,869,840 £213,025,222
HSE 6,533 £79,703,607 £126,964,272 £206,667,879

38
Cost impact of ACEI/ARBs for hypertension and proteinuria
An economic model was created to estimate the cost impact of ACEI/ARB prescribing for people with
CKD who have hypertension and proteinuria.
Annual transition rates to ESRD (hypertension and proteinuria untreated = 0.033, hypertension and
proteinuria treated = 0.022) were taken from NICE
1
.
The population is adjusted for annual mortality. The mortality rate for non-ESRD is calculated using ONS
data on all-cause mortality, adjusted using hazard ratios for age and CKD stage
62
and the NICE estimate
that the mortality rate for this group is reduced by 22% with ACEI/ARB therapy
1
.
Transplant probabilities in ESRD are estimated based on Renal Registry and NHS Blood and Transplant
data
32,34
. The costs of dialysis and transplant are taken from a recent report
35
.
Annual graft failure and mortality rates for transplant recipients are taken from the Renal Registry
32
. It
has been assumed that 62% of transplants are from deceased donors
34
. The renal transplant annual
failure rate (2.9% in the UK in 2009) and death rate in prevalent patients (2.5 per 100 patient years) are
taken from the Renal Registry 2010 report
32
. Dialysis mortality is estimated using data from the Renal
Registry 2010 report
32
.
The annual cost per patient of ACEI/ARBs is taken from a recent study at East Kent University Hospitals
NHS Foundation Trust
28
.
Appendix 3

39
REFERENCES
1
National Institute for Health and Clinical Excellence. Chronic kidney disease: Early identification and
management of chronic kidney disease in adults in primary and secondary care. Clinical guideline 73. London:
NICE, 2008. Available from www.nice.org.uk/CG73, last accessed 6 May 2012
2
The Information Centre for health and social care. Prevalence Data Tables. Leeds: The NHS Information Centre
for health and social care, 2011. Available from
http://www.ic.nhs.uk/statistics-and-data-collections/supporting-information/audits-and-performance/the-quality-
and-outcomes-framework/qof-2009-10/data-tables/prevalence-data-tables, last
accessed 6 May 2012.
3
Roth M, Roderick P, Mindell J. Kidney disease and renal function. In: Craig R, Mindell J, eds. Health Survey for
England – 2010: Respiratory Health (vol. 1). Leeds: The Health and Social Care Information Centre, 2011.
Available from www.ic.nhs.uk/pubs/hse10report, last accessed 30 April 2012.
4
Stevens PE, O'Donoghue DJ, de Lusignan S et al. Chronic kidney disease management in the United Kingdom:
NEOERICA project results. Kidney Int 2007;72:92–9.
5
de Lusignan S, Tomson C, Harris K et al. Creatinine fluctuation has a greater effect than the formula to
estimate glomerular filtration rate on the prevalence of chronic kidney disease. Nephron Clin Pract 2011;117:
c213–24.
6
Viktorsdottir O, Palsson R, Andresdottir M.B. et al. Prevalence of chronic kidney disease based on estimated
glomerular filtration rate and proteinuria in Icelandic adults. Nephrol Dial Transplant 2005 20: 1799–1807
7
Verhave JC, Hillege HL, Burgerhof JG et al. The association between atherosclerotic risk factors and renal
function in the general population. Kidney Int 2005;67:1967–73.
8
Fogarty DG, Maxwell AP, Savage G et al. There is no population level benefit in using estimated glomerular
filtration rate (eGFR) versus serum creatinine for identifying and referring patients with CKD J Am Soc Nephrol
2005;16:319A
9
Chadban SJ, Briganti EM, Kerr PG et al. Prevalence of kidney damage in Australian adults: The AusDiab kidney
study. J Am Soc Nephrol 2003;14:S131–8.
10
Coresh J, Selvin E, Stevens LA et al. Prevalence of chronic kidney disease in the United States. JAMA
2007;298:2038–47.
11
Matsushita K, van der Velde M, Astor BC et al. Association of estimated glomerular filtration rate and
albuminuria with all-cause and cardiovascular mortality in general population cohorts: a collaborative
meta-analysis. Lancet 2010;375:2073–81.
12
Drey N, Roderick P, Mullee M, Rogerson M. A population-based study of the incidence and outcomes of
diagnosed chronic kidney disease. Am J Kidney Dis 2003;42:677–84.
13
John R, Webb M, Young A, Stevens PE. Unreferred chronic kidney disease: a longitudinal study. Am J Kidney
Dis 2004;43:825–35.
14
Go AS, Chertow GM, Fan D et al. Chronic kidney disease and the risks of death, cardiovascular events, and
hospitalization. N Engl J Med 2004;351:1296–305.
15
Ho D, Harris S, Verne J. Deaths from renal diseases in England, 2001 to 2008. NEoLCIN Bulletin No. 2, June
2010. Leicester: National End of Care Intelligence Network. Available from
www.endoflifecare-intelligence.org.uk/view.aspx?rid=73, last accessed 6 May 2012.
References

40
16
Office for National Statistics. Death Registrations by Cause in England and Wales, 2009. Newport: Office for
National Statistics, 2010. Available from www.ons.gov.uk/ons/datasets-and-tables, last accessed 30 April 2012.
17
National Institute for Health and Clinical Excellence. Updated Guide to the Methods of Technology Appraisal.
London: NICE, 2008. Available from
www.nice.org.uk/media/B52/A7/TAMethodsGuideUpdatedJune2008.pdf, last accessed 6 May 2012.
18
Dale PL, Hutton J, Elgazzar H. Utility of health states in chronic kidney disease: a structured review of the
literature. Curr Med Res Opin 2008;24:193–206.
19
Greiner W, Obermann K, Graf Schulenburg v.d. J-M. Socio-economic evaluation of kidney transplantation in
Germany Arch Hell Med 2001;18:147–55.
20
Sennfalt K, Magnusson M, Carlsson P. Comparison of hemodialysis and peritoneal dialysis--a cost-utility analysis.
Perit Dial Int 2002;22:39-47.
21
Tajima R, Kondo M, Kai H et al. Measurement of health-related quality of life in patients with chronic kidney
disease in Japan with EuroQol (EQ-5D). Clin Exp Nephrol 2010;14:340–8.
22
Wanless D. Securing our Future Health: Taking a Long-Term View. Final Report London: HM Treasury, 2002.
Available from www.hm-treasury.gov.uk/wanless, last accessed 6 May 2012.
23
Available from
http://www.dh.gov.uk/en/Managingyourorganisation/Financeandplanning/Programmebudgeting/DH_075743 last
accessed 12 May 2012
24
Personal communication from the Department of Health
25
National Institute for Health and Clinical Excellence. Anaemia Management in people with chronic kidney disease.
Clinical Guideline 114. London: NICE, 2011. Available from www.nice.org.uk/CG114, last accessed 6 May 2012
26
Department of Health. Putting Prevention First: Vascular Checks Risk Assessment and Management – Impact
Assessment. London: Department of Health, 2008. Available from
www.dh.gov.uk/en/Publicationsandstatistics/Publications/PublicationsLegislation/DH_090351, last accessed 6 May
2012.
27
Curtis L. Unit Costs of Health and Social Care. Canterbury: Personal Social Services Research Unit, 2009. Available
from www.pssru.ac.uk/publication-details.php?id=128, last accessed 6 May 2012.
28
Farmer C, Irving J, Karunaratne K. et al. What does it actually cost to improve population blood pressure control?
Abstract, World Congress of Nephrology, 8–12 April 2011, Vancouver, Canada.
29
Ali A, Becker E, Chaudhury M et al. In: Craig R, Mindell J, eds. Health Survey for England – 2006: Cardiovascular
disease and risk factors in adults (vol. 1). Leeds: The Information Centre, 2008. Available from
www.ic.nhs.uk/webfiles/publications/HSE06/HSE%2006%20report%20VOL%201%20v2.pdf, last accessed 30
April 2012.
30
Personal communication from The NHS Information Centre for health and social care.
31
NHS Reference Costs 2009-10. Available from
http://www.dh.gov.uk/en/Publicationsandstatistics/Publications/PublicationsPolicyAndGuidance/DH_123459. Last
accessed 12 May 2012
32
UK Renal Registry: The Thirteenth Annual Report, December 2010. Available from
www.renalreg.com/Reports/2010.html. Last accessed 6 May 2012.
References

41
REFERENCES
33
NHS Kidney Care. Developing Robust Reference Costs for Kidney Transplantation in Adults. Final Report,
March 2010. London: NHS Kidney Care, 2010. Available from
www.kidneycare.nhs.uk/Library/developingrobustreferencereportfinal.pdf, last accessed 6 May 2012.
34
NHS Blood and Transplant. Transplant Activity in the UK Activity. Report 2009/10. Bristol: NHS Blood and
Transplant, 2010. Available from
www.organdonation.nhs.uk/ukt/statistics/transplant_activity_report/current_activity_reports/ukt/activity_report_2009_1
0.pdf
last accessed 6 May 2012.
35
West Midlands Specialised Commissioning Team. Organs for Transplants: An Analysis of the Current Costs of
the NHS Transplant Programme; the Cost of Alternative Medical Treatments, and the Impact of Increasing
Organ Donation. Birmingham: NHS West Midlands Specialised Commissioning Team, 2010. Available from
www.wmsc.nhs.uk/uploaded_media/OfT%20Economics%20paper%20October%202010%20(final%20draft)
.pdf, last accessed 6 May 2012.
36
Mowatt G, Vale L, Perez J et al. Systematic Review of the Effectiveness and Cost-Effectiveness of Home
Versus Hospital or Satellite Unit Haemodialysis for People with End Stage Renal Failure. London: NICE, 2002.
Available from www.nice.org.uk/guidance/index.jsp?action=download&o=32447, last accessed 6 May.
37
The Information Centre for health and social care. National Kidney Care Audit (NKCA) - Patient Transport.
Leeds: The Information Centre for health and social care, 2010. Available from
https://iview.ic.nhs.uk/DomainInfo/RenalTransport, last accessed 6 May 2012.
38
NHS Institute for Innovation and Improvement. Quality and Service Improvement Tools: Length of Stay -
Reducing Length of Stay. NHS Institute for Innovation and Improvement Coventry: NHS Institute for Innovation
and Improvement, 2008. Available from
http://www.institute.nhs.uk/quality_and_service_improvement_tools/quality_and_service_improvement_tools/length_of_sta
y.html
last accessed 2 December 2011.
39
Weiner DE, Tighiouart H, Amin MG et al. Chronic kidney disease as a risk factor for cardiovascular disease
and all-cause mortality: a pooled analysis of community-based studies. J Am Soc Nephrol 2004;15:1307–15.
40
Weiner DE, Tighiouart H, Levey AS et al. Lowest systolic blood pressure is associated with stroke in stages 3
to 4 chronic kidney disease. J Am Soc Nephrol 2007;18:960–6.
41
Iseki K, Kinjo K, Kimura Y et al. Evidence for high risk of cerebral hemorrhage in chronic dialysis patients.
Kidney Int 1993;44:1086–90.
42
Seliger SL, Gillen DL, Longstreth WT, Jr. et al. Elevated risk of stroke among patients with end-stage renal
disease. Kidney Int 2003;64:603–9.
43
Truelsen T, Piechowski-Jozwiak B, Bonita R et al. Stroke incidence and prevalence in Europe: a review of
available data. Eur J Neurol 2006;13:581–98.
44
National Audit Office. Department of Health. Reducing Brain Damage: Faster Access to Better Stroke Care.
London: HMSO, 2005. Available from www.nao.org.uk/publications/0506/reducing_brain_damage.aspx, last
accessed 6 May 2012.
45
Meisinger C, Doring A, Lowel H. Chronic kidney disease and risk of incident myocardial infarction and
all-cause and cardiovascular disease mortality in middle-aged men and women from the general population.
Eur Heart J 2006;27:1245–50.
References

42
46
www.heartstats.org/datapage.asp?id=1085
47
National Institute for Health and Clinical Excellence. Costing Report. Lipid modification. Implementing NICE
Guidance. London: NICE, 2008. Available from
www.nice.org.uk/nicemedia/live/11982/40776/40776.pdf, last accessed 6 May 2012.
48
KDIGO clinical practice guideline for the diagnosis, evaluation, prevention, and treatment of Chronic Kidney
Disease-Mineral and Bone Disorder (CKD-MBD). Kidney Int Suppl 2009:S1–130.
49
Plowman R. The socioeconomic burden of hospital acquired infection. Euro Surveill 2000;5:49–50.
50
Cumming AD, Thomson BJ, Sharp J et al. Diarrhoea due to Clostridium difficile associated with antibiotic
treatment in patients receiving dialysis: the role of cross infection. Br Med J (Clin Res Ed) 1986;292:238–9.
51
Cunney RJ, Magee C, McNamara E et al. Clostridium difficile colitis associated with chronic renal failure. Nephrol
Dial Transplant 1998;13:2842–6.
52
U S Renal Data System, USRDS 2009 Annual Data Report: Atlas of Chronic Kidney Disease and End-Stage Renal
Disease in the United States, National Institutes of Health, National Institute of Diabetes and Digestive and Kidney
Diseases, Bethesda, MD, 2009.
53
Jafar TH, Schmid CH, Landa M et al. Angiotensin-converting enzyme inhibitors and progression of nondiabetic
renal disease. A meta-analysis of patient-level data. Ann Intern Med 2001;135:73–87.
54
Baboolal K, McEwan P, Sondhi S. et al. The cost of renal dialysis in a UK setting—a multicentre study. Nephrol Dial
Transplant 2008; 23: 1982–1989.
55
National Institute for Health and Clinical Excellence. Peritoneal dialysis in the treatment of stage 5 chronic kidney
disease. London: NICE, 2011. Available from www.nice.org.uk/CG125, last accessed 6 May 2012.
56
Kidney Dialysis – developing costs to deliver an equitable and high quality service. London: NHS Kidney Care
2009.
57
Kirby L, Vale L. Dialysis for End-Stage Renal Disease Determining a Cost-effective Approach. Int J Technol Assess
Health Care 2001; 17(2): 181–189.
58
Conway B, Webster A, Ramsay G et al. Predicting mortality and uptake of renal replacement therapy in patients
with stage 4 chronic kidney disease. Nephrol Dial Transplant 2009;24:1930–7.
59
Personal communication from The Barts and The London NHS Trust.
60
Personal communication from The UK Renal Registry.
61
Murtagh FE, Marsh JE, Donohoe P et al. Dialysis or not? A comparative survival study of patients over 75 years
with chronic kidney disease stage 5. Nephrol Dial Transplant 2007;22:1955–62.
62
O’Hare AM, Bertenthal D, Covinsky KE et al. Mortality risk stratification in chronic kidney disease: one size for all
ages? JASN 2006; 58017: 846–853.
63
UK Renal Registry, The Twelfth Annual Report, December 2009, available from
http://www.renalreg.com/Reports/2009.html, last accessed 8 July 2012.
References


www.kidneycare.nhs.uk
