
2023 Findings from the Diary of
Consumer Payment Choice
Emily Cubides
Shaun O’Brien

Table of Content
Acknowledgements ......................................................................................................... 3
Summary ......................................................................................................................... 4
2022 consumer payment behavior remains consistent with early pandemic. .............. 4
Trends in Payment .......................................................................................................... 6
Consumers increased credit card use as cash use remained consistent. .................... 6
Factors affecting consumer cash payments. ................................................................... 7
Share of online purchases remained elevated compared to pre-pandemic. ................ 7
Increased card preference since 2020 reduced the probability of cash use. ............... 8
In-person payments increase as cash remained stable at select merchants. ............ 10
Small-value cash payments increased slightly from 2021. ......................................... 11
Cash Use by Demographics .......................................................................................... 12
Cash use remained below pre-pandemic levels for all age groups. ........................... 12
Cash was the most used payment for the lowest income households. ...................... 13
Cash is crucial for consumers who do not use traditional banking services. .............. 15
Trends in Cash Holdings ............................................................................................... 16
Average on-person holdings remain elevated compared to pre-pandemic. ............... 16
Store-of-value cash holdings increased and remain elevated. ................................... 18
Most consumers expected to continue using cash. .................................................... 18
Conclusion .................................................................................................................... 19
Appendix ....................................................................................................................... 20
About the Diary of Consumer Payment Choice.......................................................... 20
About Federal Reserve Financial Services ................................................................ 21
About FedCash® Services ......................................................................................... 21
References ................................................................................................................. 22
The views in this paper are solely the responsibility of the authors and should not be interpreted as reflecting
the views of the Federal Reserve System.
Acknowledgements
This paper would not have been possible without the support and contributions of the
following individuals. From the Atlanta Fed: David Altig, Antar Diallo, Kevin Foster, Claire
Greene, Marcin Hitczenko, Brent Meyer, and Oz Shy. From the Boston Fed: Ruth Cohen
and Joanna Stavins. From the San Francisco Fed: John Brady, Simon Kwan, and Sandra
Rolnicki. From Federal Reserve Financial Services: Alexander Bau, Haley Gibson, Ben
Gold, Steve Son, and Kathleen Young.

Summary
2022 consumer payment behavior remains consistent with early pandemic
At the onset of the pandemic in 2020, US consumers dramatically changed how they
purchased goods and services, favoring credit cards by a significant margin and
increasing their use of online payments. With the country emerging from the pandemic
and economic conditions characterized by high inflation, we were interested to see if this
trend would continue.
1
Analyzing the 2022 survey data that informs the Diary of Consumer Payment Choice, we
found that 2020’s shift away from cash and toward credit card payments has continued.
Consumers continued to reach for credit cards at a higher rate in 2022. Their use of on-
line payments also remained elevated as compared to pre-pandemic payment habits. By
contrast, consumer use of debit cards and cash held steady at 2020 levels.
Although consumers are making fewer cash payments when compared to pre-pandemic,
both on-person and store-of-value cash holdings remained above pre-pandemic levels in
2022, signifying 1) consumers’ demand for cash remains and 2) there may be a long-term
impact from the onset of the pandemic on consumer cash holdings.
2
The key Diary findings are:
• The share of payments made using cash declined slightly from 2020 and 2021 to
18 percent of all payments, driven by an increase in non-cash payments and not
a decrease in cash payments.
3
• The share of in-person purchases and person-to-person (P2P) payments
remained steady since 2020 at 81 percent.
4
• On-person cash holdings increased by $5 from 2021, averaging $73.
1
Interest rates rose due to inflation at approximately eight percent in October 2022.
2
On-person holdings refer to cash held in one’s pocket or wallet to be used for purchases, while store-of-
value holdings refer to cash held in one’s home not for immediate use on purchases.
3
This decrease in the share of cash use was partly due to the increased number of reported payments
after a reminder prompt was added to the second and third day of the Diary asking participants if they forgot
to report any payments the previous day. This addition to the instrument was based on findings from
interviews in 2022 which demonstrated that consumers were forgetting to report some of their payments.
To make the Diary instrument more robust and capture these forgotten payments, questions were added
to prompt consumers to enter any of their forgotten payments from the previous days. This additional
reminder prompt resulted in an increase of approximately four monthly payments between 2021 to 2022.
4
Purchases and P2P payments exclude bill payments such as rent, utilities, and credit card bills.
• Average store-of-value holdings remained elevated compared to pre-pandemic
holdings and increased slightly to $418.
The consistency across these cash data points since start of the pandemic revealed
what may be a new normal level of cash payments and holdings.

Trends in Payment
Consumers increased credit card use as cash use remained consistent
Through the 2022 survey, we found that some of the major payment trends that started
early in Covid-19 public health emergency have continued into the pandemic’s later
stages.
5
Notably, consumers have continued to use credit cards more often and credit
cards were the most used payment method in 2022. By contrast, consumers use of debit
cards and cash in 2022 remained consistent with 2020 levels. This is a significant change
from the pre-pandemic period when consumers made a greater share of payments with
both cash and debit card. This shift toward credit card use is correlated with shifts in
consumer preferences, which will be discussed in more detail later in this paper. Cash
use remained the third most popular payment choice and accounted for 18 percent of all
payments in 2022. Another key takeaway from 2022 payment trends was the leveling-off
of mobile app payments. Although consumers rapidly shifted toward online and remote
payments in 2020, the average number of mobile app payments has not increased since
that time, indicating that consumer use of mobile payment apps may have reached a peak
earlier in the pandemic (Figure 1).
6,7
5
The coronavirus national emergency was first declared in March 2020 and declared as officially ended on
May 11, 2023.
6
The category ‘other’ includes payments made with pre-paid, checks, mobile payment apps, money orders.
7
In 2022, the Diary survey instrument was modified to include a forgotten payments screen to allow
participants to log possibly forgotten payments from the prior Diary day.
31%
31%
26%
26%
19%
20%
18%
18%
22%
23%
24%
27%
28%
31%
27%
27%
28%
30%
28%
29%
29%
10%
10%
11%
11%
12%
12%
13%
13%
11%
11%
9%
11%
10%
9%
0% 20% 40% 60% 80% 100%
2016
2017
2018
2019
2020
2021
2022
Figure 1: Share of payment instrument use for all payments
Cash Credit Debit ACH Mobile Payment App Other

Although cash use remained lower than pre-pandemic levels, the consistent number of
cash payments in the past two years following a steep decline between 2019 and 2020
suggests there may be a current floor to cash use. During the pandemic, opportunities to
use alternatives to cash increased dramatically.
8
These conditions greatly affected
consumer use of cash as opportunities to pay online reached an all-time high
Nonetheless, cash accounted for 20 percent of all consumer payments in 2020. This
enduring demand indicates that there are consumers who needed or wanted to use cash
throughout the pandemic. If these consumers did not shift away from using cash amidst
the conditions of the early pandemic, it is less likely that they will shift their payment
behavior in the future; barring another major event occurring. Consumer payment
preferences tend to be sticky, so the stabilization of cash payments since 2020 suggests
an underlying and consistent level of demand for cash.
9
Factors Affecting Consumer Cash Payments
The following factors, which are expanded upon in the sections below, affected consumer
cash use early in the pandemic and remained present in 2022:
• Consumers continued to make more purchases online than they did before the
pandemic. This shift away from in-person payments has resulted in fewer
opportunities to use cash.
• Fewer consumers reported that they preferred cash when making in-person
payments.
• The number of in-person payments at retailers where consumers make most
payments returned to pre-pandemic levels; however, cash payments at these
retailers did not.
• The change in consumer shopping habits resulted in fewer payments of less than
$25 compared to 2019. Historically, cash has been used more often for such
payments.
Share of online purchases remained elevated compared to pre-pandemic
In 2022, consumers continued to make a greater share of purchases remotely when
compared to before the pandemic in 2019. Consistent with 2020 and 2021, consumers
made approximately one of every five purchases and person-to-person (P2P) payments
remotely or online. Prior to the pandemic, in 2019, consumers made 13% of payments
8
The shift to other cash options was driven by pandemic conditions such as social distancing, work from
home accommodations, uncertainty in how the virus spread, and shelter-in-place orders.
9
The current floor to cash is conditional on the current state of payment technology and adoption rate. In
addition, this floor does not account for another major or extreme event occurring.

remotely (Figure 2). With consumers making more online payments, opportunities to pay
with cash decreased beginning in 2020 and remained below 2019 levels in 2022.
However, as the share of payments in-person stabilized since 2020, opportunities to
make cash payments remained steady in 2022.
Increased card preference since 2020 reduced the probability of cash use
Like the stabilization of the share of in-person purchases and P2P payments, the share
of people preferring cash for in-person payments in 2022 remained stable but below pre-
pandemic levels (Figure 3). Since 2016, consumers preference for cash has declined
while their preference for credit cards has increased. Consumers prefer credit cards
because of the perceived convenience, lower rates of cash acceptance, and the ease of
record keeping as compared to cash. According to the 2022 survey, over 90 percent of
respondents agreed that credit and debit cards are usually accepted for making payments
while only 82 percent said that cash was accepted. The largest gap revealed by the
survey concerned cash and record keeping. Only 18 percent of survey respondents felt
that cash was a good record of payment. By comparison, 50 percent of respondents cited
credit and debit cards for their ease of record keeping.
While there are characteristics of cards that consumers prefer over those of cash,
consumers previously identified cash as the least costly payment instrument.
10
While
there are less up-front costs to get or use cash, studies on the cost of using cash as
compared to cards suggest that the cost of using credit cards is decreasing as consumers
receive cashback rewards.
11
Of the 82 percent of consumers that indicated they have at
least one credit card in 2022, approximately 92 percent indicated that the credit card gives
10
See Table 14 from the 2020 Survey of Consumer Payment Choice
11
See Shy and Stavins (2021) and Schuh, Shy, and Stavins (2010)
92%
90%
88%
87%
80%
82%
81%
8%
10%
12%
13%
20%
18%
19%
0%
20%
40%
60%
80%
100%
2016 2017 2018 2019 2020 2021 2022
Figure 2: Percent of purchases and P2P payments made
in-person versus online
In-Person Purchases and P2P Online and Remote Purchases and P2P

rewards. Such rewards may play an additional role in the shift toward credit cards
specifically, as compared to debit cards or cash.
The shift away from cash and towards credit cards that started at the beginning of the
pandemic appears durable. It is based on consumers evaluation of the relative
convenience, acceptability, and cost associated with different payment instruments.
Despite this shift in preference towards credit cards and decreased preference for cash
and debit cards compared to the pre-pandemic period, a fundamental level of demand for
cash for in-person payments remained. Even for those that preferred credit and debit
cards in 2022, cash continued to be the second-most used instrument and accounted for
approximately 20 percent of in-person purchases made by consumers who prefer cards
(Figure 4). This suggests that cash remains an important back-up payment instrument for
instances when cards are not available or when cash is more convenient to use, such as
with for payments under $25, which will be discussed in more detail later in this paper.
27%
24%
42%
22%
29%
42%
18%
33%
43%
19%
35%
38%
0%
10%
20%
30%
40%
50%
Cash Credit Debit
Figure 3: Stated payment preference for in-person
payments
2016 2017 2018 2019 2020 2021 2022

In-person payments increase as cash remained stable at select merchants
Overall in 2022 and in line with the trend that started in 2020, consumers made fewer in-
person payments. However, at certain merchant locations, the opposite was true and
consumers increased their in-person payments as compared to 2020.
12
These merchants
included grocery and convenience stores, restaurants, gas stations and general
merchandise stores (Figure 5).
The increase in in-person payments at these locations did not, however, result in an
increase in consumers use of cash. Instead, consumers used credit cards more
frequently. The shift away from cash use at these locations since 2020 suggests the
pandemic provided the conditions for many consumers to change their payment behavior.
While substitution away from cash took place during the beginning of the pandemic at
these merchant locations, the number of cash payments has not decreased since the
start of the pandemic.
12
Additional payments reported by participants in the reminder section of the Diary were included in the
analysis. The most significant changes in the number of total payments reported when payments from the
reminder section were included was an increase of 0.4 payments grocery and convenience stores and 0.3
payments at gas stations.
58%
19%
21%
14%
68%
8%
20%
6%
65%
8%
7%
6%
0% 20% 40% 60% 80% 100%
Prefer Cash
Prefer Credit
Prefer Debit
Figure 4: Share of in-person payments by payment
preference
Cash Use Credit Card Use Debit Card Use Other

Small-value cash payments increased slightly from 2021
Historically, cash has been the most used payment instrument for small-value payments,
so an increased number of small-value payments usually corresponds with increased
cash use.
13,14
In 2022, the number of small-value payments remained below pre-
pandemic levels, however, there was a stabilization in the number of these small-value
payments since 2020 and cash was the most used instrument for payments under $25
(Figure 6). Compared to other payment instruments, the average value of cash payments
in 2022 remained below that of credit and debit card payments. Consumers made large
value purchases with credit cards, averaging about $95 per transaction, while they made
smaller value purchases with cash, averaging $39 per transaction.
13
Small-value payments are payments under $25.
14
The only exception to cash being the most used payment instrument for small-value payments was
2020, when consumers reported to make equal numbers of debit and cash in-person payments.
2.1
1.3
1.3
1.3
2.0
1.1
1.3
1.3
1.0
0.7
0.7
0.7
1.2
0.7
0.7
0.8
0.8
0.4
0.6
0.6
4.7
4.5
4.8
5.5
3.2
2.9
3.0
3.4
3.1
2.9
2.8
3.1
2.5
2.1
2.3
2.6
1.8
1.0
1.5
2.0
6.8
5.7
6.1
6.8
5.2
4.0
4.3
4.7
4.1
3.6
3.5
3.8
3.7
2.8
3.0
3.5
2.6
1.4
2.1
2.6
0.0
1.0
2.0
3.0
4.0
5.0
6.0
7.0
8.0
2019 2020 2021 2022 2019 2020 2021 2022 2019 2020 2021 2022 2019 2020 2021 2022 2019 2020 2021 2022
Grocery and
convenience stores
Fast food and coffee
shops
General Merchandise
and Department Stores
Gas stations Sit-down restaurants
and bars
Average Number of Monthly Payments
Figure 5: Average number of monthly cash and non-cash
payments by merchant type
Cash Non-Cash
Cash Use by Demographics
Cash use remained below pre-pandemic levels for all age groups
Since the start of the pandemic, consumers’ cash use has become more strongly
correlated with age. Older consumers are more likely to use cash than younger
consumers, who are more likely to use debit cards (Figure 7).
15
This was not the case
prior to the pandemic when individuals aged 18 to 24 used cash at a similar rate as those
55 and older (Figure 8). The impact of the pandemic on 18- to 24-year-olds’ cash use was
the largest of any age cohort; these consumers’ cash use fell 20 percentage points
between 2019 and 2022. Over the same period, 35- to-44-year-olds and 45- to-54-year-
olds decreased their share of cash use by seven and 11 percentage points, respectively.
The difference in cash use by age cohort is not directly correlated with differences in
shopping behavior, as the share of payments made at different merchant types did not
differ significantly between groups. However, consumers aged 35 and over made a
greater share of their payments at grocery stores, department stores, and utilities than
18-to 24-year-olds. 18- to 24-year-olds made a greater share of payments at fast food
places, public transportation locations, and at school and colleges (Figures not shown).
Regardless of age, the share of cash use has declined while the share of credit and debit
card use has increased since the start of the pandemic.
15
The only exception was in 2020. Consumers made an equal number of debit and cash small-value
payments.
11
9
9
8
4
5
5
3
3
4
4
3
3
4
6
5
5
5
4
4
4
21
18
18
16
11
12
13
0
5
10
15
20
25
2016 2017 2018 2019 2020 2021 2022
Figure 6: Average number of in-person payments per
month under $25
Cash Credit Debit Total

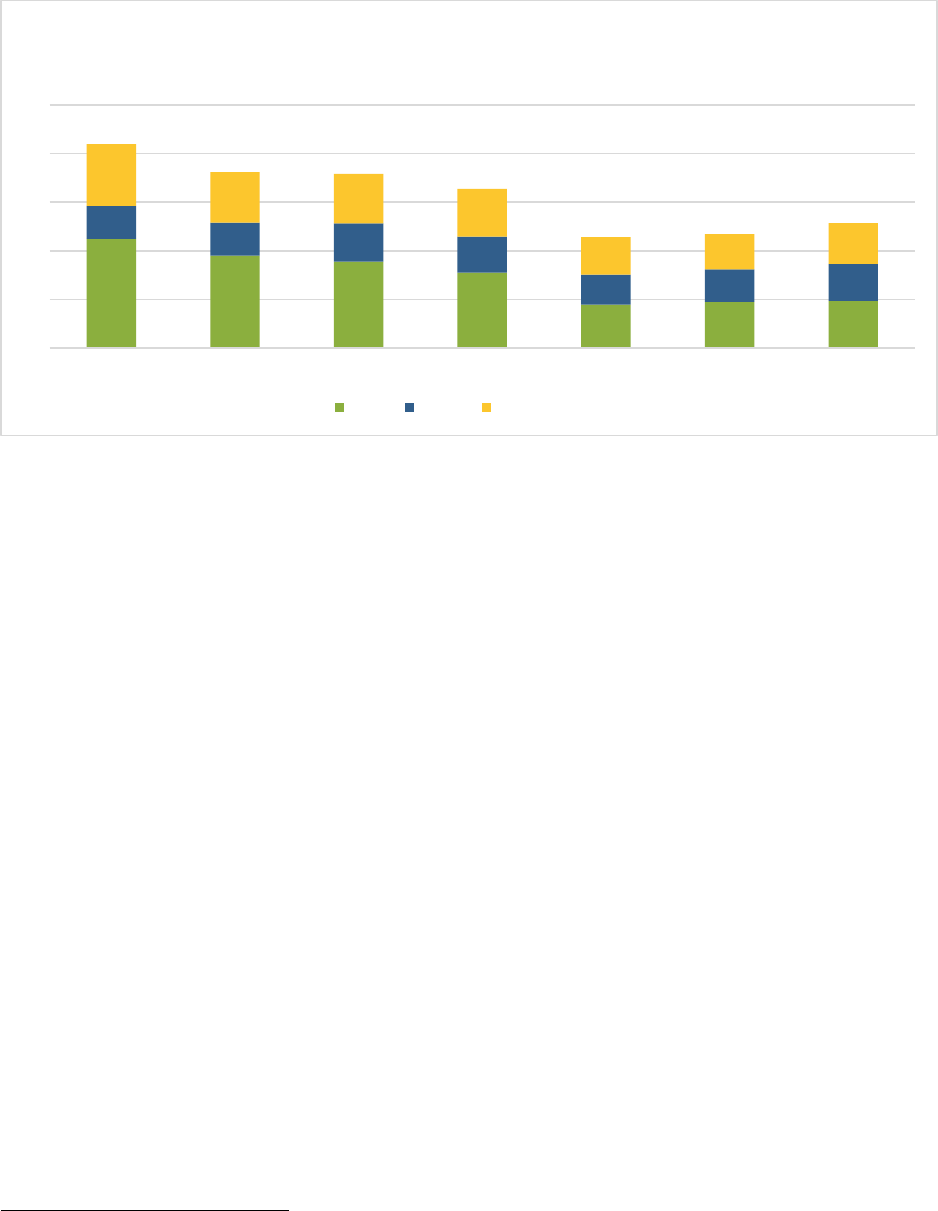
Cash was the most used payment for the lowest income households
There are also significant differences in how consumers from lower income and higher
income households make payments. These trends, which pre-date the pandemic,
continued to hold in 2022 (Figure 9). On average, those in households making less than
$25,000 per year used cash at a rate over three times greater (36 percent) than those
from households making more than $150,000 (10 percent). The opposite is true with the
share of credit card use: those in households making more than $150,000 used credit
cards at a rate four times greater (50 percent) than those in households making less than
$25,000 (12 percent). While the pandemic accelerated the shift away from cash for all
13%
12%
13%
16%
23%
23%
31%
36%
32%
32%
25%
30%
39%
33%
35%
32%
29%
20%
10%
12%
11%
12%
15%
15%
6%
6%
8%
7%
7%
12%
0%
20%
40%
60%
80%
100%
18 to 24 25 to 34 35 to 44 45 to 54 55 to 64 65 and Older
Figure 7: Share of payment instrument use by age
Cash Credit Debit ACH Mobile Payment App Other
32%
24%
32%
33%
34%
33%
33%
18%
20%
25%
32%
33%
13%
12%
13%
16%
23%
23%
0%
5%
10%
15%
20%
25%
30%
35%
40%
18 to 24 25 to 34 35 to 44 45 to 54 55 to 64 65 and
Older
Figure 8: Shares of cash use by age group
2016 2017 2018 2019 2020 2021 2022

household income groups, cash remained an important payment instrument for lower
income households.
The importance of cash for individuals in lower income households becomes even more
pronounced when examining payment instrument use for bill payments (Figure 10).
People living in households making less than $25,000, used cash for approximately 16
percent of all bill payments, the same share as checks. Cash use for consumers making
less than $25,000 a year exceeded the combined cash use for all other household income
groups making more than $75,000 (Figure 9). This highlights that the access and use of
the full suite of payment choices is not always available to all members of the U.S.
population.
36%
23%
19%
15%
15%
10%
11%
20%
23%
31%
37%
50%
30%
39%
37%
32%
28%
18%
9%
10%
13%
16%
14%
14%
8%
6%
6%
4%
4%
5%
0% 20% 40% 60% 80% 100%
Less than $25,000
$25,000 – $49,999
$50,000 – $74,999
$75,000 – $99,999
$100,000 – $149,999
Greater than $150,000
Figure 9: Share of payment instrument use by household
income
Cash Credit Debit Pre-Paid ACH Mobile Payment App Other
16%
6%
5%
9%
7%
9%
12%
15%
24%
20%
35%
21%
15%
12%
6%
34%
36%
48%
58%
61%
60%
16%
14%
15%
10%
7%
8%
0% 10% 20% 30% 40% 50% 60% 70% 80% 90% 100%
Less than $25,000
$25,000 – $49,999
$50,000 – $74,999
$75,000 – $99,999
$100,000 – $149,999
Greater than $150,000
Figure 10: Share of payment use for bill payments by
household income
Cash Credit Debit ACH Mobile Payment App Check Other

Cash is crucial for consumers who do not use traditional banking services
There is a strong relationship between cash use and being unbanked. In turn, those who
are unbanked tend to live in low-income households. More than 90 percent of the
unbanked population live in households making less than $75,000.
16
Approximately 24
percent of people living in households making less than $25,000 are unbanked. This lack
of access to traditional banking limits the available payment options for these individuals
and results in a higher share of cash use when compared to those who use traditional
banking services.
One key difference between consumers that have a bank account and those who do not
has been divergent trends in the share of cash use since the pandemic began (Figure
11). In 2019, consumers that have a bank account used cash for approximately 25
percent of their payments, which decreased to 17 percent in 2022. By comparison,
consumers that do not have bank accounts increased their share of cash use since 2019;
they made 66 percent of all payments with cash in 2022. These diverging trends illustrate
how cash remains a vital payment method for specific groups of consumers. While cash
use decreased for those that use banking services, the consistency in the share of cash
use for unbanked consumers supports the notion that cash is sticky for wide portions of
16
Includes individuals who report not have either a checking account or a savings account. Within this
year’s Diary study, approximately 5.7 percent of the sample were unbanked, a share slightly higher than
the most recent FDIC study of the U.S. unbanked population.
55%
58%
73%
66%
25%
18%
18%
17%
45%
42%
27%
34%
75%
82%
82%
83%
0%
20%
40%
60%
80%
100%
2019 2020 2021 2022 2019 2020 2021 2022
Consumers without a bank account Consumers with a bank account
Figure 11: Cash Use by banking status
Cash Non-Cash

the population, not only those that do not have access to bank accounts or from lower
income households.
Trends in Cash Holdings
While the average number of cash payments remained below pre-pandemic levels,
aggregate demand for cash continued to increase. As of October 2022, the value of
currency in circulation passed $2.23 trillion, a 28 percent increase compared to February
2020,
17
but with slower growth since 2021.
18,19
The Diary studies since 2020 show a
significant factor for this increased demand is consumer cash holdings, both on-person
(cash in one’s pocket, purse, or wallet) and store-of-value holdings (cash held in one’s
home, car, or elsewhere). Both measures remained elevated compared to pre-pandemic
levels and emphasized that demand for cash increases during times of uncertainty.
Average on-person holdings remain elevated compared to pre-pandemic
Compared to 2019, people were still holding on to more cash in 2022. On average, each
consumer held approximately $73 in cash and used this cash for purchases (Figure 12).
This increase in holdings was observed across all age groups, although the extent of the
increase varied. The age group with the greatest increase in both the amount and
proportion of cash holdings was 18-to-24-year-olds. Despite the increase in cash
holdings, those aged 18-to-24 reduced their cash use by 20 percentage points bringing
them closer in line with adults aged 25 to 54. Whether these increased cash holdings by
18-to-24-year-olds will result in greater cash use in the future remains uncertain.
17
The growth in CIC in 2020 exceeded that in pre-pandemic as heightened financial or political uncertainty
can prompt investors, businesses, and households to move rapidly toward cash which drives rapid growth
in currency.
18
Currency in Circulation (CURRCIR) | FRED | St. Louis Fed (stlouisfed.org)
19
Based on estimates by Judson (2017), approximately half of the value of currency in circulation is held
overseas. The increase in cash demand starting in March 2020 was due to increased payments to financial
institutions in the domestic market based on Federal Reserve payment and receipt data.

While the value of on-person holdings has fluctuated since 2020, the share of consumers
that held cash during the 2022 survey period remained steady at 79 percent (Figure 13).
20
Between 2016 and 2018, the share of people holding cash was decreasing annually.
However, since 2018 that trend has remained within a two percentage-point range. The
significant level of adults who routinely hold cash combined with elevated holdings since
the pandemic indicate that cash remains in demand, even if some individuals hold cash
only for contingency purposes and as a backup payment option.
20
Participants were carrying cash at least one day if they reported holding cash in their pocket, purse, or
wallet if a non-zero amount of cash was reported at the beginning or end of any assigned diary-day.
$25
$38
$50
$55
$74
$95
$57
$60
$39
$45
$61
$81
$110
$76
$46
$41
$52
$60
$99
$106
$73
$0
$20
$40
$60
$80
$100
$120
$140
18 to 24 25 to 34 35 to 44 45 to 54 55 to 64 65 and
Older
Average
Figure 12: Average daily holdings by age
2016 2017 2018 2019 2020 2021 2022
84%
83%
80%
80%
78%
79%
79%
0%
20%
40%
60%
80%
100%
2016 2017 2018 2019 2020 2021 2022
Figure 13: Share of adults holding on-person cash at
least one day

Store-of-value cash holdings increased and remain elevated
Just as with on-person holdings, consumers also maintained elevated store-of-value cash
holdings in 2022. This suggests that consumers continued to hold a significant amount of
cash that may be unlikely to be used for daily purchases. This may be due in part to
lingering uncertainty surrounding the pandemic or a shift in holdings behavior because of
the pandemic (Figure 14).
21
Although store-of-value holdings increased year-over-year,
the rate of increase between 2021 to 2022 slowed and grew at a similar rate to holdings
between 2016 and 2019. This slower growth of holdings took place as the growth of the
value of currency in circulation also slowed, returning to pre-pandemic growth rates.
Most consumers expected to continue using cash
To attain a better understanding of how consumers think about their future cash use,
Diary participants in 2022 were asked whether they expected to stop using cash in the
future and, if so, when they expected this change to occur (Figure 15). The survey results
showed 93 percent of consumers have no plans to stop using cash. Of the remaining
participants, four percent have stopped using cash all together, while approximately three
percent expect that they will stop using cash within the next five years. In addition, when
asked if a completely cashless society would be problematic, only 30 percent of
consumers answered ‘no’ while the remainder of consumers believed it would be
problematic or were uncertain if it would be problematic.
21
2021 store of value holdings were revised up to $408 from $347. This was due to a change in
methodology in which the top 0.1 percent of store of value holdings are no longer truncated. The change in
FedCash services methodology was due to a decreased in the number of outlier observations that
significantly shifted the average value of holdings.
$173
$199
$198
$241
$299
$408
$418
$1,000
$1,250
$1,500
$1,750
$2,000
$2,250
$2,500
$0
$50
$100
$150
$200
$250
$300
$350
$400
$450
2016 2017 2018 2019 2020 2021 2022
Value of Currency in
Circulation
(Billions of Dollars)
Average Store of
Value Holdings
Figure 14: Average store-of-value holdings

These results showed most consumers expect to demand cash in the future. Insight into
consumer expectations also helps explain why so many people report carrying cash
during the Diary, despite decreased cash use and underscores why cash remains the
third most popular payment instrument. The characteristics of cash that make it valuable
to consumers include its instant settlement between individuals and retailers without the
need for a third party, and its availability and wide acceptance during times of uncertainty.
These characteristics are not expected to change in the future, and unless a new payment
option replicates these characteristics, some level of cash demand is likely to continue.
Conclusion
The consistency of many data points between 2020 and 2022 shown in this year’s Diary
suggest that consumer payment behavior is stabilizing in the latter part of the pandemic.
Recent trends also suggest that the shift away from cash and towards credit cards that
started at the beginning of the pandemic has become a persistent trend. At the same
time, the increased popularity of credit cards has not decreased the demand for cash.
Demand remained stable at the current level. Finally, the 2022 Diary underscores the
continued attractiveness of cash as a payment instrument as well as a store of value in
times of uncertainty and stress.
An especially important takeaway from the 2022 Diary results is that most consumers do
not expect to stop using cash in the near future. In addition, approximately one in five
consumers reported cash as their preferred payment instrument for in-person purchases,
indicating a persistent demand for cash for in-person payments despite online payments
93%
4%
2%
1%
0%
0% 20% 40% 60% 80% 100%
No, I do not have any plans to stop using cash
Yes, I have already stopped using cash
Yes, in the next 2 years
Yes, 2 to 5 years from now
Yes, more than 5 years from now
Figure 15: Do you currently have any plans to stop using
cash in future?
remaining elevated compared to pre-pandemic. While some consumers may choose to
stop using cash at some point in the future, the underlying cash demand suggested by
these results emphasize the importance of continued investment across the various
participants of the supply chain to ensure cash access for those consumers who need or
prefer to use it.
Appendix
About the Diary of Consumer Payment Choice
The Federal Reserve has conducted the Diary annually since 2016 to better understand
consumer payment habits. Respondents to this nationally representative survey of U.S.
consumers report all payments they make during an assigned three-day period in
October. By tracking consumer payment transactions and preferences annually during
the month of October, Federal Reserve Financial Services compares cash with other
payment instruments, such as debit and credit cards, checks, and electronic options.
Diary participants also report the amount of cash on hand after each survey day, cash
stored elsewhere, and cash deposits or withdrawals. The Diary data is then analyzed,
including the impact of age and income on an individual’s payment behavior and
preferences. This detail of the stock and flow of cash at an individual level provides insight
into how consumers use cash.
Developed by the Federal Reserve Bank of Boston’s Consumer Payment Research
Center (CPRC) and currently managed by the Research Department at the Federal
Reserve Bank of Atlanta, the Diary collects data about shopping and payments behavior
from a unique, nationally representative survey of consumers administered by the
University of Southern California (USC) Dornsife Center for Economic and Social
Research. USC’s Understanding America Study panel of households comprises
approximately 9,000 respondents from across the United States, 4,453 of which
completed the 2022 Diary.
To ensure a nationally representative sample, responses are weighted to match national
population estimates based on the Census Bureau’s Current Population Survey. The
Diary is administered throughout the month of October, which was selected to minimize
seasonality effects in consumer spending patterns. Participants were each assigned a
three-day period within the month, with some individuals assigned a starting date in late
September and others assigned to finish in early November. For a more detailed
description of the Diary of Consumer Payment Choice, see Angrisani, Foster, and
Hitczenko (2017b); Angrisani, Foster, and Hitczenko (2018); Greene, Schuh, and Stavins

(2018); Greene and Schuh (2017); Greene, O’Brien, and Schuh (2017); and Schuh
(2017).
About Federal Reserve Financial Services
Federal Reserve Financial Services is an integrated organization within the Federal
Reserve that is responsible for managing critical payment and securities services that
foster the accessibility, integrity, and efficiency of the U.S. economy. Through its
relationships with about 10,000 financial institutions nationwide, the Federal Reserve
provides equitable access to a system that facilitates more than $5 trillion payments each
day. Federal Reserve Financial Services, delivered via a secure FedLine
®
network,
include FedCash
®
Services, FedACH
®
Services, Check Services, Fedwire
®
Funds and
Securities Services, the National Settlement Service and more. The Federal Reserve also
collaborates broadly with payments stakeholders on improvement initiatives (Off-site), to
advance the end-to-end speed, security, efficiency of domestic and cross-border
payments. This collaboration led to and has informed development of the upcoming
FedNow
SM
Service, an instant payments infrastructure launching in 2023 that will become
part of the FRFS product offering.
About FedCash® Services
As the nation’s central bank, the Federal Reserve ensures that cash is available when
and where it is needed, including in times of crisis and business disruption, by providing
FedCash Services to depository institutions and, through them, to the general public. In
fulfilling this role, the Federal Reserve’s primary responsibility is to maintain public
confidence in the integrity and availability of U.S. currency.
FedCash Services provides strategic leadership for this key function by formulating and
implementing service level policies, operational guidance, and technology strategies for
U.S. currency and coin services provided by Federal Reserve Banks nationally and
internationally. In addition to guiding policies and procedures, FedCash Services
establishes budget guidance, provides national direction for Federal Reserve currency
and coin distribution and inventory management, and supports business continuity
planning at the supply chain level. It also conducts market research and works with
financial institutions and retailers to analyze trends in cash usage.
The Diary studies provide vital insights into how consumer payments may be changing
from one year to the next. Federal Reserve Financial Services uses these insights to
understand consumer cash use and anticipate its ongoing role in the payments
landscape. This ensures FedCash Services are fulfilling the mission of meeting demand

in times of normalcy and stress, maintaining the public’s confidence in U.S. currency, and
providing ready access to cash. Understanding the evolving role of cash in the economy
is critical to fulfilling that mission.
References
Angrisani, Marco, Kevin Foster, and Marcin Hitczenko. 2017b. “The 2012 Diary of
Consumer Payment Choice: Technical Appendix.” Federal Reserve Bank of Boston
Research Data Reports No. 17-5. Available at https://www.frbatlanta.org/banking-and-
payments/consumer-payments/research-data-reports/2017/the-2012-diary-of-
consumer-payment-choice-technical-appendix.aspx?panel=1.
Angrisani, Marco, Kevin Foster, and Marcin Hitczenko. 2018. “The 2015 and 2016
Diaries of Consumer Payment Choice: Technical Appendix” Federal Reserve Bank of
Boston Research Data Reports No. 18-2. Available at
https://www.frbatlanta.org/banking-and-payments/consumer-payments/research-data-
reports/2018/the-2015-and-2016-diaries-of-consumer-payment-choice-technical-
appendix.aspx?panel=1.
Coyle, Kelsey, Laura Kim, and Shaun O’Brien. 2021. “2021 Findings from the Diary of
Consumer Payment Choice.” Cash Product Office, Federal Reserve System, May.
Available at https://www.frbsf.org/cash/publications/fed-notes/2021/may/2021-findings-
from-the-diary-of-consumer-payment-choice/
Coyle, Kelsey, Laura Kim. and Shaun O’Brien. 2021. “Consumer Payments and the
COVID-19 Pandemic: The Second Supplement to the 2020 Findings from the Diary of
Consumer Payment Choice.” Cash Product Office, Federal Reserve System, July.
Available at https://www.frbsf.org/cash/publications/fed-notes/2021/february/consumer-
payments-covid-19-pandemic-2020-diary-consumer-payment-choice-supplement-2/
Cubides, Emily, and Shaun O’Brien. 2022. “2022 Findings from the Diary of Consumer
Payment Choice.” FedCash Services, Federal Reserve System, May. Available at
https://www.frbsf.org/cash/publications/fed-notes/2022/may/2022-findings-from-the-
diary-of-consumer-payment-choice/
Foster, Kevin and Claire Greene. 2021. “Consumer Behavior in a Health Crisis: What
Happened with Cash?” Policy Hub, 1, pp.17-39. Available at
https://www.frbatlanta.org/research/publications/policy-hub/2021/01/12/01-consumer-
behavior-in-health-crisis-what-happened-with-cash
Greene, Claire, and Scott D. Schuh. 2017. “The 2016 Diary of Consumer Payment
Choice.” Federal Reserve Bank of Boston Research Data Reports No. 17-7. Available
at https://www.frbatlanta.org/banking-and-payments/consumer-payments/research-
data-reports/2017/the-2016-diary-of-consumer-payment-choice.aspx?panel=1

Greene, Claire, Shaun O’Brien, and Scott Schuh. 2017. “U.S. Consumer Cash Use,
2012–2015: An Introduction to the Diary of Consumer Payment Choice.” Federal
Reserve Bank of Boston Research Data Reports No. 17-6. Available at
https://www.frbatlanta.org/banking-and-payments/consumer-payments/research-data-
reports/2017/us-consumer-cash-use-2012-and-2015.aspx?panel=1.
Greene, Claire, Scott D. Schuh, and Joanna Stavins. 2018. “The 2012 Diary of
Consumer Payment Choice: Summary Results.” Federal Reserve Bank of Boston
Research Data Reports No. 18-1. Available at https://www.frbatlanta.org/banking-and-
payments/consumer-payments/research-data-reports/2018/the-2012-diary-of-
consumer-payment-choice.aspx?panel=1
Judson, R., 2017. “The Death of Cash? Not So Fast: Demand for US Currency at Home
and Abroad, 1990-2016.” In International Cash Conference 2017–War on Cash: Is there
a Future for Cash? (No. 162910). Deutsche Bundesbank. Available at
https://www.bundesbank.de/resource/blob/710118/6bab368611007785b02fbb008f368cf
7/mL/war-on-cash-data.pdf
Kim, Laura, Raynil Kumar, and Shaun O’Brien. 2020. “2020 Findings from the Diary of
Consumer Payment Choice.” Cash Product Office, Federal Reserve System, July.
Available at https://www.frbsf.org/cash/publications/fed-notes/2020/july/2020-findings-
from-the-diary-of-consumer-payment-choice/
O’Brien, Shaun. 2021. “Consumer Payments and the COVID-19 Pandemic: Findings
from the April 2021 Supplemental Survey.” Cash Product Office, Federal Reserve
System, September. Available at https://www.frbsf.org/cash/publications/fed-
notes/2021/september/consumer-payments-covid-19-pandemic-diary-consumer-
payment-choice-supplement-3/
Schuh, Scott. 2017. “Measuring Consumer Expenditures with Payment Diaries.” Federal
Reserve Bank of Boston Research Department Working Papers No. 17-2. Available at
https://www.bostonfed.org/publications/research-department-working-
paper/2017/measuring-consumer-expenditures-with-payment-diaries.aspx
Schuh, Scott, Oz Shy, and Joanna Stavins. “Who Gains and Who Loses from Credit Card
Payments? Theory and Calibrations.” Federal Reserve Bank of Boston Research
Department Public Policy Discussion Papers No. 10-3. Available at
https://www.bostonfed.org/publications/public-policy-discussion-paper/2010/who-gains-
and-who-loses-from-credit-card-payments-theory-and-calibrations.aspx
Shy, O. and Stavins, J., 2022. “Who Is Paying All These Fees? An Empirical Analysis of
Bank Account and Credit Card Fees.” Federal Reserve Bank of Boston Research
Department Working Papers No. 22-18. Available at

https://www.bostonfed.org/publications/research-department-working-paper/2022/who-
is-paying-all-these-fees-an-empirical-analysis-of-bank-account-and-credit-card-
fees.aspx
The financial services logo and “FedCash” are registered service marks of the Federal Reserve Banks. A list of marks related to
financial services products that are offered to financial institutions by the Federal Reserve Banks is available at www.FRBservices.org.
