
NOAA Technical Memorandum NMFS-AFSC-9
U.S. DEPARTMENT OF COMMERCE
National Oceanic and Atmospheric Administration
National Marine Fisheries Service
Alaska Fisheries Science Center
January 1993
Hydrocarbons in Intertidal Sediments
and Mussels from Prince William
Sound, Alaska, 1977-1980:
Characterization and Probable Sources
by
John F. Karinen, Malin M. Babcock, Donald W. Brown,
William D. MacLeod, Jr., L. Scott Ramos, and Jeffrey W. Short
NOAA Technical Memorandum NMFS
The National Marine Fisheries Service's Alaska Fisheries Science Center
uses the NOAA Technical Memorandum series to issue informal scientific and
technical publications when complete formal review and editorial processing
are not appropriate or feasible. Documents within this series reflect sound
professional work and may be referenced in the formal scientific and technical
literature.
The NMFS-AFSC Technical Memorandum series of the Alaska Fisheries
Science Center continues the NMFS-F/NWC series established in 1970 by the
Northwest Fisheries Center. The new NMFS-NWFSC series will be used by
the Northwest Fisheries Science Center.
This document should be cited as follows:
Karinen, J. F., M. M. Babcock, D. W. Brown, W. D. Macleod, Jr.,
L. S. Ramos, and J. W. Short. 1993. (revised December 1994).
Hydrocarbons in intertidal sediments and mussels from Prince William
Sound, Alaska, 1977-1980: Characterization and probable sources.
U.S. Dep. Commer., NOAA Tech. Memo. NMFS-AFSC-9, 70 p.
Reference in this document to trade names does not imply endorsement by
the National Marine Fisheries Service, NOAA.

NOAA Technical Memorandum NMFS-AFSC-9
Hydrocarbons in intertidal Sediments
and Mussels from Prince William Sound,
Alaska, 1977-1980: Characterization
and Probable Sources
John F. Karinen
1
, Malin M. Babcock
1
, Donald W. Brown
2
,
William
D. MacLeod, Jr.
2
, L. Scott Ramos
2
, and Jeffrey W. Short
1
*
1
Alaska Fisheries Science Center
Auke Bay Laboratory
11305 Glacier Highway
Juneau, Alaska 99801-8626
2
Northwest Fisheries Science Center
Environmental Conservation Division
2725 Montlake Boulevard East
Seattle, WA 98112-2097
U.S.
DEPARTMENT
OF COMMERCE
Barbara Hackman Franklin, Secretary
National Oceanic and Atmospheric Administration
John A. Knauss, Administrator
National Marine Fisheries Service
William W. Fox, Jr., Assistant Administrator for Fisheries
January 1993
This
document is available to the public through:
National Technical Information Service
U.S. Department of Commerce
5285 Port Royal Road
Springfield, VA 22161
Notice to Users of this Document
This document is being made available in .PDF format for the convenience of users; however, the
accuracy and correctness of the document can only be certified as was presented in the original hard
copy format.

iii
We collected and analyzed samples of sediments and mussels
(Mytilus trossulus) for alkane and aromatic hydrocarbons from
eight sampling stations adjacent to the oil tanker vessel
transportation corridor through Prince William Sound, Alaska,
during the period from 1977 to 1980,
to determine baselines prior
to the start of oil tanker movement through the Sound. We‘
evaluated interannual variability of these analytes using a two-
factor analysis of variance of logarithm-transformed hydrocarbon
concentrations determined in duplicate samples collected in June
1977 and in June 1978 at six of the stations.
Intra-annual
variability was evaluated using analyses of duplicate samples
collected in May,
June, and August 1978 at seven of the stations.
In addition, total organic carbon and grain size distribution was
determined in the sediment samples, the lipid content was
determined in the mussel samples, and the surface seawater
temperature and salinity was determined for each sampling
station.
The hydrocarbon analyses indicated chronic, low-level
hydrocarbon contamination that probably originates from small
fuel spills,
ballast water discharges, and fuel-combustion
exhaust emissions of occasional vessel activity adjacent to three
of the sampling stations: Constantine Harbor, Rocky Bay, and
Mineral Flats, in decreasing order of contamination,
respectively.
Sediments at these three stations were
contaminated by aromatic hydrocarbons found at concentrations
that were generally less than 10 ng/g dry sediment weight, but
above detectable limits (< 1.0 ng/g).
In contrast, the remaining
five stations showed no indication of petroleum hydrocarbon
contamination, primarily because detected aromatic hydrocarbons
were present only sporadically and at concentrations that were
generally near detection limits.
Both perylene,
which was found
at concentrations well above detection limits at all stations
outside Port Valdez, and phenanthrene, which was also found
sporadically at all sampling stations may have natural sources.
Concentrations of aromatic hydrocarbons were frequently too low
at most of the sampling stations to allow evaluation of intra-
and interannual variability.
Concentrations of individual n-alkanes varied substantially
in sediments and in mussels.
The most abundant n-alkanes in
sediments included normal alkanes with an odd number of carbon
atoms and a molecular weight greater than tetradecane (C-14).
Concentrations of these n-alkanes were generally in the range of
10 to 100 ng/g dry sediment weight and exceeded 1,000 ng/g at
Constantine Harbor.
The most abundant n-alkanes in mussels
included decane (C-10) through heptadecane (C-17), and pristane,
at concentrations generally ranging from 10 to over 1,000 ng/g
dry tissue weight.
iv
Sources of alkanes in sediments included terrigenous plant
waxes,
marine plankton,
and possibly marine macrophytic algae at
all the stations; petroleum-derived alkanes were also found at
Constantine Harbor.
Terrigenous plant waxes in sediments were
indicated by high abundances of odd-numbered carbon n-alkanes of
molecular weight greater than nonadecane (C-19) compared with
even-numbered carbon n-alkanes in these sediments, and by slight
but significant intra-annual variability of these odd-numbered
carbon alkanes in sediments, which probably arose from seasonal
deposition of senescent leaves.
Marine planktonic and algal
sources of pristane and normal alkanes were indicated by the
presence of these alkanes in sediments and in mussels, and by the
relatively high abundances of pristane; pentadecane (C-15), and
heptadecane (C-17) in sediments and in mussels.
The concentrations of pristane, pentadecane (C-15), and
heptadecane (C-17) varied significantly in sediments, in mussels,
or in both, intra-annually or interannually.
Pristane
variability in sediments and in mussels was significantly
correlated and was probably due to variability of populations of
calanoid copepods in Prince William Sound.
Neither pentadecane
variability nor heptadecane variability were correlated in
sediments and mussels,
suggesting multiple biological sources of
these alkanes.
These results indicate that, except in areas affected by
localized vessel traffic,
intertidal sediments and mussels in
Prince William Sound were remarkably free of petroleum-
contaminant hydrocarbons during the period of this study.
The
hydrocarbons found in sediments and mussels unaffected by vessel
traffic can be adequately explained by known, natural sources.
As a result,
sediments and mussels contaminated by crude oil from
the Exxon Valdez oil spill should be particularly apparent due to
the general absence of other confounding sources of petroleum
hydrocarbons.
V
CONTENTS
Introduction
.......................
Materials and Methods
..................
Sampling Stations
.....
.
.............
Sample Collection
...................
Sediment -
Physical Measurements.
...........
Mussel tissue -
Dry-Weight and Lipid Determination.
..
Chemical Analysis
...................
Extraction Procedure.
.................
Fractionation Into Hydrocarbon Classes.
........
Gas Chromatography.
..................
Confirmation of Aromatic Hydrocarbon Analyte Identities
Gas Chromatography/Mass Spectrometry
..
.
...
. . . .
Data Analysis
.................
. . . .
Results
.....................
Intra-annual variation - Sediments.
......
Interannual variation - Sediments
.......
Intra-annual variation - Mussels.
.......
Interannual variation - Mussels
........
Correlation of Alkanes in
Sediments and Mussels
Discussion . . .
. .
. . . .
. . . . . . . . .
. .
Acknowlegments .
. .
. . . .
. . . . . . . . .
. .
Citations . . .
. .
. .
. . . . . .
. . . . . . .
Appendix . . . .
. .
. .
. . . . . .
. . . . . . .
. . . .
. . . .
. . . .
. . . .
. . . .
. . . .
. . . .
. . . .
. . . .
. . . .
1
2
2
5
5
5
5
6
8
8
9
9
10
12
16
16
20
20
28
31
32
35

INTRODUCTION
The oil spill that resulted from the March 1989 grounding of
the oil tanker vessel Exxon Valdez provides a unique opportunity
for the study of marine oil pollution effects because the spilled
crude oil polluted a large geographic area that was previously
considered pristine.
Large-marine oil spills more commonly occur
along well established tanker routes that are already measurably
polluted by oil,
where the effects of a particular oil spill are
confounded with effects of prior spills or of chronic oil
pollution sources.
In contrast, the Exxon Valdez oil spill is
the only large spill along a recently established major oil
tanker route,
so the fate and effects of the spilled oil should
be more clearly discernable.
The only sources of confounding hydrocarbons in the areas of
Prince William Sound, Alaska,
impacted by the spill are naturally
occurring hydrocarbons and anthropogenic hydrocarbons from
occasional boating activity in the Sound or due to long-range
atmospheric transport. Naturally occurring hydrocarbons may
include:
alkane hydrocarbons produced from terrigenous and marine
biological sources such as plant waxes (Kolattukudy 1976;
Eglinton et al.
1962) and phytoplankton (Blumer et al. 1971;
Clark and Blumer 19,67);
polynuclear aromatic hydrocarbons (PAHs)
generated by forest fires (Hites 1981; Farrington et al. 1977;
Youngblood and Blumer 1975) and subsequently precipitated into
the drainage basin of the Sound; perylene produced from
unidentified but probably natural sources (Venkatesan 1988, and
citations therein);
and aliphatic and aromatic hydrocarbons
originating from natural oil seeps.
Anthropogenic hydrocarbons
in the Sound can result from chronic small spills of fossil fuels
associated with boating and shipping directly into seawater, and
from fossil fuel combustion products subsequently precipitated
that originate from boating and shipping, or from distant
industrial centers (Lake et al.
1979; Lunde and Bjorseth 1977).
We sampled intertidal sediments and tissues of mussels
Mytilus trossulus in Prince William Sound during a 4-year, period
beginning in 1977 to establish the levels and variability of
hydrocarbons in these matrixes prior to any large-scale pollution
'events.
The likelihood of such large-scale pollution events
within the Sound increased substantially in, July 1977 with the
large volume of crude oil transported after the opening of the
trans-Alaska oil pipeline,
which connects the Prudhoe Bay oil
field with a tanker terminal at Valdez, Alaska.
Our specific objectives were to determine the levels,
intra-
annual variability,
and interannual variability of selected
alkane hydrocarbons and PAHs in intertidal sediments and in
M. trossulus tissues at a network of sampling stations over the
I-year sampling period,
and if possible to identify the likely
sources of hydrocarbons found. We chose sediments and mussels to
facilitate comparison with the large body of data on hydrocarbons

2
in these two matrixes in the literature.
We present our results
now to facilitate evaluation of hydrocarbon analyses of these
matrixes in Prince William Sound conducted in the aftermath of
the Exxon Valdez oil spill.
MATERIALS AND METHODS
Sampling Stations
Prince William Sound is one of North America's largest tidal
estuary systems occupying about 6,500 km on the southern coast
of Alaska.
There is a mean precipitation of 4.6 m at some
locations (Arctic Environmental Information and Data Center 1977)
which is sufficient enough to depress salinities within the Sound
and influence adjacent oceanic currents.
The prevailing ocean
current enters the Sound through Hinchinbrook Entrance in the
south-central part of the Sound and exits mainly through Montague
Strait in the southwest (Galt et al. 1991).
Intertidal sediment and mussel samples were collected from
four to eight stations in Prince William Sound, Alaska, during
the period May 1977 to August 1980.
The latitude, longitude, and
collection dates for each station are listed in Table 1, where
the station numbers correspond with those in Figure 1, and where
entries for sediment temperature and seawater salinity in Table 1
indicate samples were collected.
The eight sampling stations
bracket the oil tanker route inside Prince William Sound to the
Alaska pipeline terminal in Port Valdez (Fig. 1).
The eight
stations were not all sampled prior to the June 1978 sampling.
The sampling stations are subject to dissimilar
environmental influences.
Two stations,
Dayville Flats and
Mineral Flats,
are located inside Port Valdez near the oil tanker
terminal and the city of Valdez, Alaska, respectively (Fig. 1).
The surface waters of Port Valdez receive sufficient fresh water
from direct precipitation and glacial melt-water to depress
salinities substantially, particularly in late summer (Table 1,).
In addition,
the glacial melt-water bears a high sediment load
that is deposited in the Port.
Although remote from human
activity, the station at Siwash Bay is similarly affected by
fresh and glacier melt-water.
The other stations are not
directly exposed to glacial melt-water.
The stations at Constantine Harbor and at Rocky Bay are
exposed to the effects of occasional vessel traffic.
Constantine
Harbor was the site of an early Russian settlement, and more
recently has been used as a port of refuge for vessels seeking

Table l.--Sample station locations, sampling dates, salinities and temperatures.
Salinities (%) and temperatures (°C) are given for each sediment and
mussel sample collection date at each sampling station.
Missing values for salinity and temperature indicate no samples collected. M=
measurement not taken.
The sample station numbers refer to those
in Figure 1.
1977
1978
1979
1980
*Mussels only collected

Figure l.--
Maps
of the study area and of the sampling stations
within the study area.
The sample station numbers on
these maps are those listed in Table
1.
5
shelter from the frequent storms in the Gulf of Alaska.
Although
an excellent harbor,
it is very poorly flushed due to its shape.
Rocky Bay is fished commercially for several species, resulting
in occasionally dense vessel traffic.
The stations at Bligh Island, Naked Island, and Olsen Bay
are rarely exposed to human activities and are exposed to similar
oceanographic conditions that are typical of most of the Sound.
Sample Collection
Sediment collection transect lines (30 m) were located
parallel to the water line from the -0.75 m to +0.75 m tide
levels.
Sediment cores were collected using a rinsed,
hydrocarbon-free stainless steel cookie cutter. Sediment samples
were collected in triplicate at each site by compositing 10 cores
(diameter 3.2 cm x depth 1.25 cm) taken at random along the 30-m
transect for each sample.
Composite sediments were placed in
dichloromethane-rinsed glass jars and were frozen within 2-3
hours of collection.
Mussel collection transects were located in mussel bands
parallel to the water line,
usually just above the sediment
transects (-+l m tide level).
Mussel samples were collected in
triplicate by taking approximately 30 2-5 cm mussels (enough to
produce ≥ 10 g tissue) at random along the 30-m transect.
The
collected mussel samples were placed into dichloromethane-rinsed
glass jars and were frozen within 2-3 hours of collection.
Sediment
- Physical Measurements
Total organic carbon was determined by the method of Jackson
(1958).
Sediment grain size distribution was determined using
standard sieves and pipetting methods (Krumbein and Pettijohn
1938).
Sediment dry weight was determined gravimetrically by
measuring the weight lost after drying for 24 hours at 100°C.
Mussel Tissue -
Dry Weight and Lipid Determination
Mussel tissue dry weight was determined gravimetrically by
measuring the weight lost after drying for 24 hours at 120°C.
Percent lipid of the tissue was determined by the method of
Hanson and Olley (1963) and is reported on a dry weight basis.
Chemical Analysis
Sediment and mussel tissue samples were analyzed for normal
alkanes having 10 to 30 carbon atoms (C-10 to C-30), pristane,
6
phytane,
and the PAHs listed in Table 2.
Pristane and phytane
refer to 2,6,10,14-tetramethylpentadecane and 2,6,10,14-
tetramethylhexadecane, respectively.
Concentrations are reported
as ng/g dry weight.
Not more than two samples were analyzed from
any triplicate of samples collected.
Sediment and mussel tissue samples were processed for
analysis in batches consisting of 8-10 samples, a reagent blank,
and a spiked reagent blank.
The alkane dodecylcyclohexane (DCH)
was added to the samples and to the spiked blank, but not to the
reagent blank, to verify recovery of alkane analytes.
An aliquot
of the hydrocarbons listed in Table 2 was added to the spiked
blank to estimate losses during analysis. The samples, reagent
blank, and spiked blank were processed identically.
Extraction Procedure
Hydrocarbons in sediment samples were extracted using a
ball-mill tumbler extraction procedure described fully in Brown
et al. (1980).
An aliquot of DCH was added to a 100 g wet
sediment sample,
which was subsequently dewatered by swirling the
sample with two successive aliquots of 50 ml methanol per aliquot
in a 1 L bottle.
The two methanol aliquots were then decanted
and combined in a 600 ml beaker, and 100 ml of 2:l
dichloromethane:
methanol was added to the bottle containing the
sediment sample.
The bottle was sealed with a Teflon-lined
screwcap and rolled on a ball-mill tumbler for 16 hours
(overnight).
The extract was decanted into the 600 ml beaker
containing the methanolic extracts, together with 5 ml
dichloromethane used to rinse the sample and bottle.
The
dichloromethane-methanol sediment extraction step was repeated
twice,
first for 6 hours, then for 16 hours, with 100 ml each
time.
The combined extracts were filtered through a coarse
fritted-glass filter into a 1 L separatory funnel and extracted
with 500 ml distilled water to remove methanol.
The aqueous
phase was separated and back-extracted with 20 ml
dichloromethane,
and the dichloromethane phases were combined and
filtered through a 19 mm id chromatography column containing
20 ml of activated silica gel covered with a 1 cm layer of sand.
The dichloromethane filtrate and rinses were concentrated and
exchanged into 2 ml of hexane under reflux.
Hydrocarbons in whole mussel tissue were extracted using a
procedure described fully by Brown et al.. (1979).
Whole tissues
from samples of mussels were mechanically homogenized for at
least 30 seconds.
A 10 g aliquot of the homogenate was combined
with 6 ml of 4 N sodium hydroxide in a 40 ml centrifuge tube
capped with a Teflon-lined screw cap, shaken for 1 minute, and
digested at 30°C for 18 hours.
A 15 ml aliquot of diethyl ether

7
Table 2.--Identities
and abbreviations of alkane and aromatic hydrocarbon
analytes determined in sediment and in mussel tissue samples
of
this study.
8
was added to the centrifuge tube after it had cooled to room
temperature,
and the re-capped tubes were shaken for 1 minute and
centrifuged for 10 minutes.
The ether phase was transferred to a
30 ml bottle, and the sample was re-extracted with 10 ml of
diethyl ether.
The combined ether extracts were dried with 0.5 g
sodium sulfate, transferred to a concentrator tube, then
concentrated and exchanged into 2 ml of hexane under reflux.
Fractionation Into Hydrocarbon Classes
Alkane and aromatic hydrocarbons were separated by column
liquid chromatography using silica gel.
The silica gel (Davison
grade 923) was 100-200 mesh activated at 150°C for 24 hours.
The
chromatography column was packed with 7 g silica gel covered with
a 1 cm layer of sand in dichloromethane, and then washed with
40 ml of petroleum ether.
The sample in 2 ml hexane was loaded
onto the top of the column and eluted with 15 ml petroleum ether,
then 3 ml 1:4 dichloromethane:petroleum ether, then 25 ml 2:3
dichloromethane:petroleum ether.
The first 18 ml of eluate
collected contained the alkane analytes, and the next 25 ml of
eluate contained the aromatic analytes.
Elemental sulfur was
removed from these eluates with copper metal that was activated
through rinsing with concentrated hydrochloric acid, then
methanol.
The eluates were prepared for analysis by gas
chromatography (GC) by concentration to 0.7 ml under reflux,
addition of 1.0 ml internal standard (4 ng/ul hexamethylbenzene
(HMB) in hexane),
and re-concentration to 0.7 - 1.0 ml.
Gas Chromatography
The alkane and aromatic hydrocarbon extract fractions were
analyzed using GC with a hydrogen flame ionization detector (FID)
to measure each analyte.
The GC instrument conditions were the
same for the alkanes and aromatics.
The GC analysis was
performed on a Hewlett-Packard model 5840A gas chromatograph
equipped with a 30 m long by 0.25 mm id glass capillary column
coated with a dimethylsiloxane polymer (SE-30).
A 2 ul aliquot
of sample was injected into the injection port operated in the
splitless mode at 280°C.
The split valve was opened after 0.3
minutes.
The carrier gas was helium, the initial column
temperature was 40°C for 5 minutes, but then was raised at a rate
of 4°/minute to 270°C.
The detector was operated at 300°C and
used nitrogen make-up gas.
Analyte peak area response was
determined using an electronic integrator.
Hydrocarbon analyte, concentrations in the extracts injected
into the GC were determined by comparison of the ratio of analyte
FID response and internal standard (HMB) FID response for a
sample with the same ratio for a hydrocarbon standard.
The
concentration of hydrocarbon analyte in the original sample was
9
calculated as the ratio of the amount of analyte present in the
original sample and the equivalent dry weight
of
the sample.
The
equivalent dry weight of a sample is the product of the sample
wet weight and the ratio of wet and dry weights of that sample,
which were determined using a 10-20 g subsample for sediments and
a 3 g subsample for mussel tissue homogenates.
Detection limits were estimated on the basis of the minimum
measurable instrument response,
response factors for standards,
and sample dry weight.
These estimates of detection limit
concentrations are indicated by the preceding symbol "<" for each
analyte not detected in each sample in Tables A-l through A-4 in
the Appendix.
Confirmation of Aromatic Hydrocarbon Analyte Identities
by
Gas
Chromatography/Mass Spectrometry
The identity of aromatic hydrocarbons detected and measured
by GC/FID were confirmed by GC/MS analysis in each sample matrix
at each sample station.
Data Analysis
Intra-annual trends of selected alkane analytes were
evaluated using a two-factor analysis of variance (ANOVA), where
factors included seven sample stations and the three sample
collection periods listed in Table 1 for 1978.
Data from 1978
were evaluated because more of the sample stations were sampled
and analyzed in duplicate than in other years, resulting in a
balanced ANOVA with maximum power.
The sample station not
included for the ANOVA was the Mineral Flats station in Port
Valdez,
which was not sampled in May of 1978.
The analytes
selected for evaluation included: pristane, phytane, and the
normal alkanes from C-12 through C-31 in sediments; pristane and
the normal alkanes from C-12 through C-17 in mussels were also
included.
The remaining alkane analytes and all the aromatic
analytes in both sediments and mussels were only sporadically
above detection limits,
precluding evaluation by ANOVA.
Interannual trends of selected alkane analytes were
evaluated using a two-factor ANOVA, where factors included six
sample stations and two sample collection periods: June 1977 and
June 1978.
Data from June of these years were evaluated because
more of the sample stations were sampled and analyzed in
duplicate than the other months,
resulting in a balanced ANOVA
with maximum power.
The sample stations not included for the
ANOVA were the Olsen Bay station and the Mineral Flats station in
Port Valdez,
which were not sampled in June of 1977.
The
analytes selected for evaluation included: pristane, phytane, C-
10
15, and the normal alkanes from C-17 through C-31 in sediments;
pristane and the normal alkanes from C-12 through C-17 in mussels
were also included.
The remaining alkane analytes and all the
aromatic analytes in both sediments and mussels were only
sporadically above detection limits,
precluding evaluation by
ANOVA.
The association of an alkane analyte in sediments with
mussel tissues was evaluated using the Pearson product-moment
correlation coefficient.
Data from all the sampling stations and
from all the sampling dates were included for the correlation
coefficient calculations.
Correlation coefficients were
determined for C-15,
C-17, and pristane because these were the
only three hydrocarbon analytes consistently present in both
sediments and mussels.
The original alkane concentrations, c, were transformed as
ln(c + 1),
and the correlation coefficients and the ANOVAs were
calculated using the transformed values.
RESULTS
The concentrations of alkane and of aromatic hydrocarbon
analytes found in sediments and mussels are listed in Tables A-l
through A-4 of the Appendix.
The percent total organic carbon
(TOC) is also listed in Table A-l for each sediment sample where
determined,
and the percent lipid is also listed in Table A-2 for
each mussel sample where determined.
The sediment grain size
distribution is listed in Table A-5 for each sediment sample
where determined.
Percent TOC, percent lipid, and sediment grain
size are presented in these tables to facilitate comparison with
future work.
Following is a summary and statistical
evaluation of the hydrocarbon results listed in these tables.
I.
Alkanes
A.
Sediments
Mean concentrations of individual alkane analytes were
generally on the order of 1 to 10 ng/g dry sediment, ranging up
to about 100 ng/g,
at all sites except Constantine Harbor
(Fig. 2).
Mean alkane concentrations were consistently elevated
by a
factor of about 5 or more at Constantine Harbor compared
with the other sites (Fig. 2).
These mean concentrations are
averages of sample duplicates and of all sampling periods.
Sediments at Constantine Harbor contained numerous
unidentified alkane hydrocarbons compared with sediments at the

12
other sampling stations.
Representative chromatograms of alkanes
in sediment samples at Constantine Harbor, Dayville Flats, and
Olsen Bay in June 1978 are presented in Figure 3.
Note the
presence of numerous unidentified peaks in the Constantine Harbor
chromatogram that are generally absent in the Dayville Flats and
Olsen Bay chromatograms of Figure 3. Constantine Harbor is the
only sampling station where these unidentified peaks are
typically present.
Concentrations of normal alkanes having an odd number of
carbon atoms generally predominate over adjacent even-numbered
alkanes at all eight sites,
with exceptions in the C-10 to C-14
range of the normal alkanes (Fig. 2). The sum of the mean
concentrations of odd C-15 thru C-31 account for 71 - 89%,
depending on the site,
of the sum of the mean concentrations of
all the alkanes,
with maxima at C-15 to C-19 and at C-27 to C-31.
Pristane and phytane are relatively minor constituents of
alkanes in sediments.
Mean pristane concentrations were highest
at Naked Island,
Constantine Harbor, and Rocky Bay, with mean
concentrations of 43.6 ng/g, 42.6 ng/g, and 24.4 ng/g,
respectively.
However,
even at these three stations, the mean
pristane concentration was less than 8% of the sum of the mean
concentrations of all the alkanes at the respective stations.
Phytane concentrations were consistently highest at Constantine
Harbor at a mean concentration of 9.07 ng/g; mean phytane
concentrations at the other stations range from 1.04 to
3.43 ng/g.
Intra-annual Variation - Sediments
In 1978,
the sampling period was at least a highly
significant factor (P < 0.01) for six alkane analytes, based on
the intra-annual two-factor ANOVAs (Table 3).
The ANOVA
interaction term was not significant for two of these alkanes,
pristane and C-20,
indicating uniform changes of these two
alkanes across the sampled stations.
These two alkanes were
consistently lower in August 1978 than in May 1978 at each
sampled station (Table 4).
The ANOVA interaction term was
significant for the other four alkanes, C-13, C-14, C-16, and
C-18, (Table 3),
indicating station-specific significant changes
of these alkanes.
These four alkanes increased from May 1978 to
August 1978 at Bligh Island and at Siwash Bay, but decreased
during this same period at the other sampled stations (Table 4).
Sampling period is a significant factor (P < 0.05) for eight
other alkane analytes at stations sampled in 1978, and the ANOVA
interaction term is either not significant or is marginally
significant (P
-0.05) for these analytes (Table 3). These
alkanes include phytane, C-19, C-21, C-22, C-24, C-27, C-29, and

13
Table 3 .--Summary analysis of variance table for intra-annual variation of
logarithmically transformed alkane concentrations in sediments
during 1978 at seven sampling stations.
The excluded station is
Mineral Flats because it was not sampled in May 1978.
The two-
factor ANOVA includes 1978 sampling period and sampling stations as
the two factore,
and is performed for each alkane analyte listed
below independently.
Also listed for each alkane analyte below are
the ANOVA F-ratios of the sampling period mean square (df = 2) and
the error mean square (df = 21), the sampling station mean square
(df =
6) and the error mean square,
and the interaction mean square
of sampling periods and sampling stations (df = 12) and the error
mean square.
The error mean square is itself listed for each alkane
analyte to allow the reader to reconstruct the full ANOVA table for
each alkane.
These ANOVA's are fully balanced, with two
observations for each combination of sampling period and sampling
station.
The symbols *, **,
and *** associated with the F-ratios
indicate significance (P < 0.05),
high significance (P < 0.01), and
very high significance (P <0.00l), respectively. Alkane
concentrations of Table A-l were transformed as ln (c + 1), where c
is the concentration listed in Table A-l, prior to the ANOVA
calculation.
Alkane
Month Station
a
F
2,21
F
6&21
Interaction
F
12,21
MSe

14
Table 4.
--Proportional change from May 1978 to August 1978 of
alkane analytes in sediments at seven sampling stations.
The excluded station is Mineral Flats because it was
not sampled in May 1978.
Proportional change is
calculated as (A - B)/B for each alkane analyte and
for each included sampling station where
A
and B are
mean alkane analyte concentrations of August 1978 and
May 1978,
respectively, using the data in Table A-l.
Bligh
Const.
Dayville Naked
Olsen
Rocky
Siwash
Alkane
Island Harbor
Flats
Island
Bay
Bay
Bay

Figure 3.--
Representative chromatograms of alkane hydrocarbons
in sediments at Constantine Harbor, Dayville
Flats,
and Olsen Bay, June 1978.

16
C-31.
These alkanes are consistently lower in August, 1978 than
in May,
1978 at all the stations sampled except Bligh Island and
Constantine Harbor,
and they are frequently lower at Bligh
Island.
Note that sampling station is consistently a very highly
significant factor (P < 0.001) for each alkane listed in Tables 3
and 4.
Interannual Variation - Sediments
Very highly significant station-specific changes of C-17 and
of pristane were observed when June 1977 and June 1978
concentrations were compared,
based on the interannual two-factor
ANOVAs (Table 5).
Concentrations of C-17 were consistently
higher at each station in June 1978 than in June 1977, by
multiples ranging up to about 18 (Table 6).
Concentrations of
pristane were higher at most stations by factors ranging up to
about 11; pristane concentrations were unchanged at Rocky Bay and
decreased by 34.3
% at Constantine Harbor (Table 6).
Changes of
the other alkane analytes listed in Tables 5 and 6 were either
insignificant or were marginally significant (P -0.05).
Note that sampling station is consistently a very highly
significant factor (P < 0.001) for each alkane listed in Tables 5
and 6.
B.
Mussels
Mean concentrations of individual alkane analytes are
generally on the order of 10 to 100 ng/g dry mussel tissue,
although some alkanes are not detected at some stations, and
others are detected at concentrations substantially higher than
100 ng/g (Fig. 4).
In general,
alkane analytes ranging from C-10
through pristane are the most abundant in mussels at all the
sampling stations.
Pristane,
C-15, and C-17 together account for
62 -
87% of total alkanes, depending on the station.
Phytane is
detected sporadically at concentrations less than 100 ng/g except
at Olsen Bay,
where it is detected once only at 520 ng/g (May
1979,
see Table A-2).
Intra-annual Variation - Mussels
In 1978 the sampling period is at least a highly significant
factor (P < 0.01) for C-12, C-14, C-15,
and pristane based on the
intra-annual two-factor ANOVAs (Table 7).
By far the most
significant change was for pristane,
which consistently declined
at all stations from concentrations ranging up to several
thousand ng/g in May 1978 to concentrations less than 100 ng/g in

17
Table 5.--
Summary analysis of variance table for interannuel variation of logarithmically transformed alkane
concentrations in sediments from June 1977 to June 1978 at six sampling stations.
The excluded
stations are Mineral Flats and Olsen Bay because these were not sampled in June 1977. The included
stations were all sampled in June 1977 and in June 1978.
The two-factor ANOVA includes the year of
the June sampling period and sampling stations as the two factors, and is performed for each alkane
analyte listed below independently.
Also Listed for each alkane analyte below are the ANOVA F-ratios
of the sampling period mean square (df =
1) and the error mean square (df = 121, the sampling station
mean square (df = 5) and the error mean square, and the interaction mean square of sampling periods
and sampling stations (df =
5) and the error mean square.
The error mean square is itself listed for
each alkane analyte to allow the reader to reconstruct the full ANOVA table for each alkane.
These
ANOVAs are fully balanced, with two observations of alkane concentration for each combination of
sampling period and sampling station.
The symbols *,**, and *** associated with the F-ratios
indicate significance (P < 0.051, high significance (P < 0.011, and very high significance
(P < 0.001), respectively.
Alkane concentrations of Table A-l were transformed as ln (c + 1), where
c is the concentration listed in Table A-l, prior to ANOVA calculation. The alkane analytes C-10
through C-14, and C-16, are not included in this table because the concentrations of these analytes
are frequently below detection limits, and thus transform
to
zero, which compromises the homoscedastic
assumptions of the ANOVA.
Alkane
Year
F
1,12
Station
a
F
5,12
Interaction
F
5,12
MSe
b
Only four sampling stations were included in this ANOVA; the additionally excluded station is Constantine
Harbor, because the analytical results were not reported for this alkane analyte at this station in
June
1977
results (see Table A-l, Constantine Harbor).
The degrees of freedom for the sampling station mean square, the
interaction mean square, and the error mean square are 4, 4, and 10, respectively, for this alkane in this table.

18
Table 6.
--Proportional change from June 1977 to June 1978 of alkanes in
sediments at six sampling stations.
The excluded stations are
Mineral Flats and Olsen Bay because they were not sampled in
June 1977.
Proportional change is calculated as (A - B)/B for
each alkane analyte and for each included sampling station
where A and B are mean alkane analyte concentrations of June
1977 and June 1978, respectively,
using the data in Table A-l.
The alkane analytes included in this table are those listed in
Table 5.
Alkane
Bligh
Island
Const.
Dayville
Harbor
Flats
Naked
Rocky
Island
Bay
Siwash
Bay
N
= not available;
June 1977 values below detection limits.

20
August 1978 (Tables 8 and A-2).
This seasonal decline of pristane
concentrations were repeated in 1979 at all stations (Table A-2).
The
ANOVA interaction term was not significant for C-12 and for C-14 (Table
7)l
indicating uniform declines of these two alkanes across the sampling
stations (despite the slight rise of the mean concentration of C-13 at
Siwash Bay; see Table 8).
The ANOVA interaction term was significant for
C-15 (Table 7) due to the decline of the C-15 mean concentration at Olsen
Bay and the increase of the C-15 mean concentration at the other
stations.
Note that sampling station is a significant factor only for pristane
and C-15 in Table 7.
Interannual Variation - Mussels
Very highly significant changes of C-15 and pristane were observed
when June 1977 and June 1978 concentrations were compared, based on the
interannual two-factor ANOVAs (Table 9). Pristane consistently increased
at each sampling station in June 1978 compared with June 1977 by
multiples ranging up to ten-fold depending on sampling station (Table
10).
C-15 consistently decreased at each sampling station by factors
ranging up to 4 depending on sampling station (Table 10).
Note that sampling station is a significant factor only for pristane
and C-17 in Table 9.
Correlation of Alkanes in Sediments and Mussels
Only pristane was significantly correlated in sediments and mussels,
with a coefficient of correlation r = 0.344 (n = 90, P < 0.001).
Correlation coefficients for C-15 and for C-17 were 0.028 (n = 97) and -
0.053 (n = 95), respectively,
and were clearly not significant (
P
> 0.5).
II. Aromatics
A.
Sediments
At three of the sampling stations,
a few aromatics were frequently
present at concentrations well above detection limits.
These stations
included Constantine Harbor, Mineral Flats, and Rocky Bay (see Table A-3
for these stations).
Perylene and phenanthrene were the most abundant
aromatic analytes at these three stations,
together accounting for 31 -
54%
of total aromatic analytes (Fig. 5).
Sediments at Constantine Harbor contain numerous unidentified
aromatic hydrocarbons compared with sediments at the other sampling
stations.
Representative chromatograms of aromatics in sediment samples
at Constantine Harbor, Dayville Flats,
and Olsen Bay in June 1978 are

21
Table 7.
--Summary analysis of variance table for intra-annual
variation of logarithmically transformed alkane
concentrations in mussels during 1978 at seven stations.
The excluded station is Mineral Flats because it was not
sampled in May 1978.
The two-factor ANOVA includes 1978
sampling period and sampling stations as the two
factors,
and is performed for each alkane analyte listed
below independently.
Also listed for each alkane
analyte below are the ANOVA F-ratios of the sampling
period mean square (df = 2) and the error mean square
(df = 21),
the sampling station mean square (df = 6) and
the error mean square,
and the interaction mean square
of sampling periods and sampling stations (df = 12) and
the error mean square.
The error mean square is itself
listed for each alkane analyte to allow the reader to
reconstruct the full ANOVA table for each alkane. These
ANOVAs are fully balanced, with two observations for
each combination of sampling period and sampling'
station.
The symbols *, **,
and *** associated with the
F-ratios indicate significance (P < 0.05), high
significance (P < 0.01),
and very high significance
(P < 0.001),
respectively.
Alkane concentrations of
Table A-l were transformed as ln(c + 1), where c is the
concentration listed in Table A-l, prior to the ANOVA
calculation.
The alkane analytes C-18 through C-31 and
phytane are not included in this table because the
concentrations of these analytes are frequently below
detection limits,
and thus transform to zero, which
compromises the homoscedastic assumptions of the ANOVA.
Alkane
Month
Station
Interaction
F
1,21
F
6,21
F
12,21
MSe

22
Table 8.
--Proportional change from May 1978 to August 1978 of
alkanes in mussels at seven sampling stations.
The
excluded station is Mineral Flats, because it was not
sampled in May 1978.
Proportional change is calculated
as (A -
B)/B for each included alkane analyte, and for
each included sampling station, where A and B are mean
alkane analyte concentrations of August 1978 and May
1978,
respectively,
using the data in Table A-l. The
alkane analytes included in this table are those listed
in Table 7.
Alkane
Bligh
Island
Const.
Harbor
Dayville
Flats
Naked
Island
Olsen
Bay
Rocky
Bay
Siwash
Bay
(+):
mean May 1978 =
0; mean August 1978 >0

23
Table 9.
--Summary analysis of variance table for interannual
variation of logarithmically transformed alkane
concentrations in mussels from June 1977 to June 1978 at
six sampling stations.
The excluded stations are Mineral
Flats and Olsen Bay because these were not sampled in May
1977.
The included stations were all sampled in June 1977
and in June 1978. The two-factor ANOVA includes the year'
of the June sampling period and sampling stations as the
two factors,
and is performed for each alkane analyte
listed below independently.
Also listed for each alkane
analyte below are the ANOVA F-ratios of the sampling period
mean square (df =
1) and the error mean square (df = 12),
the sampling station mean square (df = 5) and the error
mean square,
and the interaction mean square of sampling
periods and sampling stations (df = 5) and the error mean
square.
The error mean square is itself listed for each
alkane analyte to allow the reader to reconstruct the full
ANOVA table for each alkane.
These ANOVAs are fully
balanced, with two observations of alkane concentration for
each combination of sampling period and sampling station.
The symbols *, **,
and *** associated with the F-ratios
indicate significance (P < 0.05), high significance
(P < 0.01),
and very high significance (P < 0.001),
respectively.
Alkane concentrations of Table A-l were
transformed as ln(c + 1),
where c is the concentration
listed in Table A-1, prior to ANOVA calculation. The
alkane analytes C-18 through C-31, and phytane, are not
included in this table because the concentrations of these
analytes are frequently below detection limits, and thus
transform to zero,
which compromises the homoscedastic
assumptions of the ANOVA.
Alkane
Year
F
1,12
Station
Interaction
F
5,12
F
5,12
MSe

24
Table 10.
--Proportional change from June 1977 to June 1978 of
alkanes in mussels at six sampling stations.
The
excluded stations are Mineral Flats and Olsen Bay
because they were not sampled in June 1977.
Proportional change is calculated as (A - B)/B for each
alkane analyte and for each included sampling station
where A and B are mean alkane analyte concentrations of
August 1978 and May 1978, respectively, using the data
in Table A-l.
The alkane analytes included in this
table are those listed in Table 9.
Alkane
Bligh
Island
Const.
Harbor
Dayville
Naked
Flats
Island
Rocky
Bay
Siwash
Bay
(+) :
mean 1977 =
0; mean 1978 >0
25
presented in Figure 6.
Note the presence of numerous unidentified
peaks in the Constantine Harbor chromatogram that are generally
absent in the Dayville Flats and Olsen Bay chromatograms of Figure 6.
These unidentified peaks are most numerous and largest at Constantine
Harbor,
followed by Rocky Bay and Mineral Flats in decreasing order.
Note also the prominence of identified aromatic analytes which lack
alkyl substituents in the Constantine Harbor chromatogram of Figure-
6.
The variety of identified aromatic analytes usually detected
decreases as follows:
Constantine Harbor > Rocky Bay > Mineral
Flats. Most aromatic analytes are usually detected at elevated
concentrations at Constantine Harbor and Rocky Bay, the exceptions
being the mononuclear aromatics, benzothiophene, anthracene, and
benzo[a]pyrene (and 2,3,5-trimethylnaphthalene at Rocky Bay), which
are sporadically detected.
Aromatic analytes usually detected at
Mineral Flats include the naphthalenes (except 2,3,5-
trimethylnaphthalene), fluorene, dibenzothiophene, phenanthrene,
fluoranthene, and pyrene (Fig. 5).
At five of the sampling stations,
all aromatic analytes except
perylene were near or below detection limits (Table A-3).
These
stations included Bligh Island, Dayville Flats, Naked Island, Olsen
Bay,
and Siwash Bay.
Aromatic analytes most frequently detected at
these stations included phenanthrene, 2-methylnaphthalene, perylene,
naphthalene,
and 1-methylnaphthalene, in order of decreasing
frequency of detection among these stations (Table A-3).
Although
not detected at Dayville Flats, perylene accounted for 43 - 79% of
the aromatic analytes at the remaining four of these stations (Fig.
5) l
In contrast, benzothiophene, benzanthracene, and benzo[e]pyrene
were never detected at these five stations; 2,3,5-
trimethylnaphthalene, dibenzothiophene, and chrysene were each
detected once only at concentrations that were less than 0.7 ng/g.
The low and sporadic concentrations of aromatics preclude
evaluation of intra-
or interannual trends.
B.
Mussels
Aromatic analytes were rarely detected in mussels.
Aromatic
analytes were detected only 18 times,
which included only five
analytes (Table A-4).
Naphthalene was detected nine times-and 1-
methylnaphthalene was detected six times.
Iso-propylbenzene, n-
propylbenzene,
and benzothiophene were each detected once only.
Naphthalene or 1-methylnaphthalene were detected most often at
Dayville Flats (four times), Rocky Bay (four times), Bligh Island
(three times),
and Constantine Harbor (three times).
Aromatic analytes in mussels were detected most often in 1977,
when detection limits are substantially lower than for succeeding
years.
Of the 18 instances of aromatic analyte detection in mussels,


27
28
14 occur in 1977 (Table A-4).
Detection limits of aromatic analytes
for the 1977 samples were usually less than 3 ng/g, whereas these
detection limits were usually greater than 4 rig/g for samples from
succeeding years (Table A-4).
DISCUSSION
Trace level hydrocarbon contamination was evident at the
Constantine Harbor, Mineral Flats, and Rocky Bay sampling stations.
Contamination was indicated by the presence and diversity of aromatic
hydrocarbons repeatedly found in sediments at these stations, which
were generally absent at the other sampling stations.
Sediment contamination levels were highest at Constantine
Harbor,
and the contamination was probably the result of a
combination of sources.
The highest concentrations and greatest
diversity of aromatic analytes and of other unidentified aromatic
hydrocarbons was found in the sediments of this station.
The
presence of elevated concentrations of PAHs containing more than
three rings and lacking alkyl substituents in these sediments (but
not including perylene, see below),
indicates a pyrolytic source for
these PAHs.
Lower concentrations of alkyl-substituted 3- and 4-ring
PAHs compared with corresponding unsubstituted homologues may be
inferred from the chromatograms of these samples (Fig. 6), which show
the unsubstituted homologues as the most prominent peaks.
Prominence
of these higher molecular weight PAHs is indicative of a pyrolytic
source and atmospheric transport to these sediments (Hites 1981,
Lunde and Bjorseth 1977,
Youngblood and Blumer 1975), and this source
and transport mechanism was further supported by the general absence
of PAHs in mussel tissues at the Constantine Harbor station.
Waterborne transport of petroleum-derived hydrocarbons to
Constantine Harbor sediments was probably a second source of
contaminant hydrocarbons.
This source was indicated by the
consistently elevated levels of lower molecular weight normal-
alkanes, phytane,
unidentified branched alkanes, and aromatics found
in Constantine Harbor sediments.
Phytane is associated with
petroleum and with ancient sediments (Blumer and Snyder 1965,
Oro et al.
1965) and is usually absent from modern unpolluted
sediments,
although it may be produced by biochemical processes or
found in modern sediments in special situations (Ikan et al. 1975,
Nissenbaum et al. 1972).
Concentrations of lower molecular weight
normal-
and branched-alkanes and aromatics are enriched in refined
petroleum products compared with crude oil.
The general absence of
these aromatic hydrocarbons in Constantine Harbor mussels suggests
that the source is not petroleum hydrocarbon seepage from a
terrestrial or sub-marine source because a nearly continuous seepage
should result in a nearly constant influx of petroleum hydrocarbon
contamination that would have been detected in these mussels.
29
The most likely source of all the contaminant hydrocarbons found
in Constantine Harbor sediments is from sporadic fuel spills and fuel
combustion, exhaust emissions of marine vessel traffic.
Constantine
Harbor is an excellent natural anchorage that is sometimes used as a
harbor of refuge by vessels of all sizes, including commercial
vessels,
seeking protection from violent storms that frequently occur
in the Gulf of Alaska.
The larger vessels usually keep their engines
running at idle while at anchor,
and they may also discharge ballast
water.
The contaminant hydrocarbons found in Constantine Harbor
probably arose from these emissions and discharges over the past
several decades.
Contaminant hydrocarbons found at Rocky Bay and at Mineral Flats
probably arose from sources similar to those at Constantine Harbor.
Rocky Bay is the site of occasional commercial fishing, and Mineral
Flats is adjacent to both the boat harbor at the city of Valdez and
the oil tanker loading terminal in Port Valdez.
There was no evidence of detectable contaminant hydrocarbons at
the other five sampling stations of this study.
The perylene and
phenanthrene detected at these stations probably arose from natural
sources;
both have been detected in unpolluted sediments worldwide
and in sediment core samples that pre-date industrial activity
(Venkatesan 1988, Hites et al. 1980, Farrington et al. 1977, Hites et
al. 1977).
Perylene has been reported as the predominant PAH in some
Alaskan sediments,
and has been significantly correlated with the sum
of C-27 and C-29 in these sediments,
which was taken as evidence of a
terrigenous source (Venkatesan and Kaplan 1982).
Our results are
consistent with these observations;
the highest concentrations of
perylene,
C-27, and C-29 occurred at Constantine Harbor.
The other
aromatic hydrocarbons found in sediments and in mussels at these
stations were present only sporadically, and at concentrations near
detection limits.
Similarly, phytane and many of the normal alkanes
having an even number of carbon atoms were found at these stations at
concentrations near detection limits,
further corroborating the
general absence of petroleum hydrocarbon contamination.
Of the normal alkanes of molecular weight higher than C-19 in
sediments, the high abundance of normal alkanes having an odd number
of carbon atoms compared with those having an even number of carbon
atoms at all the sampling stations of this study indicates
terrestrial plants as primary sources of these alkanes (Kolattukudy
1976, Eglinton and Hamilton 1967, Eglinton et al. 1962).
These
alkanes may be transported by senescent leaves of beach grasses,
upland shrubs,
and trees such as alder (Alnus rubra), to intertidal
sediments where they may be pulverized and incorporated into the
organic carbon compartment of the surface sediments.
These plants
are common in Prince William Sound and may form dense stands adjacent
to or in the upper intertidal zone.
Primarily terrestrial sources of
these hydrocarbons was further supported by the low and sporadic
concentrations of these alkanes found in the mussels of these

30
sampling stations.
The presence and abundance of normal alkanes of molecular weight
lower than C-20 and pristane in sediments and in mussel tissues
suggests sources of these hydrocarbons that are primarily marine.
These normal alkanes are common constituents of marine bacteria
(Oro
et al. 1967),
blue-green algae (Winters et al. 1969), planktonic and
macrophytic algae (Clark and Blumer 1967, Blumer et al. 1971), and
pristane is biochemically synthesized from phytol by several calanoid
copepod species (Avigan and Blumer 1968, Blumer et al. 1964).
Incorporation of these alkanes into intertidal sediments could arise
from deposition of carcass fragments of these organisms after death,
while incorporation into mussels could arise from ingestion of
phytoplankton as food,
and possibly from ingestion of detrital
material derived from zooplankton.
The high concentrations, variability,
and the different patterns
of variability of pristane,
C-15, and C-17 in sediments and in
mussels indicates distinct biological sources of these alkanes.
The
very high May concentrations of pristane in mussels, followed by
consistent and dramatically lower concentrations in June and still
lower in August,
suggests accumulation of pristane by ingestion of
detrital material derived from carcasses of calanoid copepods.
Blumer et al. (1964) found concentrations of pristane in
Calanus finmarchicus, C. glacialis,
and in C. hyperboreus approaching
1% dry weight in the northwestern Atlantic ocean, and in analogous
Pacific ocean species such as C. marshalae, Neocalanus plumchrus, and
N. cristatus.
Calanus marshalae and N. plumchrus are abundant in
Prince William Sound (Cooney 1987).
The very high May concentrations of pristane in mussels were
highest at Rocky Bay and Naked Island, which are the two stations
most exposed to the prevailing ocean current that enters the Sound at
Hinchinbrook Entrance and exits through Montague Strait.
This
current carries inorganic nutrients from deep-water upwelling off the
continental shelf into the Sound, which supports dense planktonic
blooms in the spring,
followed by blooms of zooplankton.
It is
remarkable, however,
that pristane concentrations in mussels were
quite low in 1977;
this probably reflects the population dynamics of
the calanoid copepods.
The significant correlation of pristane in mussels and in
sediments among the sampling stations and periods further suggests
calanoid copepods as the source of pristane in the sediments.
The high intra-
and interannual variability of C-17 in
sediments, but not in mussels,
suggests multiple sources of this
alkane in these matrixes.
C-17 is the predominant normal alkane of
many inter-
and sub-tidal red algae (Rhodophyceae) (Clark and Blumer
1967),
which on senescence may be incorporated into the organic
compartment of intertidal sediments but would not be available to
31
mussels.
The relatively high concentrations of C-17 in mussels,
together with less intra-annual variability may be due to the
ubiquity of this alkane in phytoplankton ingested by mussels (Blumer
et al. 1971).
The high intra-
and inter-annual variability of C-15 in mussels,
but not in sediments,
suggests multiple sources of this alkane in
these matrixes that are different than those of C-17.
Although C-15
varied greatly from year to year,
and generally increased from May to
August in mussels,
it was not clear why corresponding variation in
sediments is not evident.
In conclusion,
except in areas affected by localized vessel
traffic,
intertidal sediments and mussels in Prince William Sound
were remarkably free of petroleum-contaminant hydrocarbons during the
period of this study.
The hydrocarbons found in sediments and
mussels unaffected by vessel traffic can be adequately explained by
known, natural sources.
As
a result,
sediments and mussels
contaminated by crude oil from the Exxon Valdez oil spill should be
particularly apparent,
due to the general absence of other
confounding sources of petroleum hydrocarbons.
ACKNOWLEDGMENTS
The authors
thank D.L. Fisher, A.J. Friedman, D.D. Gennero, K.L.
Grams, K.E.
Kreps,
P.G. Prohaska, D.G. Burrows, K.A. Culler, J.F.
Morado,
P.P. Murphy, R.G. Jenkins, T.I. Scherman, and O. Maynes for
collecting and analyzing samples,
and L.A. Quintrell for assistance
in manuscript preparation.
32
CITATIONS
Arctic Environmental Information and Data Center.
1977.
Climatic atlas of the outer continental shelf waters and
coastal regions of Alaska. Volume 1: Gulf of Alaska.‘
439 p.
Avigan, J.,
and M. Blumer.
1968.
On the origin of pristane in
marine organisms. J. Lipid Res. 9:350-352.
Blumer, M.,
M. M. Mullin, and D. W. Thomas.
1964.
Pristane in
the marine environment.
Helgol. Wiss. Meeres. 10:187-201.
Blumer, M., R. R. L. Guillard, and T. Chase.
1971.
Hydrocarbons
of marine phytoplankton. Mar. Biol. 8:183-189.
Blumer, M., and W. D. Snyder.
1965.
Isoprenoid hydrocarbons in
recent sediments: presence of pristane and probable absence
of phytane. Science 150:1588-1589.
Brown, D. C., L. S. Ramos, M. Y. Uyeda, A. J. Friedman, and W. D.
MacLeod.
1980.
Ambient temperature extraction of
hydrocarbons from marine sediment - comparison with boiling-
solvent extractions. In L. Petrakis and F. T. Weiss
(editors),
Petroleum in the marine environment, p. 313-326.
ACS Symp. Ser. 185, American Chemical Society, Washington,
D. C.
Brown, D. C.,
A. J. Friedman, D. G. Burrows, G. R. Snyder, B. G.
Patten,
W. E. Ames, L. S. Ramos, P. G. Prohaska, D. D.
Gennero,
D. D. Dungan, M. Y. Uyeda, and W. D. MacLeod.
1979.
Investigation of petroleum in the marine environs of
the Strait
of
Juan de Fuca and Northern Puget Sound, 107 p.
NOAA Tech. Memo. ERL-MESA, EPA-600-7-79-164.
Clark, R. C., and M. Blumer. 1967.
Distribution of N-Paraffins
in marine organisms and sediment.
Limnol. & Oceanogr.
12:79-87.
Cooney, R. T.
1987.
Zooplankton.
In D. W. Hood and S. T.
Zimmerman (editors), The Gulf of Alaska - Physical
environment and biological resources.
Minerals Management
Service Pub. No. OCS Study, MMS 86-0095.
U. S. Government
Printing Office, Washington, D. C.
Eglinton, G.,
and R. J. Hamilton.
1967.
Leaf epicuticular
waxes.
Science 156:1322-1335.
33
Eglinton, G.,
A. G. Gonzalez, R. J. Hamilton, and R. A. Raphael.
1962.
Hydrocarbon constituents of the wax coating of plant
leaves:
a taxonomic survey.
Phytochemistry 1:89-102.
Farrington, J. W., N. M. Frew, P. M. Gschwend, and B. W. Tripp.
1977.
Hydrocarbons in cores of Northwestern Atlantic
coastal and continental margin sediments.
Estuarine Coast.
Mar. Sci.
5:793-808.
Galt, J.A.,
W.J. Lehr, and D.L. Payton.
1991.
Fate and
transport of the Exxon Valdez oil spill.
Environ. Sci.
Technol.
25:202-209.
Hanson,
S. W. F.,
and J. Olley.
1963.
Application of the Bligh
and Dyer method of lipid extraction to tissue homogenates.
Biochem. J. 89:101-102.
Hites, R. A.
1981.
Sources and fates of atmospheric polycyclic
aromatic hydrocarbons. In E. S. Macias and P. K. Hopke
(editors),
Atmospheric aerosol, source/air quality
relationships, p. 187-196.
ACS Symp. Ser. 167, American
Chemical Society, Washington, D. C.
Hites, R. A.,
R. E. LaFlamme,
and J. W. Farrington.
1977.
Sedimentary polycyclic aromatic hydrocarbons: the historical
record.
Science 198:829-831.
Hites, R. A.,
R. E. LaFlamme, and J. G. Windsor.
1980.
Polycyclic aromatic hydrocarbons in marine/aquatic
sediments:
their ubiquity.
In L. Petrakis and F. T. Weiss
(editors), p. 289-311.
Petroleum in the Marine
Environment.
ACS Symp. Ser.
185, American Chemical Society,
Washington, D. C.
Ikan, R.,
M. J. Baedecker, and I. R. Kaplan.
1975.
Thermal
alteration experiments on organic matter in recent marine
sediment - II. Isoprenoids.
Geochem.
Cosmochim. Acta
39:187-194.
Jackson, M. L.
1958.
Soil chemical analysis.
Prentice-Hall,
Inc.
Englewood Cliffs, New Jersey.
498 p.
Kolattukudy, P. E.
1976.
Chemistry and biochemistry of natural
waxes.
Elsevier, New York.
459 p.
Krumbein, W. C., and F. J. Pettijohn.
1938.
Manual of
sedimentary petrography.
Appleton Century Crofts, Inc.
New
York, New York.
549 p.
Lake, J. L., C. Norwood, C. Dimock, and R. Bowen.
1979.
Origins
of polycyclic aromatic hydrocarbons in estuarine sediments.
Geochim.
Cosmochim. Acta 43:1847-1854.
34
Lunde, G., and A. Bjorseth.
1977.
Polycyclic aromatic
hydrocarbons in long-range transported aerosols.
Nature
268:518-519.
Nissenbaum, A.,
M. J. Baedecker, and I. R. Kaplan.
1972.
Organic geochemistry of Dead Sea sediments.
Geochim.
Cosmochim. Acta 36:709-727.
Oro, J.,
T. G. Tornabene, D. W. Nooner, and E. Gelpi.
1967.
Aliphatic hydrocarbons and fatty acids of some marine and
freshwater microorganisms.
J. Bacterial. 93:1811-1818.
Oro, J.,
D. W. Noonor, A. Zlatkis, S. A. Wikstrom, and E. S.
Barghoorn.
1965.
Hydrocarbons of biological origin in
sediments about two billion years old.
Science 148:77-79.
Venkatesan, M. I.
1988.
Occurrence and possible sources of
perylene in marine sediments - a review.
Mar.
Chem. 25:1-
27.
Venkatesan, M. I., and I. R. Kaplan.
1982.
Distribution and
transport of hydrocarbons in surface sediments of the
Alaskan outer continental shelf.
Geochim.
Cosmochim. Acta
46:2135-2149.
Winters, K., P. L. Parker,
and C. Van Baalen.
1969.
Hydrocarbons of blue green algae: geochemical significance.
Science 163:467-468.
Youngblood, W. W., and M. Blumer.
1975.
Polycyclic aromatic
hydrocarbons in the environment: homologous series in soils
and recent marine sediments.
Geochim.
Cosmochim. Acta
39:1303-1314.
35
APPENDIX

Table A-l
.--Concentrations of alkane analytes found in sediment samples at each sampling period and sampling station of this study. Concentration
units are ng alkane/g dry sediment weight.
Concentrations less than detection Limits are indicated by the symbol <, followed by the
detection limit estimate of that alkane analyte in that sample.
Identities of abbreviated alkanes are given in Table 2 of the text.
Also listed is total organic carbon (TOC) for each sample where determined, presented as g carbon/g dry sediment weight times 100%.
MAY
MAY
JUNE JUNE OCT OCT MAY MAY
JUNE
JUNE
AUG AUG MAY
AUG AUG
1977 1977 1977 1977 1977 1977 1978
1978
1978
1978 1978
1978 1979 1979
1980
MEAN
Bligh Island

Table A-l
.--Continued.
MAY MAY
JUNE
JUNE
MAY MAY
JUNE JUNE
AUG
AUG MAY
AUG AUG
1977 1977 1977 1977 1978 1978
1978 1978
1978 1978 1979
1979 1980
MEAN
Constantine Harbor

Table A-l.--Continued.
MAY MAY JUNE
JUNE
OCT
OCT
MAY MAY
JUNE
JUNE
AUG AUG MAY AUG AUG
1977 1977 1977 1977
1977 1977 1978 1978 1978 1978
1978 1978 1979 1979 1980 MEAN
Dayville Flats

Table A-l
.--Continued.
MAY MAY
AUG AUG MAY
AUG AUG
1978
1978 1978 1978 1979
1979 1980
MEAN
Mineral Flats
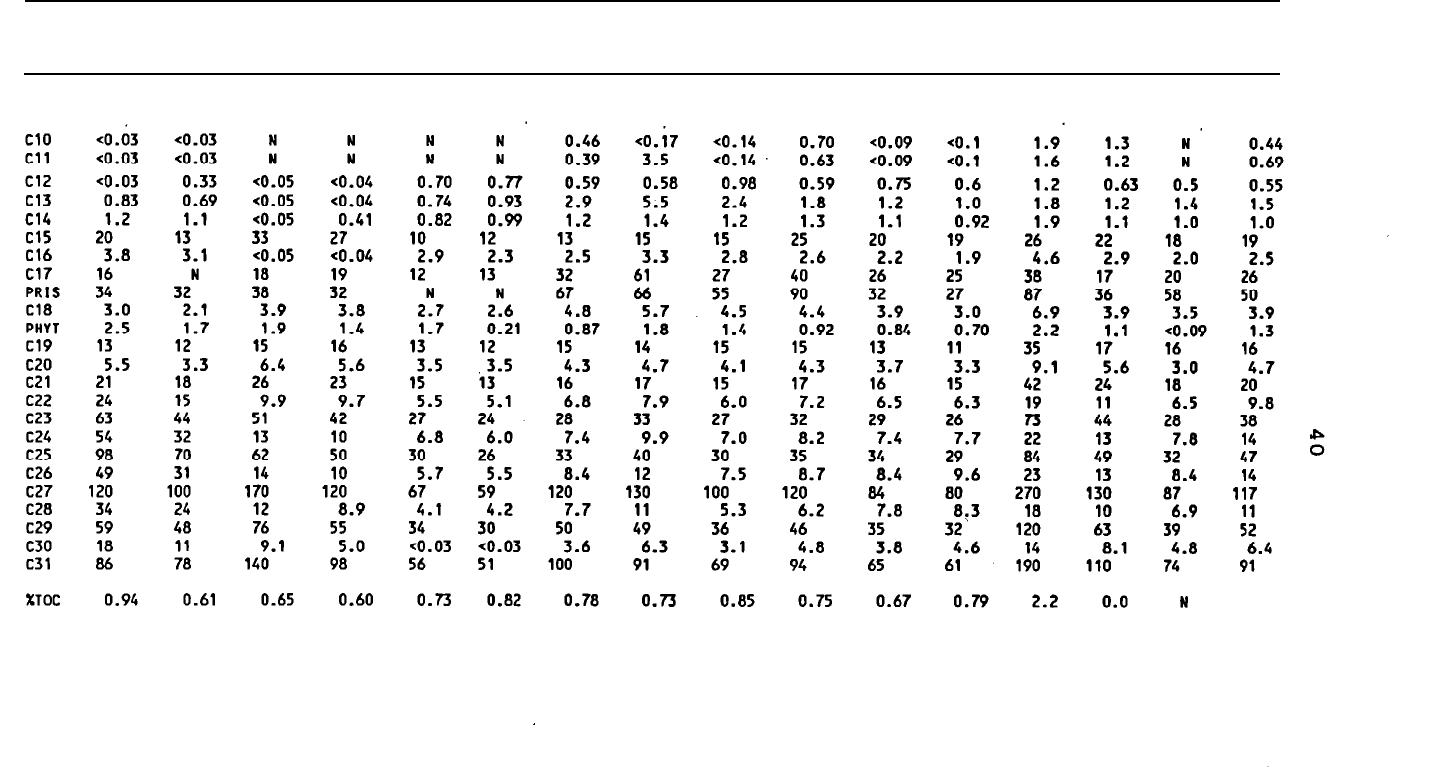
Table A-l .--Continued.
MAY
MAY
JUNE
JUNE OCT
OCT
MAY
MAY JUNE
JUNE
AUG AUG
MAY
AUG
AUG
1977 1977
1977
1977 1977 1977
1978
1978 1978
1978
1978 1978
1979 1979
1980
MEAN
Naked Island

Table A-l
--Continued.
MAY
MAY
JUNE
JUNE
AUG
AUG MAY AUG
AUG
1978 1978 1978 1978
1978
1978
1979 1979 1980
MEAN
Olsen Bay

Table A-l
.--Continued.
JUNE
JUNE
MAY MAY JUNE
JUNE
AUG AUG MAY AUG
1977 1977 1978 1978 1978
1978
1978 1978
1979
1980 MEAN
Rocky Bay

Table A-l
.--Continued.
JUNE
JUNE
OCT
OCT MAY
MAY
JUNE JUNE
AUG AUG MAY AUG AUG
1977
1977 1977
1977 1978
1978 1978
1978
1978
1978
1979
1979 1980
WEAN
Siwash Bay

Table A-2:-Concentrations of alkane analytes found in mussel tissue samples at each sampling period and sampling station of this study.
Concentration units are ng alkane/g dry tissue weight.
Concentrations Less than detection limits are indicated by the symbol <,
followed by the detection Limit estimate of that alkane analyte in that sample.
Identities of alkanes abbreviated below are given in
Table 2 of the text.
Al
SO
Listed is percent lipid content for each sample where determined, presented as g lipid/g dry tissue weight
times 100%.
MAY MAY
JUNE
JUNE
OCT
OCT
MAY MAY
JUNE
JUNE
AUG
AUG
MAY AUG AUG
1977 1977 1977 1977 1977 1977 1978 1978 1978 1978 1978
1978
1979 1979 1980 MEAN
Bligh Island
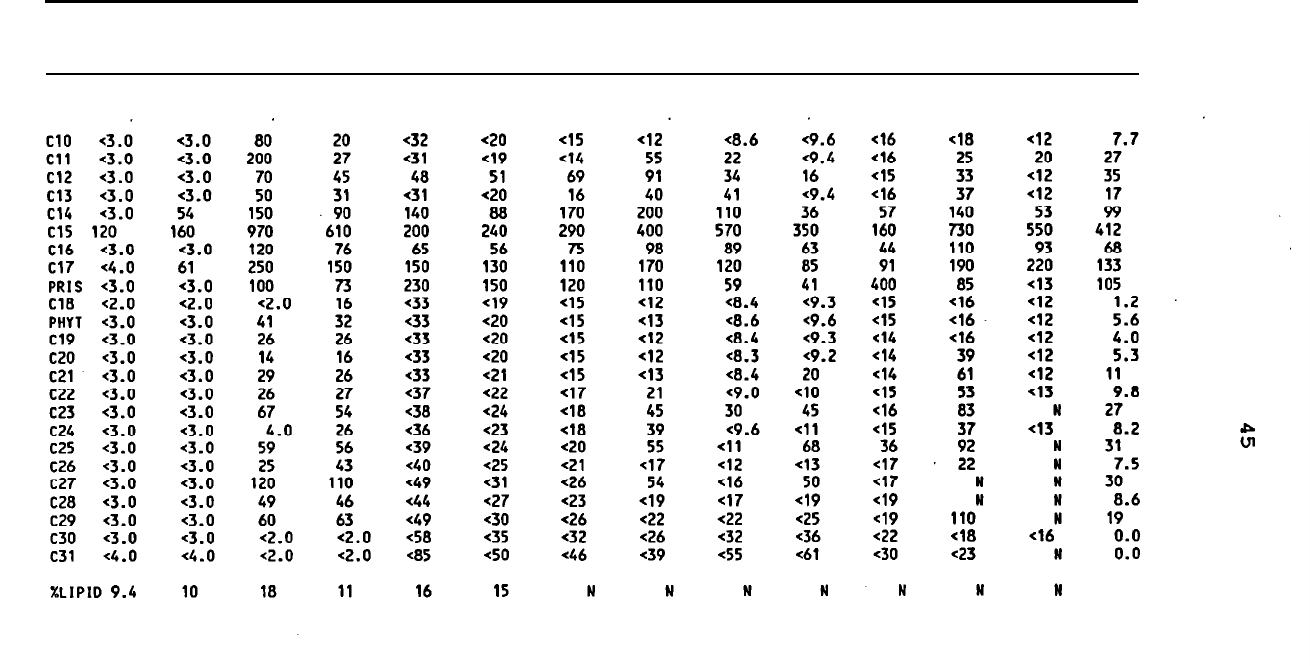
Table A-2:-Continued.
MAY MAY
JUNE
JUNE
MAY MAY
JUNE
JUNE AUG
AUG
MAY AUG
AUG
1977 1977 1977
1977 1978 1978
1978 1978 1978
1978
1979
1979
1980
MEAN
Constantine Harbor

Table A-2.
--Continued.
MAY
MAY
JUNE
JUNE
OCT
OCT
MAY HAY
JUNE JUNE
AUG AUG MAY AUG
AUG
1977 1977
1977 1977
1977 1977
1978 1978
1978
1978
1978 1978
1979 1979
1980 MEAN
Dayville Flats
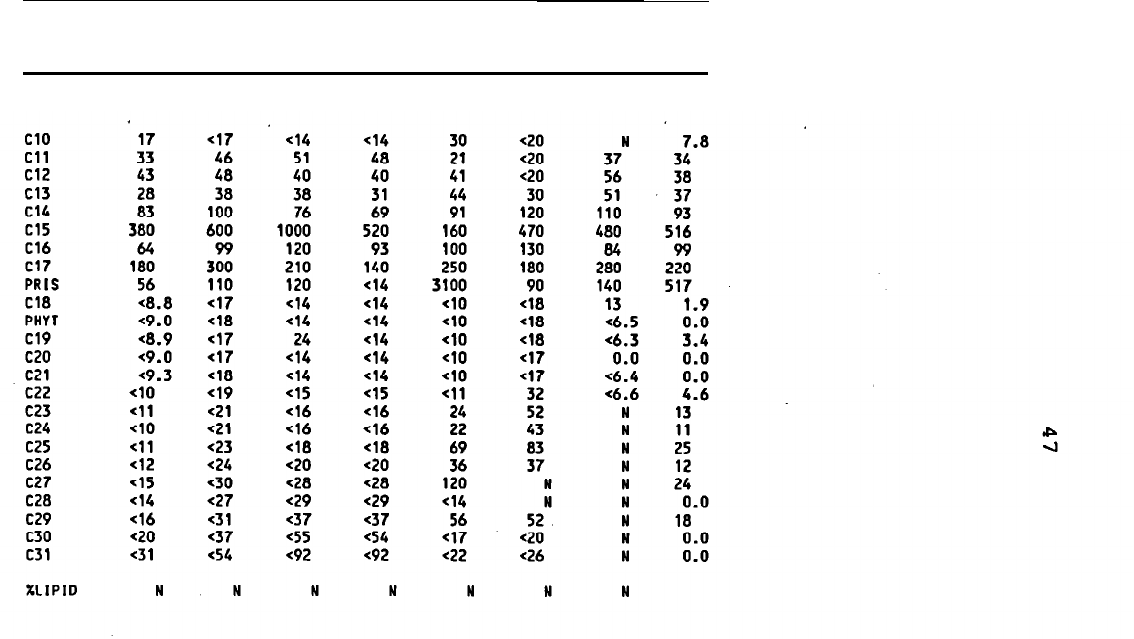
Table A-2. --Continued.
JUNE
JUNE AUG AUG
MAY
AUG AUG
1978 1978
1978 1978
1979 1979
1980
MEAN
Mineral Flats

Table A-2. --Continued.
MAY MAY JUNE
JUNE
AUG AUG
MAY AUG
AUG
1978 1978 1978 1978 1978
1978
1979 1979 1980 MEAN
Olsen Bay

Table A-2
.--Continued.
JUNE JUNE
MAY
MAY
JUNE
JUNE
AUG
AUG
MAY
AUG AUG
1977
1977
1978
1978
1978 1978
1978 1978
1979
1979
1980
MEAN
Rocky Bay

Table A-2.
--Continued.
JUNE JUNE
OCT
OCT MAY
MAY
JUNE
JUNE
AUG AUG
MAY
AUG
AUG
1977 1977 1977 1977 1978
1978 1978
1978
1978
1978 1979 1979 1980
MEAN
Siwash Bay

Table A-3.--
Concentrations of aromatic enalytes found in sediment samples at each sampling period and sampling station of this study. Concentration
units are ng alkane/g dry sediment weight.
Concentrations less than detection limits are indicated by the symbol <, followed by the
detection limit estimate of that aromatic analyte in that sample.
Identities of aromatics abbreviated below are given in Table 2 of the
text.
MAY MAY
JUNE
JUNE
OCT OCT MAY MAY
JUNE
JUNE AUG AUG MAY
AUG AUG
1977 1977
1977
1977
1977
1977 1978
1978 1978
1978 1978
1978
1979
1979 1980
MEAN
Bligh Island

Table A-3.
--Continued.
MAY MAY JUNE JUNE MAY MAY JUNE
JUNE
AUG
AUG
MAY
AUG
AUG
1977
1977 1977
1977 1978
1978 1978
1978 1978
1978 1979
1979 1980
MEAN
Constantine Harbor

Table A-3.--Continued.
MAY MAY
JUNE
JUNE
OCT
OCT MAY
MAY
JUNE
JUNE
AUG
AUG
MAY
AUG
AUG
1977 1977
1977
1977 1977
1977
1978 1978
1978
1978
1978
1978
1979 1979
1980
MEAN
Dayville Flats

Table A-3. --Continued.
JUNE
JUNE
AUG
AUG MAY
AUG
AUG
1978 1978
1978 1978 1979
1979
1980
MEAN
Mineral Flats

Table A-3.--Continued.
MAY MAY
JUNE
JUNE
AUG AUG
MAY
MAY JUNE
JUNE
AUG AUG HAY AUG
AUG
1977
1977
1977 1977 1977 1977
1978
1978 1978
1978 1978
1978 1979 1979
1980
MEAN
Naked Island

Table A-).--Continued.
MAY
MAY
JUNE
JUNE
AUG
AUG
MAY
AUG
AUG
1978
1978 1978 1978
1978
1978 1979
1979
1980 MEAN
Olsen Bay

Table A-3.
--Continued.
JUNE
JUNE
AUG AUG
JUNE
JUNE
AUG AUG
MAY
AUG
1977
1977 1977
1977 1978
1978
1978
1978
1979
1980 MEAN
Rocky Bay

Table A-3. --Continued.
JUNE
JUNE OCT OCT MAY MAY
JUNE
JUNE
AUG
AUG
MAY AUG
AUG
1977 1977 1977
1977 1978 1978
1978
1978
1978
1978 1979 1979
1980
MEAN
Siwash Bay

Table A-4.--
Concentrations of aromatic analytes found in mussel samples at each sampling period and sampling station of this study. Concentration
units are ng alkane/g dry mussel tissue weight.
Concentrations less than detection limits are indicated by the symbol <, followed by the
detection limit estimate of that alkane aromatic in that sample.
Identities of aromatics abbreviated below are given in Table 2 of the
text.
MAY
MAY
JUNE
JUNE OCT
OCT
MAY MAY
JUNE
JUNE
AUG
AUG
MAY
AUG AUG
1977
1977
1977
1977 1977 1977
1978 1978
1978
1978
1978
1978
1979
1979 1980 MEAN
Bligh Island

Table A-4 .--Continued.
MAY MAY JUNE JUNE
MAY MAY
JUNE
JUNE
AUG
AUG MAY
AUG
AUG
1977 1977 1977
1977 1978 1978
1978 1978 1978
1978 1979 1979
1980 MEAN
Constantine Harbor

Table A-4. --Continued.
MAY
MAY
JUNE
JUNE
OCT OCT MAY
MAY
JUNE
JUNE AUG AUG MAY
AUG AUG
1977 1977 1977 1977 1977 1977 1978 1978 1978 1978
1978
1978 1979 1979
1980
MEAN
Dayvi11e Flats

Table A-4.--Continued.
JUNE
JUNE
AUG
AUG
MAY AUG AUG
1978
1978
1978
1978
1979 1979
1980
MEAN
Mineral Flats

Table A-4.
--Continued.
MAY
MAY
JUNE
JUNE OCT
OCT MAY MAY
JUNE
JUNE
AUG AUG
MAY
AUG
AUG
1977
1977 1977
1977
1977 1977
1978
1978
1978
1978 1978
1978
1979 1979
1980
MEAN
Naked Island

Table A-4. --Continued.
MAY
MAY
JUNE
JUNE AUG
AUG MAY
AUG AUG
1978
1978 1978
1978 1978
1978 1979
1979
1980
MEAN
Olsen Bay

Table A-4
.--Continued.
JUNE JUNE MAY
MAY JUNE
JUNE
AUG
AUG
MAY
AUG
AUG
1977
1977 1978
1978 1978
1978
1978
1978
1979 1979
1980 MEAN
Rocky Bay

Table A-4.
--Continued.
JUNE JUNE
OCT
OCT
MAY
MAY JUNE JUNE
AUG
AUG MAY AUG
AUG
1977
1977 1977
1977 1978
1978 1978
1978 1978
1978 1979
1979 1980
MEAN
Siwash Bay

67
Table A-5.
Table of sediment grain-size distribution for sediment samples.
(PHI) Sediment grain size as fraction percent
Sampling
period
<-2
-2 to +0
+0 to +2 +2 to +4
+4 to +8
>+8
Mean Sand/Mud
Bligh Island
Constantine Harbor
Dayville Flats

68
Table A-5
.--Continued.
(PHI) Sediment grain size as fraction percent
Sampling
period
<-2
-2 to +0 +0 to +2 +2 to +4 +4 to +8
>+8 Mean Sand/Mud

69
Table A-5
.--Continued.
(PHI) Sediment grain size as fraction percent
Sampling
period <-2
-2 to +0
+0 to +2
+2 to +4 +4 to +8
>+8
Mean
Sand/Mud

RECENT TECHNICAL MEMORANDUMS
Copies of this and other NOAA Technical Memorandums are available from the
National Technical Information Service, 5285 Port Royal Road, Springfield, VA 22167
(web site: www.ntis.gov). Paper and microfiche copies vary in price.
AFSC-
8 WING, B. L. 1993. Winter oceanographic conditions in the eastern Gulf of Alaska, January-February
1986, 53 p. NTIS No. PB93-158335.
7 ARMISTEAD, C. E., and D. G. NICHOL. 1993. 1990 bottom trawl survey of the eastern Bering
Sea and continental shelf, 190 p. NTIS No. PB93-156677.
6 WOLOTIRA, R. J., JR., T. M. SAMPLE, S. F. NOEL, and C. R. ITEN. 1993. Geographic and bathymetric
distributions for many commercially important fishes and shellfishes off the West Coast of North America,
based on research survey and commercial catch data, 1912-84, 184 p. NTIS No. PB93-167682.
5 GUTTORMSEN, M., R. NARITA, J. GHARRETT, G. TROMBLE, and J. BERGER. 1992. Summary
of observer sampling of domestic groundfish fisheries in the northeast Pacific Ocean and Eastern Bering
Sea, 1990, 281 p. NTIS No. PB93-159085.
4 GUTTORMSEN, M., R. NARITA, and J. BERGER. 1992. Summary of U. S. observer sampling
of joint venture fisheries in the northeast Pacific Ocean and Eastern Bering Sea, 1990, 78 p. NTIS No.
PB93-127546.
3 JOHNSON, P. A., S. D. RICE, and M. M. BABCOCK (compilers). 1992. Impacts of oil pollution
and Prince William Sound studies: Bibliography of 1960-91 publications and reports, Auke Bay Laboratory,
98 p. NTIS No. PB93-114064.
2 KAJIMURA, H., and E. SINCLAIR. 1992. Fur seal investigations, 1990, 192 p. NTIS No. PB93-
109080.
1 MERRICK, R. L., D. G. CALKINS, and D. C. MCALLISTER. 1992. Aerial and ship-based surveys
of Steller sea lions (Eumetopias jubatus) in southeast Alaska, the Gulf of Alaska, and Aleutian Islands
during June and July 1991, 41 p. NTIS No. PB92-235928.
F/NWC-
216 ZENGER, H. H., JR., and M. F. SIGLER. 1992. Relative abundance of Gulf of Alaska sablefish
and other groundfish based on National Marine Fisheries Service longline surveys, 1988-90,
103 p. NTIS No. PB92-222843.
215 KINOSHITA, R. K., B. M. K. BROOKE, L. E. QUEIROLO, and J. M. TERRY. 1992. Economic status of
the groundfish fisheries off Alaska, 1990, 99 p. NTIS No. PB92-187699.
214 ANTONELIS, G. A. 1992. Northern fur seal research techniques manual, 47 p. NTIS No. PB92-191824.
213 BAKKALA, R. G., W. A. KARP, G. F. WALTERS, T. SASAKI, M. T. WILSON, T. M. SAMPLE,
A.M. SHIMADA, D. ADAMS, and C. E. ARMISTEAD. 1992. Distribution, abundance, and biological
characteristics of groundfish in the eastern Bering Sea based on results of U.S.-Japan bottom trawl and
hydroacoustic surveys during June-September 1988, 362 p. NTIS number pending.
