
Scene Connect Ltd
46A Constitution St
Edinburgh
EH6 6RS
Brampton 2 Zero
Low Carbon Options Appraisal
21
st
November 2022

2
Scene Document Reference: Brampton2Zero – Low Carbon Options Appraisal
Authors: Sandy Robinson, Dom Stephen, Alex Schlicke
Date: 18
th
November 2022
Document Revisions:
Version 1.0 Brampton2Zero – Interim Baseline Report (Draft for Comment)
Version 1.1 Brampton2Zero – Interim Baseline Report (Revised Draft for Comment)
Version 1.2 Brampton2Zero – Draft Final Report (Draft for Comment)
Version 1.21 Brampton2Zero – Draft Final Report (Final)
Scene Connect Ltd.
Address: 46A Constitution Street, Edinburgh, EH6 6RS, United Kingdom
Email: info@scene.community
Telephone: +44(0)131 603 8822
Website: www.scene.community

3
1. Introduction ...................................................................................................... 6
1.1. Brampton Context ................................................................................................................. 6
1.2. Organisations ......................................................................................................................... 7
2. Planning & Environmental Baseline .................................................................. 9
2.1. National Context.................................................................................................................... 9
2.2. Local Plan – Development within Carlisle District ............................................................... 11
2.3. Local Developments ............................................................................................................ 12
2.4. Natural & Cultural Heritage ................................................................................................. 12
2.5. Local Electricity Network ..................................................................................................... 14
3. Baseline Energy Assessment ........................................................................... 16
3.1. Methodology ....................................................................................................................... 16
3.2. Energy Demand Assessment ............................................................................................... 17
3.3. Climate Change & Action in Brampton ............................................................................... 20
4. Technical Appraisal ......................................................................................... 22
4.1. Solar Photovoltaics .............................................................................................................. 22
4.2. Solar Cooperative Engagement ........................................................................................... 22
4.3. Solar Capacity Assessment .................................................................................................. 23
4.4. Solar PV Energy Modelling .................................................................................................. 26
4.5. Electric Vehicle (EV) Car Club .............................................................................................. 30
5. Financial Appraisal .......................................................................................... 33
5.1. Solar Co-operative ............................................................................................................... 33
5.2. Domestic Properties ............................................................................................................ 35
5.3. EV Car Club .......................................................................................................................... 36
6. Commercial & Governance ............................................................................. 38
6.1. Energy Cooperatives ............................................................................................................ 38
6.2. EV Car Clubs ......................................................................................................................... 41
7. Funding & Finance .......................................................................................... 43
8. Conclusions ..................................................................................................... 46
8.1. Solar Cooperative ................................................................................................................ 46

4
8.2. EV Car Club .......................................................................................................................... 46
8.3. Project Roadmap ................................................................................................................. 47
Appendix A – Financial Details ................................................................................. 48
Appendix B – Technical Details ................................................................................. 50
Appendix C – Community Engagement .................................................................... 51

5
FIGURES
FIGURE 1.1 - MAP OF BRAMPTON PARISH AND THE BRAMPON CONSERVATION AREA. 7
FIGURE 2.1 - MAP OF CULTURAL HERITAGE DESIGNATIONS WITHIN AND NEARBY BRAMPTON. 13
FIGURE 2.2 - MAP OF NATURAL HERITAGE DESIGNATIONS WITH AND NEARBY BRAMPTON. 14
FIGURE 2.3 - LOCATION OF NEAREST PRIMARY SUBSTATION TO BRAMPTON. 15
FIGURE 3.1 – 25 NON-DOMESTIC BUILDINGS WITHIN AND AROUND BRAMPTON INCLUDED WITHIN THIS STUDY. 16
FIGURE 3.2 – ENERGY DATA HIERARCHY 17
FIGURE 3.3 – NON-DOMESTIC ELECTRICITY DEMAND IN BRAMPTON. 18
FIGURE 3.4 - ANNUAL ELECTRICITY DEMAND PROFILE FOR NON-DOMESTIC PROPERTIES IN BRAMPTON 18
FIGURE 3.5 – SURVEY RESPONDENT TYPES 20
FIGURE 3.6 – SURVEY RESPONDENTS’ VIEWS ON CLIMATE CHANGE 20
FIGURE 3.7 – RESPONDENTS' ACTIONS TO ADDRESS CLIMATE CHANGE 21
FIGURE 4.1 – LEVEL OF INTEREST IN A SOLAR PV COOPERATIVE IN BRAMPTON 23
FIGURE 4.2 - A 165.75 KW ARRAY SIMULATED ON THE ROOFTOPS OF THE BUILDING 17. 25
FIGURE 4.3 - A 30 KW ARRAY SIMULATED ON THE BUILDING 4 25
FIGURE 4.4 - A 2.25 KW ARRAY SIMULATED ON THE ROOFTOP OF THE BUILDING 1. 25
FIGURE 4.5 – AN EXAMPLE DOMESTIC ROOFTOP SOLAR PV ARRAY OF 3KW 29
FIGURE 4.6 – SURVEY RESPONDENTS' INTEREST IN A BRAMPTON EV CAR CLUB 30
FIGURE 4.7 – SURVEY RESPONDENTS' VIEWS ON HOW THEY WOULD USE AN EV CAR CLUB IN BRAMPTON 31
FIGURE 4.8 – MAP OF EV CAR CLUB INTEREST IN BRAMPTON 32
FIGURE 5.1 - CASHFLOW OUTCOMES FOR THE NON-DOMESTIC SOLAR PV COOPERATIVE. 33
FIGURE 5.2 - CASHFLOW OUTCOMES FOR THE NON-DOMESTIC SOLAR PV COOPERATIVE WITH BATTERY STORAGE. 34
FIGURE 5.3 – NET PRESENT VALUE FOR AN EV CAR CLUB OVER A 20-YEAR LIFETIME 37
FIGURE 7.1 – REASONS FOR COMMUNITY SHARE INVESTMENT (COOPERATIVES UK, 2020) 44
FIGURE 7.2 – SHARE / BOND OFFER JOURNEY 45
TABLES
TABLE 2.1 – RELEVANT POLICIES WITHIN THE CARLISLE DISTRICT LOCAL PLAN 2015 – 2030 ......................................... 11
TABLE 2.2 - EXISTING PLANNING APPLICATIONS RELEVANT TO THIS LOW CARBON STUDY. ........................................... 12
TABLE 2.3 – CULTURAL HERITAGE DESIGNATIONS WITHIN OR NEAR TO BRAMPTON. ................................................... 13
TABLE 3.1 - DOMESTIC ELECTRICITY DEMAND DATA FOR THE PROPERTIES WITHIN BRAMPTON. .................................. 19
TABLE 4.1 - LONGLIST OF 25 NON-DOMESTIC BUILDINGS WITHIN THE BRAMPTON STUDY ........................................... 24
TABLE 4.2 - UNIT COSTS ASSUMED FOR SOLAR COOPERATIVE CAPITAL COST ESTIMATIONS. ........................................ 26
TABLE 4.3 - OUTCOMES OF INITIAL SOLAR PV COOPERATIVE MODELLING, FOR EACH NON-DOMESTIC BUILDING. ...... 28
TABLE 4.4 - ANNUAL OUTCOMES OF SUPPLYING A TYPICAL DOMESTIC PROPERTY WITH ROOFTOP SOLAR PANELS. .... 29
TABLE 4.5 – EV CAR CLUB CHARACTERISTICS ................................................................................................................... 31
TABLE 5.1 - SOLAR VIABILITY FOR DOMESTIC PROPERTIES WITHIN BRAMPTON PARISH ................................................ 35
TABLE 5.2 – EV CAR CLUB DEMAND ASSESSMENT AND TARIFFING STRUCTURE ............................................................. 36
TABLE 5.3 – COMPARATIVE ASSESSMENT OF PROPOSED ANNUAL CAR CLUB COSTS AND CAR OWNERSHIP COSTS ..... 37
TABLE 7.1 - FUNDING OPPORTUNITIES FOR SOLAR PV AND EV INFRASTRUCTURE ......................................................... 44
TABLE 0.1 – SOLAR PV COOPERATIVE ASSUMPTIONS & VARIABLES ................................................................................ 48
TABLE 0.2 – EV CAR CLUB ASSUMPTIONS & VARIABLES .................................................................................................. 49
TABLE 0.1 - ESTIMATED ELECTRICITY CONSUMPTION AND CARBON EMISSIONS OF THE NON-DOMESTIC SITES ........... 50
TABLE 0.1 - OVERVIEW OF STAKEHOLDER TYPES AND ACTIONS ...................................................................................... 51

6
In 2022, Brampton 2 Zero (B2Z) secured funding through the UK Government Rural Community Energy Fund (RCEF)
to undertake a low carbon feasibility study in Brampton, Cumbria. This study explores local options for low carbon
energy generation and mobility in the town, focusing particularly on the development of a solar PV cooperative
across public and private rooftops, as well as EV charging and a community car club for residents and visitors.
This study forms part of B2Z’s ambitions to:
1) Create a solar energy co-operative, to reduce the town’s reliance on fossil fuels, reduce associated carbon
emissions, meet the electricity needs of multiple non-domestic rooftops, and integrate with battery
storage and electric vehicles (EVs) where appropriate;
2) Establish an EV car club in Brampton, via the installation of EV chargers in Brampton, to provide accessible
mobility services for local community use, and integrated with solar generation and battery storage;
3) Develop a low carbon business case, to reduce residents’ and local businesses’ energy bills and to
generate income for low carbon development.
This study was undertaken between June and September 2022, comprising a baseline energy and financial
assessment of energy use, costs and carbon emissions in the town, technical and commercial modelling to assess
energy generation and low carbon mobility opportunities, and a commercial roadmap to guide the development
of viable options beyond the feasibility stage.
Further information, including graphical outputs, mapping and data resources can be found in the report
appendices.
Brampton is a small market town of around 4,600 people (UK Census, 2011), located 9 miles east of Carlisle in
Cumbria, in north west England (Figure 1.1). It is situated within the City of Carlisle District of Cumbria. The town
sits at the edge of the Hadrian’s Wall world heritage site (WHS) and has several historical listed properties within
the town centre, particularly the octagonal Moot Hall, built in 1817, which now houses the town’s Tourist
Information Centre, and St Martin’s Church, the only Pre-Raphaelite church containing a famous series of stained-
glass windows which were executed in the William Morris studio.
There are 2,105 households within Brampton Parish, with the majority centred on the town itself. The area has a
relatively high average age, with around 51% of residents over the age of 65. Employment within Brampton is
generally focused on the retail, health and social care, and education sectors, with many residents commuting
elsewhere (e.g., Carlisle) for jobs. The housing stock within Brampton is varied, including historic (and listed)
properties within the town’s core and larger private housing towards the fringes of the settlement, as well as
newer housing estates and social housing located across the town.
Brampton is passed by the A69 road, and the Brampton railway station is located about a mile southeast of the
town, near the village of Milton. Services within the town include a Co-operative supermarket, medical practice,
Brampton community centre, hotel, and numerous other B&Bs, cafés, restaurants, and convenience shops. The
Townfoot Industrial Estate is located to the west of the town centre, comprising a large number of varying business
and industrial unit types. There are two schools in Brampton – Brampton Primary School and the William Howard
secondary school.
Brampton benefits from its location close to the well-connected and visited city of Carlisle to the west, which is
located on the M6 corridor and the east-west motorway which spans to the northeast of England and the
southwest of Scotland. Larger towns nearby to Brampton are also easily accessed via public transport, with the
most regular bus services running to and from Carlisle and Newcastle, as well as from the main train station.
Within the relevant Lower Layer Super Output Areas (LSOAs) for Brampton (Carlisle 002A, 002B, and 002C), UK
Government data recorded a total of 3,077 vehicles, comprising 2,486 cars, 144 motorcycles, and 447 listed as
‘other body types’, as of Q1 of 2022.

7
Between 18% of properties within the town are off gas grid, therefore using electricity or oil heating sources rather
than mains gas. This figure rises to 36% for properties outside of the town, in more rural areas. Fuel poverty rates
range between 8% (rural areas) to 11.5% (urban area), although these figures are expected to be much higher in
2022 due to increasing cost and volatility in electricity and heating fuel prices (Non-gas Map, 2022).
Brampton 2 Zero is one of several local environmental groups in Brampton: the Brampton and Beyond Community
Trust (BBCT) is a community-based development trust serving Brampton and the surrounding area. The
organisation has operated since 2010, working to develop local carbon energy schemes in the area, in particular
including a community-owned anaerobic digestion plant. BBCT aims to provide accessible, affordable, and
responsive services for local people and seeks to be self-financing. Furthermore, B2Z has a sister organisation,
Sustainable Brampton, which initiated the Brampton and Beyond Energy (BABE) group, which is planning a 500-
kW anaerobic biodigester in 2019 to support local heat, electricity, and fertiliser.
Parts of Brampton centre were designated a Conservation Area in 2003, described as "an area of special
architectural or historic interest the character or appearance of which it is desirable to preserve or enhance" and
which is included in Figure 1.1. This Area has implications for building regulations and planning permissions, among
others, for which additional scrutiny and considerations will be made before granting development proposals. Of
particular relevance to the ambitions of this project, permitted development rights for rooftop solar do not apply
within conservation areas.
Figure 1.1 - Map of Brampton Parish and the Brampon Conservation Area.
The following organisations are relevant to the study and have played a role in supporting and creating this report.
Brampton 2 Zero
Brampton 2 Zero is a Community Interest Company (CIC) set up to implement sustainable energy solutions and a
scheme for community land management in Brampton, Cumbria. Through their projects across community
woodland, home retrofits, solar panel installations, and electric vehicles, they aim to increase local biodiversity

8
and carbon sequestration and make Brampton a net carbon zero town. B2Z is working closely with local
educational institutions – including Brampton Primary School, Lanercost School, Irthington school, The William
Howard School, and Lancaster University – to develop interest and support for local low carbon projects
Rural Community Energy Fund
The Rural Community Energy Fund (RCEF) is a £10 million programme which supports rural communities in
England to develop renewable energy projects, which provide economic and social benefits to the community.
The RCEF is administrated by the North West Net Zero Hub and has provided funding for this heat network
feasibility study. The RCEF closed in April 2022 and is not expected to provide any further project funding to local
energy projects in 2022/23.
Scene
Scene Connect Ltd. (Scene) is a UK based social enterprise established in 2011 with the intention of furthering the
community energy sector. The organisation works with landowners, developers, and community groups to further
opportunities for a range of community developments, expanding from its initial focus on renewable energy,
through benefits packages, joint ventures, and wholly owned projects. Scene is the technical consultancy which
produced this feasibility study in partnership with B2Z.

9
A review of relevant environmental and planning policy and regulation in relation to low carbon development has
been carried out. The following reference sources are of relevance:
• The Climate Change Act 2008, (HM Government, 2008)
• Energy white paper: Powering our net zero future, (HM Government, 2020)
• Heat and Buildings Strategy, (HM Government, 2021)
• Carlisle District Local Plan (2015-2030)
• The Environmental Permitting (England and Wales) Regulations (2016)
There are a number of relevant UK Government policies and strategies which underpin the UK’s ambitions and
progress in relation to energy and carbon. Brampton’s low carbon ambitions fall within the aims of these policies,
meaning that any associated development proposals are expected to start with a presumption of support from a
planning policy point of view. Further information on the specifics of local planning is provided in Section 2.2.
Climate Change
The UK is a leading country in terms of climate change policy and action. It has made considerable progress,
reducing emissions by 48% on 1990 levels, including a reduction of 3% between 2018 – 2019 (CCC, 2019). This has
largely been driven by renewable power deployment and a large reduction in coal use. The UK also benefits from
a strong policy framework for climate commitments in the form of the Climate Change Act (2008).
Energy Policy
The Energy Security Strategy was published in April 2022 in the context of increasing climate change concern, the
UK cost of living crisis and Russian invasion of Ukraine. The policy reviews the UK Government’s energy strategy,
providing an approach to meeting low carbon targets whilst reducing reliance on international fossil fuel imports,
including oil and gas. The strategy sets out an ambition for 95% of the UK’s electricity to come from low carbon
sources by 2030, ahead of a complete decarbonisation target in 2035.
Zero emission vehicles
In November 2020, the UK government announced a commitment to end the sale of new internal petrol and diesel
vehicles by 2030, and that all new cars and vans will be required to be fully zero emission at the tailpipe by 2035.
More than 10% vehicles sold in 2020, and 25% in 2021 were zero or ultra-low emission vehicles. In 2019 the figure
was less than 2%. Although the expectation is that the majority of drivers will do most of their charging at home,
a public charge point infrastructure is required to support longer distance journeys and those without off-street
parking. By 2030, the Government expects "around 300,000 public charge points as a minimum in the UK, but
there could potentially be more than double that number"
1
.
National Planning Policy Framework (NPPF)
In respect to energy development, there are a number of important sections within the NPPF which are laid out
below. Whilst these sections provide the justification, guidance and policy base for energy planning, all sections
of the NPPF must be considered in respect to any planned development.
It addresses topics that are relevant to the economic, environmental, and social sustainability of development
proposals, including but not limited to:
• 2. Sustainable Development states that, ‘at the heart of the Framework is a presumption in favour of
sustainable development,’ meaning development plans should seek to promote development which meet
1
HM Government Electric Vehicle infrastructure strategy
https://assets.publishing.service.gov.uk/government/uploads/system/uploads/attachment_data/file/1065576/taking-
charge-the-electric-vehicle-infrastructure-strategy.pdf

10
the development needs of their area; align growth and infrastructure; improve the environment; mitigate
climate change; and adapt to its effects.
• 9. Promoting Sustainable Transport states that ‘the environmental impacts of traffic and transport
infrastructure should be identified, assessed and taken into account,’ in local planning. It highlights that
new development should be designed to enable charging of plug-in and other ultra-low emission vehicles
in safe, accessible, and convenient locations.
• 11. Making Effective Use of Land states that ‘Local planning authorities, and other plan-making bodies,
should take a proactive role in identifying and helping to bring forward land that may be suitable for
meeting development needs,’ which includes identifying opportunities for development, as considered
within this study.
• 12. Achieving well-designed places, highlights the need to remain sympathetic to local character and
history (including built environment and landscape setting), whilst optimising the scale and extents of
development. Where available, development must follow local design guides or the national design guide
and code in their absence.
Solar PV Array Development
Part 14 of The Town and Country Planning (General Permitted Development) (England) Order 2015 provides details
regarding the development constraints and conditions for the development of solar equipment. In general,
developments are assumed to be permitted on residential homes and blocks of flats, except when the proposed
solar array does not meet the requirements of size, spacing, and natural or cultural heritage constraints. The
document should be consulted thoroughly before a development application is considered.
Within the Brampton context there are few situations where solar PV would not be considered a permitted
development, in particular for listed properties and where rooftops are clearly visible from the nearby world
heritage site. There are also additional development constraints relevant to solar panel placement lie within the
Brampton Conservation Area, where solar panels should be situated in a way that reduces impact on the nature,
look and feel of the town. This often requires placement of panels facing away from roadways and public-facing
orientations.
This impacts particularly on domestic properties within the conservation area and several non-domestic properties
in this study.
EV Charging
Part 2 of The Town and Country Planning (General Permitted Development) (England) Order 2015 provides details
around the development conditions for installing both wall-mounted and upstanding electric vehicle charging
points. It states that planning permission is not required for the installation of either a wall mounted or upstanding
electrical outlet for recharging of electric vehicles as long as the area(s) is lawfully used for off–street parking. This
includes factors such as distance from a highway and parking space, dimensions of the charging unit, and relative
location to any scheduled monuments or listed buildings. The document should be consulted thoroughly before a
development application is considered.

11
Brampton is included within the City of Carlisle’s district ward and development jurisdiction, and therefore covered
by the policies and ambitions set forth in the Carlisle District Local Plan 2015-2030. The Local Plan outlines several
strategic objectives which themselves include multiple policy aims. Those most relevant to this low carbon study
in Brampton are outlined in Table 2.1, below.
Relevant
Strategic
Objectives
Relevant Policies
Relevant Sections
Spatial Strategy
and Strategic
Policies
SP1: Sustainable
Development
SP8: Green and
Blue Infrastructure
“To contribute to protecting and enhancing our natural, built and
historic environment (including improving biodiversity), using
natural resources prudently, minimising waste and pollution, and
mitigating and adapting to climate change including moving to a
low carbon economy.”
Infrastructure
IP 1: Delivering
Infrastructure
IP 2: Transport and
Development
“Developers will be encouraged to include sustainable vehicle
technology such as electric vehicle charging points within
proposals.”
Climate Change
and Flood Risk
CC 1: Renewable
Energy
CC 2: Energy from
Wind
CC 3: Energy
Conservation,
Efficiency and
Resilience
“Proposals for renewable energy development will be supported
where they can demonstrate, through identifying and thoroughly
appraising any potential individual and cumulative effects, that any
associated impacts are or can be made acceptable.”
“It should be noted that within Carlisle District there are a number
of additional landscape and functional constraints that may limit
renewable energy development in certain locations…”
Health,
Education and
Community
CM 3: Sustaining
Community
Facilities and
Services
CM 5:
Environmental and
Amenity Protection
“Planning has a social role to play in supporting strong, vibrant and
healthy communities, by ensuring there are accessible local
services that reflect the community’s needs and support its health,
social and cultural wellbeing”
Green
Infrastructure
GI 1: Landscapes
“The aim of the policy framework is to protect and enhance green
infrastructure assets and the functions they perform, ultimately
for the sake of their own natural value, but also through
recognition of the many wider social and economic benefits they
perform, including: the opportunities they present for positively
improving the health and wellbeing of the population; for
sustainable travel; for mitigating and adapting to climate change
and for their amenity value.”
Table 2.1 – Relevant policies within the Carlisle District Local Plan 2015 – 2030

12
Existing or planned local developments within or around Brampton may have an impact on the likelihood of future
energy developments securing planning permission. This may include future limitations on local infrastructure,
visual impact, among others, or may be an opportunity in terms of impact and cost reduction.
Relevant local planning applications and their status within Brampton, found through Carlisle City Council’s
Planning Portal are detailed in Table 2.2. There are no large applications currently in planning which affect possible
low carbon development within Brampton resulting from this study, but it is reasonable to expect that the EIA
Screening for the solar farm at Leaps Rigg will progress to a full application in due course.
Application title
Address
Application Ref No.
Decision/Status
Installation Of Solar Panels
to Southern Roof Elevation
Blacksmiths Barn,
Lanercost, Brampton,
CA8 2HG
21/0953
Grant Permission
Replacing Existing 15
Diesel Generators with
New Low Carbon Battery
Energy Storage System
Within Existing Fenced
Compound
Capon Generation
Compound, Capon Tree
Road, Brampton,
Carlisle, CA8 1QW
21/0626
Grant Permission
Request For an EIA
Screening Opinion for
Development of Solar
Farm (49,90 MW, 88.0 ha)
Leaps Rigg, Walton,
Brampton, CA8 2DZ
21/0004/ESO
Response – proposal
not likely to have
significant effects on
the environment.
Table 2.2 - Existing planning applications relevant to this low carbon study.
Natural and cultural heritage issues must be addressed to satisfy the local planning authority and to avoid or
minimise any negative impacts of low carbon implementation and installation on natural and cultural assets within
Brampton.
Cultural Heritage
A preliminary assessment of cultural heritage designations has been undertaken of locally and nationally
designated sites within and near to Brampton, presented in Table 2.3 and in Figure 2.1 . These designations may
have an impact on the development of renewable electricity assets (solar PV, wind turbine) or heat infrastructure,
including generation infrastructure, supply routes and internal works (e.g., energy efficiency measures).
Designation
Name/Description
World Heritage Site
Brampton is situated on the edge of the Hadrian’s Wall World Heritage Site (WHS),
which runs along the northern edge of the town.
Scheduled Monument
There is 1 Scheduled Monument in Brampton town centre, the Mote castle mound
and site of late medieval beacon.

13
Designation
Name/Description
Outside the western edge of Brampton’s centre, there are a further 5 scheduled
monuments.
Listed Buildings
There are 54 Listed Buildings within and around Brampton’s town centre.
Of these, 1 is Grade I listed (Church House), 52 are Grade II listed, and 1 is Grade II*
Listed (Moot Hall).
Conservation Area
Since 2003, parts of Brampton have been designated as a Conservation Area,
providing additional development and planning protection to buildings, trees, and
land within the Area.
Table 2.3 – Cultural heritage designations within or near to Brampton.
Figure 2.1 - Map of cultural heritage designations within and nearby Brampton.
Natural Heritage
Brampton is situated 2km away from a number of Sites of Special Scientific Interest (SSSI) – including the River
Eden and Tributaries (SSSI ID: 8540), the Unity Bog (SSSI ID: 4764), and the Gelt Woods (SSSI ID: 1900). The town
centre is not within or overlapping with any Green Belt, Nature Reserves, or Environmentally Protected Areas.
Figure 2.2 provides an overview of local designations.
Proposed developments in the north of the town, closer to the World Heritage Site, may be expected to be more
restricted than elsewhere.
As both Solar PV and EV charging infrastructure are permitted development (GDPO, 2015), it is unlikely that
problems would occur in relation to any of the designations noted above. The most likely constraint is expected
to be the positioning of solar PV panels to face away from, or be restricted in views from, the WHS. Due to the

14
fact that the WHS is to the north of the town and the preference for south facing solar PV panels, this is unlikely
to be an issue for the proposed development.
Figure 2.2 - Map of natural heritage designations with and nearby Brampton.
A review of the local electricity network is necessary to understand the renewable electricity generation and
connection potential within and around Brampton, which is serviced by the local Distribution Network Operator
(DNO), Electricity North West (ENW).
ENW’s network capacity heatmap shows that the closest primary substation for potential future connection is
around 1.4km from the centre of Brampton, just south of the Brampton Bypass (Figure 2.3). It is a 33 kV / 11 kV
substation, named ‘Capontree’ with significant headroom and connectivity potential for new sources of both
demand and generation (Figure 2.1Figure 2.3). A more detailed phone call with ENW’s Low Carbon Connections
Advisor noted that a grid connection assessment for solar PV and EV chargers would be required on a per-site
basis, to ensure that the expected voltage rise and transformer capacity are suitable to support such new
connections. ENW would fund the cost of additional connections required for domestic properties but not for
commercial sites.
Local use of energy is the preferred option in nearly all instances, as it offsets high energy costs on site. Export to
the national grid will be assessed in regard to larger scales of generation as well as excess generation after local
energy demand has been satisfied.
The expected cost of any new local grid connections will be provided by ENW following a grid connection
application for the project. Our discussions with ENW found that a single application comprising the multiple sites
would be acceptable, though likely requiring longer review time than timeframes specified for standard single-site
applications. Before submitting the application, a pre-application meeting can be arranged with ENW’s
engagement team to discuss the details of the application requirements, client expectations, and expected
turnaround time. Expected connection costs are not known until ENW’s technical assessment has been completed.

15
Figure 2.3 - Location of nearest primary substation to Brampton.

16
This chapter provides an overview of the current energy situation across key sites of interest within Brampton,
including both electricity and heating. This baseline energy information is a critical building block in understanding
the low carbon energy options available to Brampton and the associated economic, social, and environmental
impacts.
The electricity demand from the 25 sites listed below are those considered within this baseline assessment (Table
3.1), to be enable scaling of solar PV generation options and EV charging locations. Sites were selected based on
level of interest demonstrated by owners / tenants and suitability of buildings for solar PV generation.
Further to this, aggregate energy demand across all domestic properties has been highlighted in Table 3.1.
Individual solar PV assessments have not been conducted for any residential sites due to the high number of
properties.
Figure 3.1 – 25 non-domestic buildings within and around Brampton included within this study.
Energy data from these sites was collected through correspondence with relevant property owners, council
members, and other representatives of Brampton throughout July and August 2022 via email and online video
calls. This data included:
• Spatial and planning information, such as site maps, building plans, and planning proposals;
• Energy and technical data, such as energy consumption, fuel use, and building Energy Performance
Certificates (EPCs);
• Building and land use types;
• Times of use.

17
An initial site visit was conducted by Scene in June 2022.
A hierarchy of data sources was used to ensure the greatest level of detail and accuracy possible, whilst ensuring
the full coverage of relevant assets required to form an accurate energy baseline (Figure 3.2). Where real and
reliable data (smart metering, energy billing) was not available, prior EPC data has been used and applied to
standardised domestic and non-domestic energy demand profiles to generate demand profiles. Where EPCs are
unavailable or out of date, energy modelling based on building size, type, age, and use was used to generate
demand profiles. Due to the COVID-19 pandemic affecting typical energy profiles over 2020 – 2021, a preference
for 2019 (pre-pandemic) data was used in this study.
Figure 3.2 – Energy Data Hierarchy
Energy consumption data for the majority of the relevant buildings was provided in the form of monthly energy
bills per site between 2019 and 2022. To this monthly and annual energy demand dataset, a series of hour-by-
hour energy use profiles was able to be applied, suited to each building type and times of use. This process was
also supported by the client, who gave details on visitor and staff numbers, opening and closing times of the
various sites, and any relevant holidays, to inform a more accurate energy use profile of sites across the year.
Total baseline energy demand across the 25 sites amounts to 3,156 MWh per year, with an estimated further
8,951 MWh per year of electricity demand across domestic properties within Brampton.
Figure 3.3 provides an overview of non-domestic electricity demand across properties in Brampton. This
demonstrates that there are several properties with very high usage – including the William Howard School and
Make-Believe Ideas. Further to this, there is a concentration of high demand properties on the Townfoot Estate,
west of the town.
Figure 3.4 provides an overview of total energy electricity demand for the non-domestic properties in this study
within Brampton over a typical year. The profile demonstrates peak demand loads in the winter months and lower
demand throughout the summer and autumn months. This variance in heating energy demand is predominantly
due to use of electric sources of light and heating within those properties used more often during the winter
months, including electric heating systems and fireplaces, portable radiators, electric blankets, and evening lamps.
Metering and billing data was provided for 4 properties, with EPC and / or CIBSE benchmarking utilised to
understand electrical loads at wider non-domestic properties in Brampton. Understanding of exact electricity
demand, via energy metering or billing, is necessary to fully understand the case for a solar PV cooperative in
Brampton. Further detail on non-domestic property electricity demand and carbon emissions can be found in
Appendix B.
Smart metering
(Half Hourly)
Energy / Fuel
Billing (Annual)
Partial Energy /
Fuel Billing
(monthly)
Energy
Performance
Certificates
(EPC)
Energy Profiling
&
Benchmarking

18
Figure 3.3 – Non-domestic electricity demand in Brampton.
Figure 3.4 - Annual electricity demand profile for non-domestic properties in Brampton

19
Whilst non-domestic properties form the core of this study, both in terms of understanding demand and as
potential solar cooperative members, an understanding of local domestic demand may enable a greater number
of lower demand cooperative members.
In total, there are 2,296 properties in Brampton, therefore a full appraisal of electricity demand is not feasible
with real world data. Using average electricity demand values and profiles for the North West of the UK, it is
projected that domestic properties use ~8,908 MWh of electricity a year. This is significantly greater than the total
non-domestic demand in Brampton and demonstrates the scale of the opportunity for aggregating domestic
properties within a solar PV cooperative.
Based on an average solar PV installation size of 4kWp, these properties have a combined solar PV capacity
potential of 9.2 MW. In reality, only a moderate proportion of properties will be able to install solar PV: from
excluding those with existing solar PV arrays, unsuitable orientations, a lack of interest, siting within the Brampton
Conservation Area, or other development constraints. Further scenario analysis of potential domestic solar PV
capacity and generation is provided in Chapter 4.
Domestic Energy Demand and Emissions
Total number of households
2,296
Average annual domestic electricity
consumption
3,880 kWh
Total domestic electricity consumption,
per year
8,908,480 kWh
(8,908 MWh)
Total CO
2
e emissions, per home
76.7 tCO
2
e
Potential domestic solar PV array scale
9,184 kWp
Based on an average installed capacity of 4kW per household
Table 3.1 - Domestic electricity demand data for the properties within Brampton.
3.2.1. Carbon Emissions
Total annual carbon emissions resulting from electricity generation across all sites was calculated using an
electricity carbon factor of 0.19338 kg CO
2
e per kWh of grid electricity assumed, and a gas carbon factor of 0.180
kg CO
2
e per kWh of natural gas consumed. Both figures are provided by the UK Government’s Greenhouse gas
reporting: conversion factors data for 2022.
Using these assumptions, total carbon emissions from the 25 sites within the study amounts to 610 tCO
2
e per
year. Brampton’s 2,296 domestic properties contribute a further 1,731 tCO
2
e, bringing the total carbon emissions
throughout Brampton to 2,341 tCO
2
e.
Demand and emissions figures only account for electricity consumption across the properties. Heat consumption
within Brampton is primarily from the gas grid, with around 18% of households using alternative heating fuels
such as oil and wood logs, both of which have a significantly higher carbon emissions factor than gas.

20
Low carbon projects are often underpinned by
ambitions to address the ongoing climate
emergency, whether through reducing emissions
or adapting to future climatic conditions. Whilst
the financial case for low carbon projects is
essential, environmental metrics (e.g., carbon
emissions reduction) can provide a justification
even when the financial case is marginal.
Part of the Brampton community energy survey
focused on locals’ views in relation to climate
change and the actions undertaken by residents
to address the climate emergency. details
respondent types across the 180 surveys received,
with 95% of respondents Brampton residents and
/ or business owners.
Figure 3.5 – Survey respondent types
Figure 3.6 demonstrates a high level of concern in relation to the climate emergency in Brampton, with 94% of
respondents stating they are "concerned" about climate change, and 55% as "very concerned" within that number.
90% of respondents noted that they take action to tackle climate change, including:
• Reduce carbon impacts through dietary change, including consuming seasonal vegetables, less meat, and
less dairy products;
• Limit of single use plastic purchases;
• Use low carbon energy supplier and investing in home energy efficiency;
• Create greenspaces at home;
• Having fewer children;
• Buy second hand products, including clothes; or
• Limit driving and air travel.
95% of respondents also noted that they are willing to take one or more of the above actions to address climate
change in future. On average, 8% of respondents stated that they are unwilling to undertake the actions stated
above. The questions posed were aligned with a national YouGov poll issued in 2022, demonstrating that
Brampton residents have a greater awareness of, and are willing to undertake greater actions to address, climate
change.
Figure 3.6 – Survey respondents’ views on climate change

21
Figure 3.7 – Respondents' actions to address climate change
The above survey responses and analysis demonstrate that there is a large appetite for climate action in Brampton.
In particular, respondents noted an interest in activities which can be actioned at a local level – including
greenspace improvements, home energy efficiency, energy switching, and sustainable consumption. Community
energy organisations, such as Brampton2Zero, are particularly suited to supporting and enabling such activities. A
solar PV cooperative in Brampton would fulfil some of the demand for, and ambitions surrounding, low carbon
energy in Brampton. Similarly, an EV car club would help residents to address travel impacts and provide a simple
route for those interested in electric vehicles to reduce their own transport emissions.
It is important to note that surveys of this type may not be reflective of the entirety of the Brampton community.
Both respondent biases, where those with an interested in climate change and low carbon energy are more likely
to respond, and wider biases, such as time availability, internet access, and language, all play a role in defining
survey respondent types. Further information resulting from the survey can be found throughout this report and
in Appendix C.

22
This section presents the results from the technical, energy and environmental modelling of a simulated solar PV
cooperative across multiple buildings in Brampton. It details solar PV options, opportunities, and constraints for
non-domestic and domestic rooftop solar PV installations.
Solar PV (Solar Photovoltaics) is the generation of electricity using energy from the sun. Modern solar panels
produce electricity from daylight and do not require direct sunlight, although more electricity is produced on
bright, sunny days.
Enough sunlight falls onto the earth every hour to meet the
world’s power demands for an entire year, so harnessing and
using this free energy can help reduce our reliance on other
sources of energy and be beneficial to the environment as well.
By installing Solar PV panels, you can produce free, green
energy for your home or business. Solar PV panels are normally
mounted on the roof of your building although they can also be
placed on the ground when a suitable roof is not available. A
device called an inverter changes the DC electricity produced
by the panels into ‘useable’ electricity that can then be used to
power appliances in your home or can be fed back into the
National Grid. Solar PV panels contain no moving parts, are low
maintenance and roof mounted systems will typically be
adequately cleaned by rainfall.
In the UK energy market, domestic and non-domestic solar PV arrays are frequently installed across the country.
Demand for solar installations has increased dramatically in 2021 / 22 due to dramatic increases in electricity
prices. The cost of solar PV is generally on a decreasing trend, as panel performance increases and production
costs decrease. Supply chain issues resulting from the COVID-19 pandemic and increased demand has led to short
term increases in solar PV costs and material availability.
Within the Carlisle City Council area there are 341 domestic solar PV installations per 10,000 households, totalling
6.2 MWp of solar generation capacity, with a further 2.7 MW of non-domestic solar installations in the region.
Solar PV is by far the most dominant small-scale generation technology, comprising 59% of all small-scale
renewable energy generation.
Critical to the success of a solar cooperative model is the sign up of properties and locations to install solar panels
and arrays. This may be non-domestic or domestic rooftops or land where ground-mounted arrays may be
installed.
During the course of this feaisblity study, engagement with both non-domestic and domestic property owners has
demonstrated a keen interest in a solar cooperative approach in Brampton, as well as helping to identify a large
number of potential sites for devleopment. Figure 4.1 details responses from the community survey, showing that
over 100 residents were intersted in developing solar on their rooftop or land, with a further 40 respondents
unable to commit to solar PV installation but willing to invest in a local solar PV cooperative.
Qualitative responses to the survey demonstrated a wide range of reasons for a lack of interest, including:
• Respondents who did not feel solar PV was viable on their properties as they sit within the Brmapton
Conservation Zone;
• Respondents who are interested but unsure of the cooperative model and what the benefits to them
individually might be;

23
• Respondents with previous experience with solar PV rooftop leases concerned about negative impacts on
future property sales and mortgages;
• Respondents who felt that solar PV was not a suitable route forward for Brampton due to a preference
for wind energy, a lack of belief in renewable technologies, and a perception that the carbon emitted
during manufacture is greater than carbon saved through operation.
It is clear that there is a strong investor and participant interested in a solar cooperative in Brampton but further
engagement is required to detail the business model and benefits to local people.
Figure 4.1 – Level of interest in a Solar PV Cooperative in Brampton
An assessment of potential solar generation was carried out across non-domestic sites in Brampton and compared
against electricity demand profiles to explore possible cost and carbon savings for non-domestic sites and project
as a whole. Industry standard PV*SOL Premium 2021 software was used for the solar assessment, producing hourly
solar generation figures.
Assessment against energy demand profiles is an important process as it demonstrates how much electricity can
be used locally, therefore reducing high-cost energy bills (£0.28 – 0.40 / kWh). This is a preference to energy export
to the electricity grid, which offers comparatively low-income generation potential (£0.05 – 0.20 / kWh).
Throughout this study, energy bill savings through local energy use is preferred to grid export.
Table 4.1 below details the rooftops included within the solar assessment, and the potential solar capacity and
generation output of each site. Total estimated solar capacity is 1.31 MWp solar PV, producing 1,069 MWh of
solar generation per year.
Sites such as the Building 7, Building 10, Building 14, Building 17, among others, are considered as priority sites for
high potential solar generation, given their suitable rooftops and sufficient baseline demand to yield significant
cost and carbon savings.
Conversely, Unit 3 of the Townfoot Industrial Estate and Building 1 are considered particularly poor candidates for
solar generation. This is due either to the orientation and spatial characteristics of their rooftops or because their
baseline energy demand is unlikely to be great enough to derive significant cost or carbon savings.

24
Finally, the Stalker’s Transport Services building within the Industrial Estate already hosts a significant existing
solar array, and so was excluded from the study. Figure 4.2 - Figure 4.4 provide examples of rooftop solar arrays
as simulated within PV*SOL software.
#
Site Name
Solar Capacity
(kW)
PV Generation
(kWh/year)
1
Building 1
2.25
2,025
2
Building 2
13.5
12,394
3
Building 3
81.00
69,810
4
Building 4
30.00
27,726
5
Building 5
42.00
36,896
6
Building 6
11.25
9,429
7
Building 7
94.24
77,846
8
Building 8
43.5
33,620
9
Building 9
12.75
8,329
10
Building 10
249.75
181,199
11
Building 11
12
Building 12
6.38
16,310
13
Building 13
48.75
33,968
14
Building 14
97.88
85,288
15
Building 15
90.00
71,954
16
Building 16
65.63
50,656
17
Building 17
165.75
142,062
18
Building 18
31.5
27,911
19
Building 19
57
51,012
20
Building 20
40.13
32,728
21
Building 21
22.5
18,810
22
Building 22
31.5
28,383
23
Building 23
10.13
9,182
24
Building 24
22.5
9,182
25
Building 25
36.0
32,782
Totals
1.31 MW
1,069 MWh
Table 4.1 - Longlist of 25 non-domestic buildings within the Brampton study

25
Figure 4.2 - A 165.75 kW array simulated on the rooftops of the Building 17.
Figure 4.3 - A 30 kW array simulated on the Building 4
Figure 4.4 - A 2.25 kW array simulated on the rooftop of the Building 1.

26
To understand how each building’s solar PV capacity potential can provide energy and environmental benefits,
building-by-building energy modelling was undertaken to assess levels of local electricity use, export, and the
benefits of integrating electricity storage.
4.4.1. Modelling Assumptions
The potential solar cooperative comprises a total of up to 25 non-domestic buildings, including educational,
industrial, retail, and healthcare sites. A variable number of domestic residences within Brampton is also included
within the model, to simulate the possible inclusion and outcomes of residential homes within the cooperative
also. The model uses the properties’ electricity bills where available, and otherwise EPC and floor area
measurements, compared against simulated solar generation produced through the PV*SOL software described
in the previous chapter.
Electricity Prices & Tariffs
Where instantaneous electricity demand is met by solar generation, for each hour of a typical year, an electricity
cost saving is assumed, equivalent to the current unit cost of electricity at the particular site. An electricity tariff
of £0.40/kWh has been assumed across all properties in line with the 2022/23 energy price cap and through
conversations with property owners.
Where solar PV generation exceeds demand, excess electricity is modelled as exported to the electricity grid with
a typical Smart Export Guarantee (SEG) rate paid to the cooperative. While typical SEG rates are up to 0.12p / kWh
exported for individual properties, a solar cooperative comprising multiple sites could be able to negotiate a Power
Purchase Agreement (PPA) with a supplier. A PPA rate of £0.185 / kWh has been assumed within the model, based
on recent projects and rates secured by Scene.
Existing solar cooperative examples in the UK utilise lease agreements with building owners typically including a
PPA for the direct supply, where a price is agreed per kWh for use of electricity generated by the cooperative’s
solar PV array. Within all modelling it is assumed that building owners / tenants would pay a set £0.20 / kWh for
all electricity consumed from solar cooperative energy infrastructure (i.e., solar PV or battery storage). Given this
provides a substantial saving to energy bills, it is assumed there would be no cost paid to the building owner for
the rooftop rental. A different model could be required if the building owner and bill payer are different.
Carbon Emissions
Based on the UK Government’s latest Conversion factors for company reporting of greenhouse gas emissions, a
value of 0.193 kg CO2e (carbon dioxide emissions equivalent) per kWh used/avoided has been assumed.
Capital (CAPEX) and Operating (OPEX) Costs
Solar PV cost data from 2021/22 published by the UK Government (BEIS, 2021) has been used to model capital
costs for the solar arrays. These costs are provided for multiple scales of the solar installation (Table 4.2).
Further information on all assumptions made within this study can be found in Appendix A.
Battery Storage
Battery storage has been modelled to enable greater local use of electricity within the solar cooperative scenario.
Battery storage modelling assumes a 40% increase in local use of electricity, and therefore greater energy bills
savings.
Installation scale (kW)
Median £/kW installed
0-4
£1,618
4-10
£1,531
10-50
£1,016
Table 4.2 - Unit costs assumed for solar cooperative capital cost estimations.

27
4.4.2. Non-domestic Modelling
Table 4.3 below details the solar capacity, cost and carbon savings, and estimated capital costs for each of the
non-domestic properties included within the modelled cooperative.
Notable properties include the Building 5 / 6, Building 7, Building 12, and Building 13, meeting around 40% of their
annual electricity demand through solar generation. Building 1 and Building 18, on the other hand, have relatively
high demand compared to their low solar potential, and represent poor opportunities.
Particular consideration should be given to those sites within the Brampton Conservation Area (BCA in the table)
- namely, Building 1, Building 2, Building 3, Building 4, Building 20, and Building 21 - for which solar development
may be more difficult to gain approval.
Solar PV Technical and Financial Overview
Property
Solar PV
capacity
kW TIC
Demand met
by solar
(% of demand)
kWh/year
Electricity
cost
savings
£/year
Export
income
£/year
Carbon
savings
tCO
2
e/year
Estimated
cost
£
BCA
Building 1
2.3
2,025 (1%)
£810
£0
0.4
£3,641
Yes
Building 2
13.5
10,383 (18%)
£4,153
£372
2.0
£13,716
Yes
Building 3
81.0
23,640 (25%)
£9,456
£8,542
4.6
£82,296
Yes
Building 4
30.0
22,943 (19%)
£9,177
£885
4.4
£30,480
Yes
Building 5
42.0
8,102 (37%)
£3,241
£5,327
1.6
£42,672
No
Building 6
11.3
1,343 (39%)
£537
£1,496
0.3
£11,430
No
Building 7
43.5
19,365 (22%)
£7,746
£2,637
3.7
£44,196
No
Building 8
94.2
35,586 (41%)
£14,234
£7,818
6.9
£95,748
No
Building 9
12.8
5,099 (34%)
£2,039
£598
1.0
£12,954
No
Building 10
249.8
164,285 (23%)
£65,714
£3,129
31.7
£253,746
No
Building 11
6.4
9,243 (36%)
£3,697
£1,307
1.8
£9,768
No
Building 12
48.8
11,422 (36%)
£4,569
£4,171
2.2
£49,530
No
Building 13
97.9
34,130 (24%)
£13,652
£9,464
6.6
£99,446
No
Building 14
90.0
18,429 (28%)
£7,372
£9,902
3.6
£91,440
No
Building 15
32.8
4,300 (31%)
£1,720
£3,890
0.8
£33,340
No
Building 16
32.8
4,300 (31%)
£1,720
£3,890
0.8
£33,340
No
Building 17
165.8
58,341 (25%)
£23,336
£15,489
11.3
£168,402
No

28
Solar PV Technical and Financial Overview
Property
Solar PV
capacity
kW TIC
Demand met
by solar
(% of demand)
kWh/year
Electricity
cost
savings
£/year
Export
income
£/year
Carbon
savings
tCO
2
e/year
Estimated
cost
£
BCA
Building 18
31.5
27,557 (4%)
£11,023
£66
5.3
£32,004
No
Building 19
57.0
36,159 (16%)
£14,464
£2,748
7.0
£57,912
No
Building 20
40.1
25,178 (30%)
£10,071
£1,397
4.9
£40,772
Yes
Building 21
22.5
18,751 (16%)
£7,500
£11
3.6
£22,860
Yes
Building 22
31.5
14,252 (22%)
£5,701
£2,614
2.8
£32,004
No
Building 23
10.1
4,555 (22%)
£1,822
£856
0.9
£10,292
No
Building 24
22.5
9,422 (21%)
£3,769
£1,787
1.8
£22,860
No
Building 25
36.0
12,330 (25%)
£4,932
£3,784
2.4
£36,576
No
Totals
1,306
581,138 (18%)
£232,455
£92,182
112.2
£1,331,424
-
Table 4.3 - Outcomes of initial solar PV cooperative modelling, for each non-domestic building.

29
4.4.3. Domestic Modelling
According to UK Government data on domestic meter numbers within the relevant Lower Layer Super Output
Areas (LSOAs), there are 2,296 domestic properties in Brampton as of 2020. Domestic modelling assumes an
average electricity consumption of 3901.7 kWh per year, based on subnational electricity consumption statistics
data for 2020 and applies a typical domestic electricity use profile from Ofgem to plot this energy consumption
for every hour of a typical year.
A conservative estimate of 3 kW of rooftop solar was assumed for a typical household (Figure 4.5), comprising 8
modules of 375W solar PV panels. A system of this scale would generate a total of 2,717 kWh solar energy per
year in Brampton. As with the non-domestic properties, this was then compared with hourly energy demand to
estimate electricity cost saving, export income, and carbon savings (Table 4.4).
Due to a combination of rooftop size, orientation, shading, and the Brampton Conservation Area, not all the 2,296
houses will be viable for rooftop solar panels.
Further scenario analysis of the technical and financial viability of including domestic properties in a solar
cooperative can be found in Section 5.
Solar PV performance for an average domestic property in Brampton
Electricity demand (kWh/year)
3,902
Solar PV generation (kWh/year)
2,717
Demand met by solar (kWh/year) (%)
997 (26%)
Electricity cost savings (£/year)
£399
Export income (£/year)
£318
Carbon emissions savings (tCO
2
e/year)
0.2
Table 4.4 - Annual outcomes of supplying a typical domestic property with rooftop solar panels.
Figure 4.5 – An example domestic rooftop solar PV array of 3kW

30
This section provides a technical assessment of EV car club options and opportunities in Brampton. Understanding
the level of local demand for a car club, establishing potential locations for car club infrastructure (i.e., vehicles
and chargers), and optimising proposals to meet estimated levels of demand are important steps in developing an
EV car club.
There are two options presented:
1. An EV car club owned and operated by a community organisation in Brampton.
2. An EV car club operated by a commercial operator in Brampton.
All variables and assumptions used within this assessment are detailed in Appendix A.
4.5.1. Demand Assessment
The community survey conducted in June 2022 provided initial information on levels of interest in an EV car club
in Brampton. Of the 180 respondents, 110 showed some level of interest in participating in a car club.
Primary reasons for interest included those currently without access to vehicles and reliant on inconsistent public
transport, those interested in buying an EV but unable to afford one currently, and those looking to get rid of a
second car on both cost and environmental reasons.
Those uninterested stated a lack of understanding of the business model to be used, costs compared to ICE
vehicles, expected inability to use the car club due to distance from Brampton town centre, and a lack of
confidence in car club operation and EVs in general.
Figure 4.6 – Survey respondents' interest in a Brampton EV Car Club
Respondents stated how they were most likely to use an EV car club, with the greatest number of respondents
suggesting infrequent use – one to two times a month – was the most likely scenario for them. This data was input
into the demand assessment to provide a weighted annual distance assessment for typical user types (Figure 4.7).
Respondents were further asked their views on possible tariffing structures. In general, respondents requested a
daily tariff of <£10, highlighting the high costs of other car clubs (e.g., Enterprise, ZipCar) and lack of price parity
with ICE vehicle use.

31
Figure 4.7 – Survey respondents' views on how they would use an EV car club in Brampton
From survey responses and local data on transport use, a demand assessment was conducted. The proposed EV
car club has been scaled to meet local demand, ensuring there are a suitable number of vehicles and charging
points to deliver an accessible service for local people (Table 4.5).
It is important to note that this demand assessment underpins all technical and financial modelling. This is a
scenario that is supported by both local population and transport dynamics, as well as the survey responses
received. Increased demand scenarios would improve the financial viability of the scheme, though may require
greater levels of capital investment (e.g., vehicles and chargers). The opposite would be true in reduced demand
scenarios.
EV Car Club Characteristics
No.
Notes
Electric Vehicle
3
Renault Zoe (or similar)
EV Charger
3
22kW ‘fast’ charger
Number of users
110
-
Average miles per trip
20
-
Average miles per user per year
798
-
Table 4.5 – EV Car Club characteristics
4.5.2. Spatial & Technical Analysis
Spatial analysis was conducted to understanding the distribution of EV car club demand and to propose locations
for EV cars and charging infrastructure.
The community survey results suggest that the highest level of demand is in Central Brampton, as the most likely
area to have high car club demand due to having the highest population density in the area.
Figure 4.8 provides an overview of local car club demand as a heat map of the Brampton area. Access to the A6071
and A69 is a requirement, as the major trunk roads connecting Brampton to nearby settlements (e.g., Carlisle).
Several potential locations for EV cars and / or EV chargers are shown.

32
1. Townfoot Estate: position to enable access to those working on the estate and potentially make use of
solar cooperative electricity generation sites.
2. Brampton Community Centre: Positioned in the centre of Brampton with easy access to both the town
and A6071, as well as likelihood of support for any proposal.
3. William Howard School: providing access to the town and A6071, as well as providing a resource for
families and school users.
4. The White Rabbit Tearoom: providing easy access to the Brampton Bypass (A69) although limited
onwards transport into Brampton itself.
Figure 4.8 – Map of EV car club interest in Brampton
33
This section provides a financial appraisal of the options and opportunities considered within section 4. It provides
detailed financial forecasting and metrics and considers the feasibility of both solar cooperative and EV car club
projects in Brampton. Full detail on the financial variables and assumptions used within this section can be found
in Appendix A.
All financial modelling presented in this section assumes that initial financing is raised through a community share
offer with an annual return of 4%.
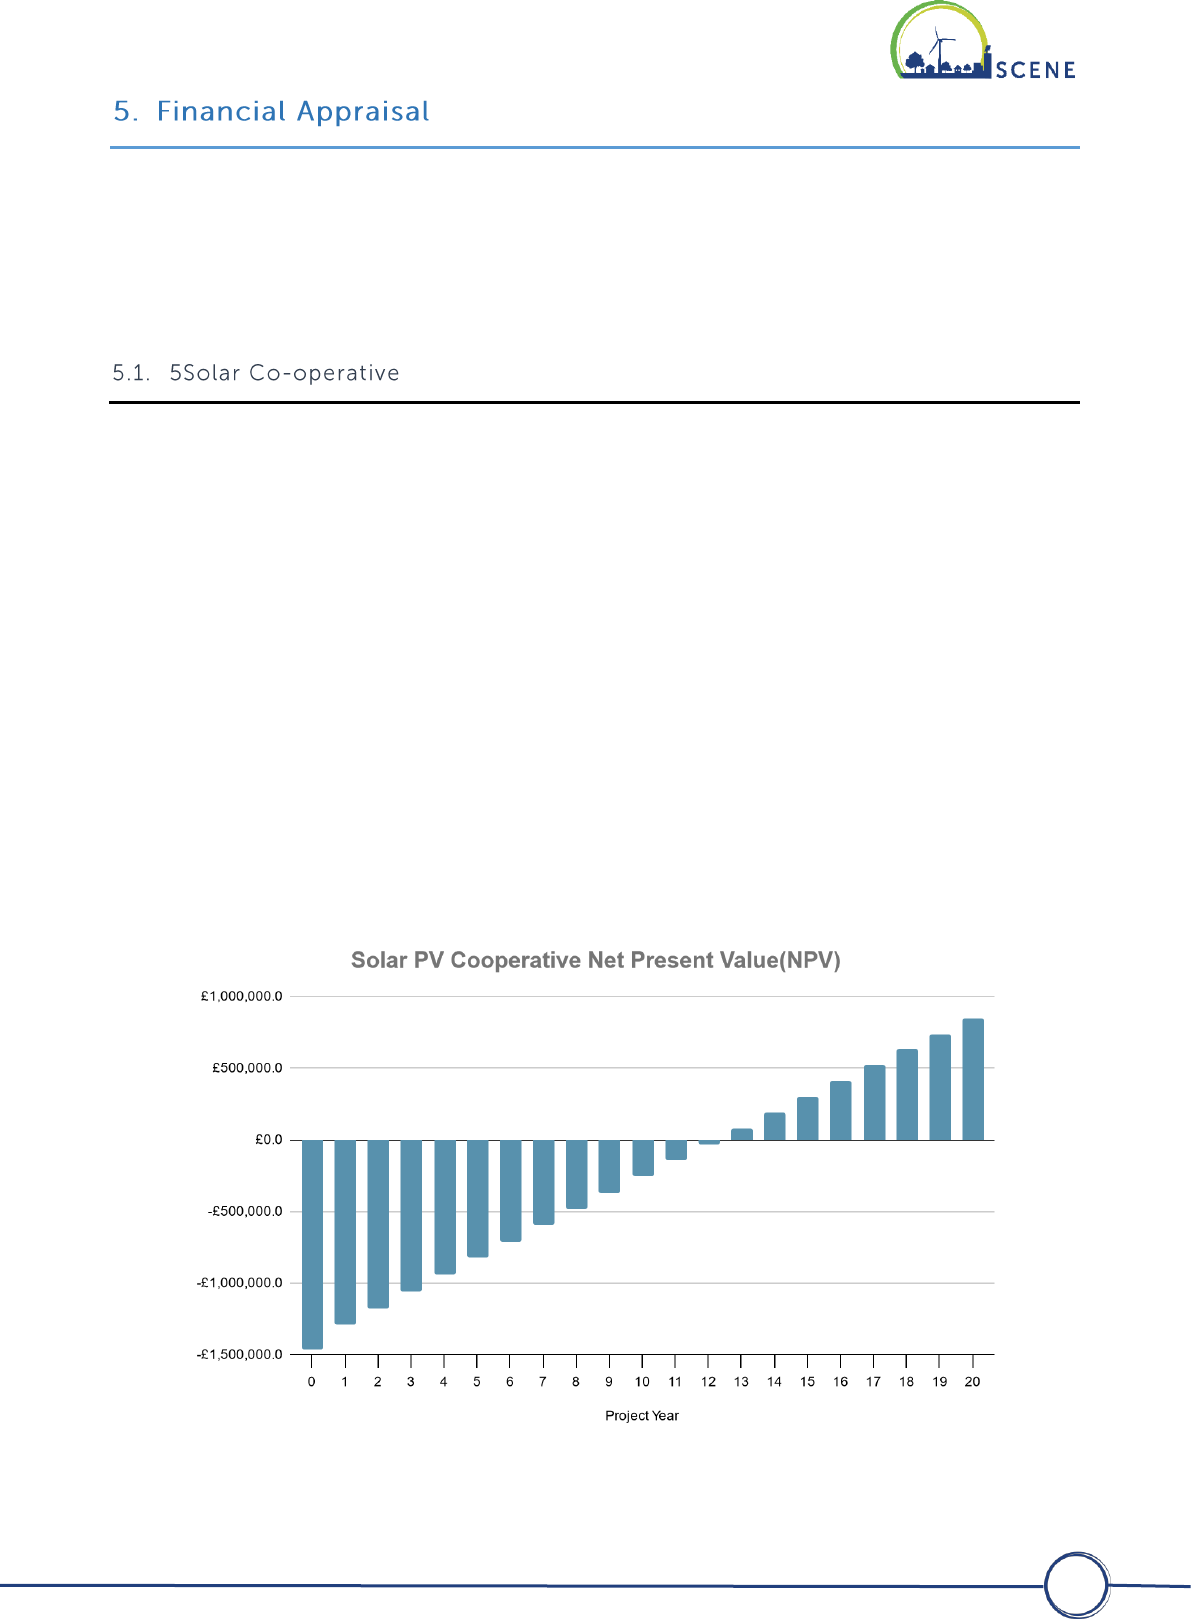
A 20-year financial model was developed for a solar cooperative based on the non-domestic properties included
within this study. Integrating domestic properties into the solar PV cooperate is expected to improve financial
viability, with greater generation potential and therefore larger income streams (Section 5.2).
Solar PV
Implementing solar PV across all non-domestic properties in the study is expected to cost £1,464,567, with an
annual running cost of £29,291, including maintenance, servicing, replacement, metering, and billing, and share
administration costs.
Income would be generated through PPAs with building owners / users (£116,228 / year), and export of electricity
(£92,182 / year). Alongside OPEX costs of £29,291, share interest of £58,583 is anticipated from year 2 onwards.
The 20-year net present value (NPV) is projected to be £847,224 with an internal rate of return (IRR) of 5%. The
project is expected to breakeven at year 13.
This is deemed to be a reasonable return over 20 years which balances several objectives:
1. Providing an income stream for the community solar cooperative to finance future system replacement costs
and / or develop further low carbon projects;
2. Providing building owners with energy bill reductions through access to solar energy via a PPA at £0.20 / kWh.
3. Providing shareholders with reasonable returns on their investment.
Figure 5.1 - Cashflow outcomes for the non-domestic solar PV cooperative.

34
Solar PV with Battery Storage
As detailed in Section 4, battery storage capacity has been modelled on a building-by-building basis. With greater
income resulting from local use over grid export, battery storage has the ability to improve the financial viability
of a solar cooperative, increase local energy use, reduce carbon emissions, and reduce cooperative members’
energy bills.
Implementing solar PV with battery storage across all non-domestic properties in the study is expected to cost
£1,927,775, with an annual running cost of £38,555, including maintenance, servicing, replacement, metering, and
billing, and share administration costs.
Income would be generated through PPAs with building owners / users (£348,683 / year), and export of electricity
(£30,727 / year). Alongside OPEX costs of £38,555, share interest of £77,111 is anticipated from year 2 onwards.
Replacement expenditure (REPEX) is included within this model for battery storage, with a cost of £347,406 at
year 10 include for the replacement of all cooperative-owned battery systems.
The 20-year net present value (NPV) is projected to be £2,808,995 with an internal rate of return (IRR) of 7%. The
project is expected to breakeven at year 8.
This shows that battery storage improves viability of the scheme, though detailed energy modelling is required on
a building-by-building basis to better understand system sizing and latent electricity use potential.
Figure 5.2 - Cashflow outcomes for the non-domestic solar PV cooperative with battery storage.

35
With a financially viable option to develop a solar cooperative with non-domestic properties in Brampton, it is
worthwhile considering the opportunities arising from involvement of domestic properties. A financial model was
created to understand the potential for solar PV development in Brampton, the costs of development and
potential benefits from the perspectives of the solar cooperative and potential members.
Table 5.1 demonstrates that 10% of domestic properties within the study (~230 properties) could support up to
0.69 MW of solar capacity. This would deliver £91,540 in aggregate cost savings to property owners / tenants, as
well as generating £118,831 in income for the solar cooperative, via export (£73,061) and building PPAs (£45,770).
Greater levels of ambition would result in capacities as high as 2.06 MW of solar installed, providing local benefits
of £274,621 and generating £356,494 for the solar cooperative per year.
The numbers detailed above have been provided as indicative scenarios and do not account for a number of
important variables, indulging:
• Size and scale of property;
• Local constraints, including cultural, environmental, and technical barriers;
• Property suitability for solar, including roof type, space, and orientation;
• Potential capital and operating costs for smaller scales of development, as would be implemented for
domestic properties.
Also, commercial rooftop lease and PPA agreements typically have a duration of 15-20 years, to provide long-term
security over the investment. These time periods may not be acceptable to many households, and consumer
protection issues may become relevant to domestic supply which are not factors for non-domestic supply.
Based on the above limitations, detailed cashflow modelling has not been conducted for domestic properties
within the solar cooperative. Further assessment should be conducted once specific properties have been
identified and owners engaged with to confirm interest and suitability for the solar cooperative proposal.
Domestic Properties Participation Level
30%
20%
10%
Number of Properties
689
459
230
Installed solar (MW)
2.06
1.38
0.69
Demand met by solar (MWh/year) (%)
26%
26%
26%
Electricity cost savings (£/year)
£274,621
£183,081
£91,540
Total income (£ / year)
£356,494
£237,662
£118,831
Export income (£/year)
£219,183
£146,122
£73,061
PPA Income (£/year)
£137,311
£91,540
£45,770
Carbon emissions savings (tCO
2
e/year)
132.5
88.3
44.2
Table 5.1 - Solar viability for domestic properties within Brampton Parish

36
This section provides an assessment of financial viability for an EV car club in Brampton. Full details on the financial
variables and assumptions used within this study can be found in Appendix A.
Demand data used within this assessment was collected through a community survey conducted in 2022. This
survey demonstrated that ~110 users were interested in an EV car club in Brampton, although with varying levels
of use type and regularity. The views of these respondents have been used to develop the below user demand
assessment and tariffing structure (Table 5.2). The proposed tariffing structure has been developed to support a
scheme which meets the required scale and use characteristics for Brampton.
Demand Assessment
Unit
Estimated number of users (annual)
110
Average number of trips / years
40
Average Trip Length
20 miles
Average annual user distance covered
796 miles
Proposed Tariffing Structure
Unit
Annual Membership Fee
£60
Fixed tariff (per journey)
£7
Variable tariff
£0.20 / mile
Table 5.2 – EV Car Club demand assessment and tariffing structure
Based on the tariffing structure, demand assessment and technical appraisal, a 20-year financial model has been
developed for an EV car club in Brampton (Figure 5.1). Implementation is expected to cost £100,500, with an
annual running cost of £29,291, including insurance, servicing, metering, and billing, software platform licences,
and administration costs.
Income would be generated through the annual membership fee (£6,600 / year), fixed tariffs for journeys (£30,646
/ year), and variable tariff payments (£17,512 / year). Alongside OPEX costs of £33,758, share interest of £865 is
anticipated from year 2 onwards. Replacement expenditure (REPEX) is included for EV and EV charger
replacement, with a cost of £54,000 at year 5, £43,200 at year 10, and £38,880 at years 15 and 20.
The 20-year net present value (NPV) of is projected to be £100,017 with an internal rate of return (IRR) of 7%. The
project is expected to breakeven at year 9.
Modelling assumes that all vehicle charging is conducted using grid supplied energy, and therefore subject to
electricity costs. If EV chargers were to be integrated with solar PV and / or battery storage to supply electricity,
then 20-year NPV is projected to be £326,387, with an IRR of 10%, breaking even in year 4.
An EV car club is therefore viable within Brampton, although it is unlikely to generate significant income due to
the high operating costs and requirements for frequent replacement cost investments. Further understanding of
local demand and acceptability of the proposed tariff structure is required to better understand the opportunity.

37
Figure 5.3 – Net Present Value for an EV Car Club over a 20-year lifetime
5.3.1. Individual User Costs
An assessment of EV car club costs to the users in comparison to ownership of a typical internal combustion engine
(ICE) vehicle is provided in Table 5.3. It demonstrates that, whilst per trip costs may be higher for EV car club users,
annual costs are significantly lower based on the average user profile. This demonstrates that an EV car club is
cheaper annually in nearly all circumstances and would remain so until a usage of 1200 miles / week. This is an
extremely unlikely use case for a car club vehicle.
Annual carbon emission from EV car club use would be 40 kg lower per year, totalling 4.4 tonnes of CO
2
e across a
user base of 110. This figure is expected to increase as EV emissions reduce due to decarbonisation of the UK
electricity grid.
Cost Category
Example Annual User Cost
Notes
EV Car Club
Non-EV Car
Ownership
Upfront Cost
£0
£2,333
Based on a £7,000 purchase price over a 36-month
payment plan
Annual
Membership
£60
£1,040
Includes Insurance, car tax, MOT, and breakdown cover
Single Journey
(20 miles)
£11
£3
Non-EV vehicle assumes petrol @ 1.65 / litre and an
average mileage of 11 miles per litre (50 miles per gallon)
Annual cost
(1 trip / week)
£572
£156
Total Annual
Cost
£632
£3,532
Average Monthly
Cost
£53
£294
CO
2
Emissions
(kg)
30.2
70.7
EV at 46.4g/mile
Petrol at 108.8g/mile
Table 5.3 – Comparative assessment of proposed annual car club costs and car ownership costs

38
This section provides an overview of the commercial and governance considerations for both solar cooperatives
and EV car club creation and operation.
Energy cooperatives share certain internationally agreed-upon principles and are organised on a fundamentally
democratic basis, often operating according to a ‘one-vote- per-member’ principle. In these cases, no shareholder
can exert disproportionate control over the cooperative as voting rights do not increase based on the amount
invested. Often only a small contribution is sufficient to become a member of the cooperative and hence, to have
a say in its future development.
There are more than 200 energy coops in the UK. These include cooperatively owned wind turbines, utility scale
and distributed solar PV arrays, and national cooperative initiatives which encompass installations in many regions
of the UK. Examples include Bristol Energy Co-operative, Brighton & Hove Energy Services Co-operative, and
Westmill Wind Farm Co-operative.
Energy cooperatives offer potential to help mobilise finance for reaching renewable energy targets, while involving
citizens and other stakeholders in the production and use of renewable energy. Those who sign up as members
can buy shares of the cooperative, which in turn owns renewable energy installations and provides a return on
investment to its members over time. Provided the energy cooperative acts as, or sells to, a licensed supplier,
members can also get access to locally produced green electricity at a fair price.
6.1.1. Solar Cooperatives
Solar Cooperatives have been set up in a variety of forms in the UK, such as community-led initiatives where solar
infrastructure is owned and operated by a cooperative organisation or where domestic or commercial members
work together to design and procure systems which are in turn owned by the property owner. This section focuses
on the former example.
In a basic sense, solar cooperatives work by developing a site or portfolio of sites (e.g., rooftops) for solar PV
implementation, therefore increasing scale of development, impact, participation and, maybe most critically,
reducing capital costs. Furthermore, a cooperative approach enables membership and therefore equitable
distribution of costs and benefits across all participating sites and members (i.e., investors).
There are several models of solar cooperative development and operation, although they follow a similar process:
1. Feasibility assessment of solar PV opportunities.
2. Onboarding of potential sites and development of a cooperative business plan across all viable sites.
3. Constitution of a cooperative organisation.
4. Detailed site design, consenting and development.
5. Development and issue of a share or bond offer and securing of wider financing requirements.
6. Procurement, installation, and commissioning of sites.
7. Project operation and administration.
Within the above process there are several options in terms of business model and revenue generation, detailed
below.
• Electricity export: This is highly likely to be a core income stream for any solar cooperative, with energy
exported to the grid and income accrued by the cooperative.
• Fixed lease agreements: This would be a simple lease agreement with the building or landowner which
enables use of the land or roof space for solar PV generation, whilst providing a nominal income to the
cooperative, often based on the scale of development.
• Variable lease agreements: This would be similar to fixed leasing but may be a variable cost based on
potential generation capacity, actual generation, or level of local energy use (i.e., direct consumption by
the building owner / tenant).

39
• Power Purchase Agreement (PPA): This would be a tariff applied to all electricity consumed by the
building owner / tenant. A PPA would be agreed for a fixed term (e.g., 1 year) and renegotiated in line
with changing electricity market prices. For example, in 2022 typical electricity tariffs are £0.30 - £0.40 /
kWh. A PPA of £0.20 would reduce costs to the building owner / tenant whilst generating income for the
cooperative. A PPA may also include a fixed rate (i.e., standing charge) to cover specific costs, such as
maintenance or replacement costs of the solar PV infrastructure or to reduce the cooperative’s exposure
to the risks of unexpectedly low energy consumption.
It is important to note that the above revenue would be utilised for a specific set of purposes, set out and agreed
in the cooperative’s constitution, including (but not limited to):
• Covering operating costs (OPEX), such as maintenance, servicing, share administration.
• Repaying capital costs (CAPEX), such as commercial loans, share or bond interest payments and
repayments.
• Accruing income for replacement costs (REPEX), such as replacement of solar PV panels, cabling, or
battery storage systems.
• Accruing income for contingency costs, often capped at a set value (e.g., 10%) in case of unexpected costs
(e.g., changes in wholesale electricity prices reducing PPA rates, sites dropping out of the cooperative,
unanticipated share repayments).
• Using income to initiate and finance wider community-led and / or low carbon projects, often via a
community benefit fund.
Case Study – Edinburgh Community Solar Cooperative (ECSC)
Edinburgh Community Solar Co-operative (ECSC) was formed in December 2013 as an Industrial & Provident
Society, which is governed by its Rules and run by a board of directors.
ECSC, supported by Energy4All, raised the required funds (£1.4 million) to install 25 solar PV arrays. This was
achieved with a public share offer, giving priority to Edinburgh residents to become members of the co-
operative by purchasing shares for a minimum of £250.
During operation, some or all of the electricity generated is used by the building, depending on internal
demand. This electricity is sold to the Council through a Licence Agreement. ECSC also receives income through
the Feed in Tariff. Any surplus electricity is exported to the grid, for which ECSC also receives income. The actual
level of income depends on the level of daylight, how much electricity is used internally and the operational
efficiency of the plant.
Each year, after operation and administration costs have been covered, share interest is paid to members. The
return on share capital is capped at 5%, which will rise with RPI each year. The surplus funds generated after
payment of share interest is allocated to the community benefit fund. By year 21, members will have all their
original investment returned and the panels will revert to the Council.

40
Case Study – The Big Solar Co-op
The Big Solar Co-op is developing a business model and organisational structure to maintain a national-scale
post-subsidy solar cooperative. By 2023 it aims to install 100MW of rooftop solar that will save nearly 40,000
tonnes of CO2 emissions a year and produce enough electricity for over 250 million miles of electric car
journeys.
The project seeks to support the expansion of the community renewables sector by taking away some of the
barriers faced by volunteer-run local community renewables groups. Through this approach, communities
work locally and as part of a UK-wide solar co-op to support the growth of its volunteer base by:
• Providing support through training and peer mentoring
• Breaking down the work into more manageable portions to enable people with less time to participate
• Bringing volunteers together with a sense of national movement with a shared low carbon vision.
The project intends to engage 250 active volunteers across 25 local groups, generate 5 new sustainable jobs,
and create ethical, accessible social investment opportunities - raising £25m and saving over £300,000 annually
on fuel bills for community buildings and social housing.
6.1.2. Cooperative Governance
Cooperatives are based on seven principles agreed by the International Cooperative Alliance:
1. Voluntary and open membership. Cooperatives are voluntary organisations, open to all persons able to use
their services and willing to accept the responsibilities of membership, without gender, social, racial, political,
or religious discrimination.
2. Democratic member control. Cooperatives are democratic organisations controlled by their members, who
actively participate in setting their policies and making decisions. People serving as elected representatives
are accountable to the membership. In primary cooperatives members have equal voting rights (one member,
one vote), and cooperatives at other levels are also organised in a democratic manner.
3. Member economic participation. Members contribute equitably to, and democratically control, the capital
of their cooperative. At least part of that capital is usually the common property of the cooperative. Members
usually receive limited compensation, if any, on capital subscribed as a condition of membership. Members
allocate surpluses for any of the following purposes: developing their co-operative; benefiting members in
proportion to their transactions with the co-operative; and supporting other activities approved by the
membership.
4. Autonomy and independence. Cooperatives are autonomous organisations controlled by their members. If
they enter into agreements with other organisations, including governments, or raise capital from external
sources, they do so on terms that ensure democratic control by their members and maintain their cooperative
autonomy.
5. Education, training, and information. Cooperatives provide education and training for their members, elected
representatives, managers, and employees so they can contribute effectively to the development of their
cooperatives. They inform the public - particularly young people and opinion leaders – about the nature and
benefits of cooperation.
6. Cooperation among cooperatives. Cooperatives serve their members most effectively and strengthen the
cooperative movement by working together through local, national, regional, and international structures.
7. Concern for community. Cooperatives work for the sustainable development of their communities through
policies approved by their members.
Currently there is no cooperative legal form in the UK, and so organisations wishing to become cooperatives must
choose one of the existing legal forms to begin operation. It is usually advisable for a cooperative, whatever its
type, to incorporate to limit the liability of its members and governing body.

41
Industrial and provident society (IPS)
It is generally accepted that the IPS route is most robust form for a cooperative. It contains statutory protection
of the cooperative principles - for example, one member one vote - and is designed to enhance democracy and
protect the rights of the members. IPSs are registered with the Financial Services Authority (FSA). The FSA
scrutinises the governing document (Rules) of applications to register as an IPS.
Before a cooperative is registered, the FSA checks to ensure that the rules meet the requirements of the Act to
register as a cooperative, and it also has the power to refuse any amendments to the rules post registration if it
believes that they are not in keeping with the original ethos of the society. IPS’s are permitted to issue shares to
the public, so if a cooperative - particularly a community co-operative - wishes to raise funds from the public then
the IPS legal form is probably the most appropriate one to choose.
BenComs are a form of Industrial and Provident Society (IPS) and are a type of co-operative enterprise. BenComs
are managed by an elected Board of Directors and owned by members (shareholders). Shares in BenComs are a
form of ethical investment: members receive a yearly fixed interest agreed by the members at an AGM. Unlike
shares in normal limited companies, IPS/BenCom shares cannot be sold, although they can be repaid at par by the
Society. They are also an ethical and affordable way to raise capital. See 6.2.1 for further details.
Private company limited by guarantee / shares
The limited company legal form is the most well-known. It is widely used by cooperatives and is familiar to most
advisers, professionals, and funders. Company law does not offer any protection of the cooperative principles, but
it is flexible, and its governing legislation is accessible and up to date.
Private companies limited by shares are prohibited from offering shares to the public, so if the propose
cooperative wishes to raise funds from the public this legal form should be avoided
Community interest company (CIC)
The CIC is a limited company but with special features and is available for use by organisations that wish to conduct
their business for community benefit. One of its key features is an asset lock, whereby assets of a CIC are protected
and cannot be distributed for private benefit. The asset lock may be useful for cooperatives wishing to apply for
funding or promote themselves as not-for-private profit. It is not possible for a CIC limited by guarantee to pay
dividends to members and a dividend would be subject to a cap in a CIC limited by shares. The asset lock would
also prohibit distribution of assets to members at the point of winding up.
Like limited companies, CICs don’t offer any protection of the cooperative principles and, as with a company
limited by shares, public share issues are prohibited.
There a several business models commonly employed for community-led car clubs in the UK:
Informal Car Club
Setting up and running an informal car club is not that complicated and does not involve much more work than
goes with being an individual car owner. This is typically conducted on an ad hoc basis between individuals, with
a simple management structure, agreement of responsibilities and costs, and insurance covering named drivers
across one or more vehicles.
Peer-to-peer car club
A peer-to-peer car club is a brokerage service which allows individuals who own cars to rent them out to people
who need to borrow them. The owner supplies details of their vehicle and its availability to the club, which displays
them on the central website. The club ensures that drivers are insured and handles the financial transactions.
Example operators in the UK are Hiyacar, easyCar Club and Rentecarlo.
Until recently, peer-to-peer car clubs were difficult to establish as they needed commitment from the car owner
to be available to meet the driver to hand over the keys for each booking. However, modern technology now
available means that a telematics unit can be easily installed in the owner’s car which means that the driver can
then unlock it for the time that they have booked it using a phone app.

42
Independent car club
Car clubs can be run entirely by the community for the benefit of their neighbours without depending on services
provided by third parties, but insurance can be expensive, especially for fleets with fewer than 5 vehicles.
The largest independent community car club in the UK is Moray Carshare, with 13 cars based around Findhorn in
the north of Scotland and over 100 members. It works on a trust-based system with the keys kept in a nearby
combination-lock safe, and logbooks in the car for drivers to record their journeys. This low-tech model works best
in small communities where car club members know each other. Members are relied on to only take the car during
the periods for which it is booked, and to accurately record vehicle hire times and mileage.
This system has the advantage of not needing access to a mobile phone signal but can be labour intensive for
volunteers or local employees to process data and handle billing and payment collection. Online booking providers
(e.g., SuperSaaS) and low-cost telematics (e.g., Instacar) can help to reduce this burden and the reliance on user
reporting.
National Operator License
Licensing a car club model from a national operator can reduce the burden of running a car club independently.
You will pay a monthly fee for access to the scheme, but benefits include expert advice, centralised 24hr support
for members, access to promotional materials, an online presence, being part of a national network, etc. Two
examples – Moorcar and Co-wheels – have worked with Enterprise Car Club, with a further example in Strathaven
working with Karshare for their community car club.
Commuter Car Club
Car clubs usually do not work for commuting as when you pay for the vehicle by the hour, it is expensive to have
it sitting outside offices all day. Examples, such as Wheelshare Anstruther, show that agreements with other local
or regional car clubs can enable commuter use of a car club. The Wheelshare Anstruther vehicle is used locally at
weekends by car club members, with members commuting to Dundee during weekdays, where the vehicle joins
the Co-Wheels Dundee fleet between 9am – 5pm.
6.2.1. Legal Structures
Legal structures which are suitable for community-led car club operation in England include:
Community Interest Company (CIC) - this relatively new legal form is simple to set up but requires annual
reporting to both Companies House and the CIC register. Requiring both a ‘community interest statement’ and an
‘asset lock’ charity (who will decide on disposal of assets if the company is wound up). Co-wheels, the national car
club operator is a CIC.
Co-operative Society (Co-op) – One of several types of ‘mutual societies,’ coops are set up mainly for the benefit
of its members under a democratic one-member, one-vote constitution. As previously detailed, cooperatives can
take several forms. Integration of a solar cooperative and car club cooperative may be possible, but delineation of
asset ownership and liability is critical between the two operations and may be better suited to operation under
separate but related commercial entities.
Community Benefit Society (BenCom) – another form of ‘mutual society,’ which can choose from a set of ‘model
rules,’ but modifications to ‘model rules’ take time and cost money. Differs from a Co-op in that it is set up for the
benefit of the wider community, rather than just members e.g., a group working to improve local transport
options. Regulated by the Financial Conduct Authority (FCA)
Company Limited by Guarantee (CLG) with an appropriate “asset lock” and social mission. This is the easiest
format to set up (can be as little as 2 weeks). Annual reporting to Companies House is straightforward.
Companies Limited by Guarantee, BenComs and Co-ops can also be registered as a charity with associated tax
benefits. Further information relating to car club governance, commercial structuring and operation is available
from CoMoUK, the national charity for shared transport (https://www.como.org.uk).

43
Table 7.1 provides an overview of available and relevant funding streams which may support the development
of a solar cooperative and / or EV car club in Brampton.
Funding Opportunity Assessment
Solar PV
Community
Financing
Whilst there are no specific supporting mechanisms for solar PV at
either national of local levels, community financing is an intention of
Brampton 2 Zero via a share raise.
Community solar cooperatives have had success in the UK using
community share offers and bond offers to raise finance.
This can be a low-cost source of finance which may attract
environmentally and socially aware investors.
VAT
To support households against rising inflations and energy prices, in
April 2022 the UK government scrapped the previous 5% VAT tariff on
energy-saving measures, which includes solar panels. In March 2027
this period will finish and a VAT rate of 5% will return.
Smart Export
Guarantee (SEG)
In January 2020, the UK Government replaced the Feed-in Tariff (FiT)
with the Smart Export Guarantee (SEG), under which energy companies
offer competitive tariffs for exported renewable energy to the grid.
SEG rates are available for solar panels, hydro power, wind power,
anaerobic digestion, and micro combined heat and power (CHP), and
currently range from as high as 18p / kWh down to 1.5p / kWh.
Power Purchase
Agreement
(PPA)
For larger scale and aggregate export (>100kW), it is possible to enter
into a direct contract with an energy supplier to sell the power
exported from site. Scene has recently secured a PPA with Younity
(which exclusively buys community renewable energy) for 18.5p/kWh.
Electric
Vehicles &
Charging
OZEV Grant
Scheme
The EV charge point grant provides funding of up to 75% towards the
cost of installing electric vehicle smart charge points at domestic
properties across the UK. The scheme is available for tenants, landlords,
carparks, and staff fleets, and species a list of approved electric vehicle
models, charge point models, and technical installers whose products
and services they help to fund.
The Workplace Charging Scheme (WCS) is a separate funding
mechanism, issuing vouchers to support the up-front costs of
purchasing and installing electric vehicle charge points for eligible
businesses, charities, and public sector organisations.
Workplace
Charging
Scheme (WCS)
The Workplace Charging Scheme (WCS) is a voucher-based scheme for
businesses for electric car charger installation. It can cover up to 75% of
the cost and a maximum of £350 for each socket, for up to 40 sockets.
This may be an appropriate route for charger installation at non-
domestic premises and possibly at the Brampton community centre.
On-street
Residential
Chargepoint
Scheme (ORCS)
The On-street Residential Chargepoint Scheme (ORCS) provides funding
for local authorities towards the cost of installing on-street residential
electric car chargers. This is great for people who don't have off street
parking.

44
Funding Opportunity Assessment
The scheme, run by the Energy Saving Trust (EST) for OLEV, has an
allocated pot of money available to local authorities on a first-come,
first served, basis.
This funding route would require partnership with the local authority to
implement.
Plug-in Car
Grant (PICG)
This grant is available through car manufactures and dealerships who
pass the discount to customers. The vehicles have to be on the
government's approved list. Grant available for car purchase is up to
35%, capped at £1,500
Table 7.1 - Funding opportunities for solar PV and EV infrastructure
7.1.1. Community Financing
A community share or bond raise is a good way to raise finance for community-owned energy projects. Share and
bond offers have been used frequently throughout the UK community energy sector over the last decade,
financing all types of low carbon energy infrastructure.
A share issue is an offer for shares by a company or an industrial and provident society (IPS) (i.e., Cooperative).
Bond issues or loan stock issues (the terms are interchangeable) are offers to several people to lend money to an
organisation on similar terms for several years. It is long-term debt capital.
Several organisations in the UK support share and bond offers from community organisations, including Co-
operatives UK, Ethex, Sharenergy, and Resonance. Share and Bond offers can be time-consuming tasks due to the
level of advertising, engagement, and administration required to successfully raise the required level of finance.
It is highly recommended that B2Z work with a recognised expert partner for any share or bond offer issue.
It is important to understand investor motivations when it comes to community shares, enabling the issuing
organisation to clearly state the benefits of their proposed project in a way that captures investor attention and,
in turn, secures investment. Co-operatives UK (2020) details investor rationales (Figure 7.1), demonstrating that
financial performance and returns, whilst important, are not the most critical underpinning factor in most
community share raises.
Figure 7.1 – Reasons for community share investment (Cooperatives UK, 2020)

45
Figure 7.2 provides an overview of the share / bond offer process, detailing the steps required prior to, during and
after a community-financed project.
Figure 7.2 – Share / Bond offer journey
Share / Bond Adminstration & Management
Implement Project
Secure Agreements & Investment
Launch Campaign
Secure Campaign Partner (if required)
Develop Share / Bond Offer Document
Develop Business Plan
Constitute Organisation
Conduct Feasibilty Study

46
As detailed within this study, both a solar cooperative and EV car club are viable within Brampton, both in terms
of level of local demand, as well as from technical, financial, and environmental perspectives. This study has
focused on defining project proposals which are more than financially viable, seeking to deliver the greatest local
economic, social, and environmental impacts whilst ensuring the self-sufficiency of the overall solar cooperative
and car club.
This report finds that:
• There is sufficient demand and interest from residents and businesses to develop a number of viable
sites for solar PV in Brampton. Non-domestic is seen as the primary opportunity due to the established
level of interest and high potential solar PV capacities which could be implemented on non-domestic
rooftops. Domestic solar PV could form an integral part of a solar cooperative, but further work is required
to establish interest and model solar PV capacities for specific domestic properties.
• Based on our analysis, there is the potential for 1.31 MW of non-domestic rooftop solar PV generation,
producing 1,069 MWh of low carbon electricity and offsetting 112 tCO
2
e annually.
• Additional of just 10% of Brampton’s domestic properties to these figures would increase generation
capacity by 0.69 MW, totaling 2.0 MW of domestic and non-domestic rooftop solar PV generation,
producing 1,632 MWh of low carbon electricity and offsetting 156 tCO
2
e annually.
• Integration of battery storage would help to increase the level of local energy use by up to 40%,
therefore reducing property owners’ energy bills and increasing revenue for the solar cooperative.
Further assessment of specific battery storage capacities and costs is required on a building-by-building
basis.
• Development of non-domestic properties would require capital expenditure (CAPEX) of £1.4m, with an
annual operating expenditure (OPEX) of £29,000. With battery storage integration, total costs would
total £1.9m with an operating cost of £38,000.
• Based on the revenue generation assumptions made, the proposed scheme would have an annual income
of £208,000, comprised of electricity exports (44%) and PPA income from cooperative member properties
(56%). This would rise to £379,000 with battery storage integration, from export (8%) and PPA income
(92%).
• Lifetime Net Present Value (NPV) for the proposed cooperative would be £0.85m with an internal rate
of return (IRR) of 5%. With battery integration NPV would total £2.8m with an IRR of 7%. All financial
analysis assumes a community share offer is issued, raising all finance through this means and providing
an annual share return of 4% to investors from year 2 onwards.
This report finds that.
• There is demand and interest from residents to develop an EV car club in Brampton, obtained from a
community survey and via anecdotal evidence. Further engagement and demand assessment is
recommended to ensure the demand assumptions made within this report are valid.
• Based on our analysis, there is sufficient demand to support the development of a car club with an
estimated 3 vehicles and 3 x 22kw fast chargers. As anticipated, the greatest level of demand is within
the town of Brampton, although there are pockets of demand in rural locations which should be
considered.
• Developing a car club with a regular user base of 100 users would require a tariffing structure which
includes membership fees (£60 / year), single journey fees (£7 / journey) and mileage fees (£0.14 /
mile). This is in line with both community and commercial car clubs in the UK. These figures should be
revised in line with detailed understanding of local transport demand and project costs.

47
• Development of the proposed car club would require capital expenditure (CAPEX) of £101,000, with an
annual operating expenditure (OPEX) of £34,000. Based on the revenue generation assumptions made,
the proposed scheme would have an annual income of £55,000, comprised of membership fees (12%)
and fixed tariffs for car club journeys (56%), and mileage income (32%).
• Analysis of the above values on an individual basis suggest that, compared to a typical car ownership
scenario, an EV car club would be up to £3,000 cheaper annually and reduce user carbon emissions by
around 40 tCO
2
e / year.
• Lifetime Net Present Value (NPV) for the proposed cooperative would be £100,000 with an internal rate
of return (IRR) of 7%. If the EV car club was supplied with electricity for all EV charging from the solar
cooperative, then lifetime NPV would increase to £326,000, with an IRR of 10%. All financial analysis
assumes a community share offer is issued, raising all finance through this means and providing an annual
share return of 4% to investors from year 2 onwards.
A project roadmap has been set out below, demonstrating the scope of works required to develop the heat
network proposal to the point of investment ready.
• Secure Written Interest in Solar Cooperative / Car Club
• Engage with Local Planning Authority
• Ongoing Engagement
Community and Stakeholder
Engagement
• Building-by-building Solar PV Design
• EV Charger Siting
Detailed Design
• Detailed Financial Appraisal
• Constitute Cooperative
• Governance Strategy
Business Plan
• Develop Share Offer
• Secure Partnership(s)
• Marketing and Adminstration
Share Offer Development
• Engage with regulators (e.g., Historic England)
• Grid Application
• Planning Application (if required)
Planning and Grid
• Programming
• Risk Assessment
• Procurement
Implementation Roadmap
•Installation of Solar PV and Chargers
•Purchase of Vehicle Fleet
Construction
• Monitoring & Evaluation
• Ongoing Management & Maintenance
Operation

48
This financial appendix provides an overview of all variables and assumptions used within this feasibility study.
Variable
Value
Notes
Total Installed Capacity (MWp)
1.31
Solar PV Generation / year (MWh)
1,079
Solar PV Capital Expense (CAPEX)
£1,331,424
Based on UKGov solar costs
2
Battery Storage CAPEX
£463,208
Operating Expense (OPEX)
£29,291
2% of CAPEX
Share Raise Interest Payments (Year 1)
0%
Share Raise Interest Payments (Year 2 onwards)
4.0%
Battery Storage Cost
£510
£ per kWh
Electricity Price
£0.40
Power Purchase Agreement Tariff
£0.20
Smart Export Guarantee Income
£0.185
Contingency
10%
Applied to CAPEX values
Discount Rate
3.50%
Annual
Inflation Rate
3.00%
Annual
Project Lifetime (Years)
20
Table 0.1 – Solar PV Cooperative Assumptions & Variables
2
https://www.gov.uk/government/statistics/solar-pv-cost-data

49
Variable
Value
Notes
Capital Expense (CAPEX), including:
£100,500
Vehicle Cost
£30,000
Renault Zoe (or similar)
EV Charger Cost
£5,000
22kW fast charger with installation
Operating Expense (OPEX)
£29,839
Includes insurance, administration, servicing,
maintenance, and management platform costs.
Number Vehicles
3
3 x Renault Zoe (or similar)
Number of EV Chargers
3
3 x 22kW fast chargers
Users
110
From positive survey responses
Membership Fee
60
£ / year
Fixed Tariff
7
£ / Use
Variable Tariff
0.2
£ / mile
Average Journey Distance
796
miles/user/year
Electricity Cost Per Mile
£0.095
Modelled using Renault Zoe and UK £0.28 / kWh (as
of mid-2022)
Share Raise (Year 1)
0%
Share Raise Rate
4.0%
Contingency
10%
Discount Rate
3.50%
Annual
Inflation Rate
3.00%
Annual
Project Lifetime (Years)
20
Table 0.2 – EV Car Club Assumptions & Variables

50
This appendix provides an understanding of non-domestic building size, electricity demand, and carbon emissions.
Non-domestic Site Demand
#
Building assessed for energy demand
Floor area
(m
2
)
Electricity demand
(kWh/year)
Carbon emissions
(tCO
2
e/year)
1
Building 1
556
155,124
30.0
2
Building 2
200
58,800
11.4
3
Building 3
1,400
93,800
18.1
4
Building 4
420
123,480
23.9
5
Building 5
1,325
21,987
4.3
6
Building 6
207
3,435
0.7
7
Building 7
1,319
89,692
17.3
8
Building 8
2,162
86,480
16.7
9
Building 9
330
15,180
2.9
10
Building 10
17,411
713,851
138
11
Building 11
400
17,200
3.3
12
Building 12
500
25,500
4.9
13
Building 13
312
31,512
6.1
14
Building 14
1,400
141,400
27.3
15
Building 15
650
65,650
12.7
16
Building 16
450
27,614
5.3
17
Building 17
2,350
237,350
45.9
18
Building 18
1,524
643,128
124.4
19
Building 19
983
228,056
44.1
20
Building 20
825
83,325
16.1
21
Building 21
965
113,870
22.0
22
Building 22
652
65,852
12.7
23
Building 23
205
20,705
4.0
24
Building 24
443
44,743
8.7
25
Building 25
480
48,480
9.4
Total
3,156 MWh
610.3
Table 0.1 - Estimated electricity consumption and carbon emissions of the non-domestic sites

51
This appendix provides an overview of all community engagement work conducted during this study.
This document provides a plan for stakeholder engagement which supported the feasibility study for a
community solar PV cooperative and EV car club in the town of Brampton. Scene delivered the described
engagement in close coordination with Brampton 2 Zero (B2Z). The engagement methods described were
designed to ensure that residents of Brampton and relevant wider stakeholders were made aware of the
project, offered the opportunity to input into the development process, and to secure the support and
participation of local people in a resulting cooperative and car club.
Stakeholder Overview
The most relevant stakeholders are described and typified below alongside specific outcomes that will
maximise the prospects of a viable cooperative / car club. Further specific information on engagement
actions and methods can be found on page 3.
Stakeholder
Outcome(s)
Brampton 2 Zero
• Ensure B2Z has the necessary information, recommendations, and roadmap
regarding the feasibility of a solar cooperative / car club in Brampton.
Carlisle City Council
(CCC)
• Inform CCC about the project aims, outcomes and impacts.
• Gather data in relation to Council owned / managed land and properties in
Brampton.
• Secure support for involvement in cooperative / car club
• Screen planning requirements.
Landowners
• Gather data on landownership boundaries.
• Inform about the project aims, outcomes and impacts.
• Secure support in principle from landowner(s) for locations of interest.
Non-domestic buildings
(owners / tenants)
• Gather data on energy demand, efficiency, and generation.
• Inform about the project aims, outcomes and impacts.
• Secure support in principle for involvement in cooperative.
Domestic properties
(owners / tenants)
• Gather data on energy demand, efficiency, and domestic generation.
• Inform about the project aims, outcomes and impacts.
• Secure support in principle for involvement in cooperative
Energy Networks
• Gather data on electrical demand and generation headroom on low-voltage (LV)
network.
Regulators
• Inform on project designs and impacts.
• Screen consents and permission needs and activity requirements.
Table 0.1 - Overview of Stakeholder Types and Actions

52
Engagement Action Plan
The below action plan provides a step-by-step guide to how community engagement was managed over the
course of the project. It was designed with a clear hierarchy of engagement, namely: awareness raising;
developing dialogue, building support, securing buy-in. Whilst the below plan is chronological, the
engagement journey may differ between stakeholders in both form and timescales.
1. Awareness Raising
Awareness raising was conducted through several methods:
A. A community engagement event (21
st
June 2022 – see section 4)
▪ Outreach: directly via email, in-person by B2Z
▪ Participants: Invite only residents, businesses, and council, etc.
▪ Format: A short presentation on the project ambition and objectives followed by a
roundtable Q&A session with all participants.
B. A briefing for stakeholders, setting out project ambition, objectives, and outputs as of the end of
phase 1. This will be shared directly and via engagement events.
C. Via direct communications with stakeholders, including requests for information (RFI), emails and
phone calls with stakeholders.
The focus of this stage was on building support in the local area from potential scheme participants (i.e.,
Cooperative members). Engagement with regulators, network operators, etc., was conducted once initial
demand and resource assessments were completed (phase 2 onwards).
2. Developing Dialogue
This stage is where negotiation occurs in the process and will include:
A. Discussing and securing land options for energy generation (solar PV) and mobility (Car club)
infrastructure.
B. Developing discussions with potential members and customers via direct communications and
sharing of the briefing for stakeholders.
The purpose of this stage is to identify opportunities for electricity generation and use, and to further
discussions with stakeholders relevant to these areas. Further to this, identifying potential barriers (e.g.,
regulatory, non-supportive stakeholders) was conducted during this stage, with a view to removing or
reducing these barriers through dialogue.
3. Building Support
This stage is where in-principle support for the project will be developed. This is achieved via:
A. Direct conversations to communicate specific activities, outcomes and benefits relevant to each
potential member property(s), e.g., landowners, anchor loads or key stakeholders.
B. Ongoing engagement with non-anchor load stakeholders to understand and record expected level
of support.
C. Developing support from relevant authorities and regulators through continued information sharing.
The purpose of this stage is to build the critical mass of energy customers / loads which will underpin project
viability.
4. Securing Buy-in
This stage focuses on securing support in writing. This is particularly appropriate for anchor loads during the
feasibility stage but may not be feasible for all properties until detailed individual property energy
assessments are completed.
A. Establishing in-principle support from landowners, anchor loads and key stakeholders via a
memorandum of understanding (MoU).

53
B. Continued engagement with all potential members / car club customers to maintain support and
momentum.
C. Formal screening opinions and advice from regulators based on expected scheme designs.
D. Public presentation and media release of final reporting, project outcomes and development
roadmap.
Engagement Event Agenda
The following details refer to phase 1 / 2 of the above action plan, focusing on a site visit and engagement
event in Brampton.
Event Title: Low Carbon in Brampton
Date: Tuesday 21
st
June 2022
Venue: Brampton // Community Centre
Agenda
10:00am – Arrive Carlisle
10:30am – Short project meeting, including review of plans for the day, resources, and logistics.
11am – Site walkover
• This will include a walk around Brampton to spatially orientate the team. The key focus will be
on generation opportunities (i.e., roof spaces) and mobility infrastructure (car parks, etc.).
• This may be an opportunity to meet specific building owners prior to the event.
12:00pm – Event setup
12:30pm – Event Open
1. Introductory presentation by Phil @ B2Z. (5mins)
2. Presentation from Sandy @ Scene (15mins), introducing solar cooperatives, benefits of community
energy, options available to property owners / tenants, car club rationale, likely impacts of any
projects, and wider work done to date.
3. Question & Answer session (30 mins)
4. Open period for one-to-one conversations, etc. (1hr)
3:30pm – Event Close + wrap up between Scene and B2Z
Resources Required
• Projector and screen (B2Z, if available)
• Laptop (Scene)
• Briefing for stakeholders (Scene)
• Sign-up Sheets (Scene)
• Table & Chairs (B2Z, if available)
Responsibilities
• Send invites (B2Z)
• Create presentation for Brampton (Scene)
• Update and print briefing for stakeholders (Scene)
• Discuss Frequently Asked Questions (All)
